UJ: “Reversal” Setup on “Inside Bar Momentum” Entry (9/100)System has identified a “REV” playbook setup consisting of a trend line break and multiple attempts to possibly capitulate using a broken inside bar “momentum” entry during the third hour of the ASIA 12-Candle Window.
RISK: 1R
TARGET: 4R
***DISCLAIMER***
This is a new system based strategy being live tested for the purpose of gathering data. The system generates between 3-6 signals per session upon detecting a qualifying setup and entry signal. Currently being tested only in ASIA and only using USD/JPY pair. The win rate and expectancy are unknown. Please do not take these trades.
Reversal

E9 ERASER PATTERN
Naming this the E9 Eraser Pattern as it literally erases traders out the game...
Impulse leg creates a peak with liquidity pool above the peak, this area (usually the wick area) is eaten into signalling to go short, as price moves in that direction price is sharply reversed after an internal structure break, trapping said short traders. As price breaks/pushes out of the prior Initial high, triggering buy stops / stop losses, once again we can expect price to sharply reverse.
Ideally we will see an OVERWATCH candle signal print, signalling potential reversal pattern in play.

BTC - The Bulls Are Back 💪Greetings, TradingView Family! This is Richard, also known as theSignalyst.
As per my last BTC analysis, we know that the bulls took over by breaking above the 26,500 high.
📈 For now, the bulls remain in control and we are expecting a movement till the 29,000 supply zone in orange.
📉 Unless the bears manage to take over by breaking below the 27,800 support in red. In this case a movement till the 27,000 demand zone in blue would be expected.
Which scenario do you think is more likely to happen? and why?
📚 Always remember to follow your trading plan when it comes to entry, risk management, and trade management.
Good luck!
Remember, all strategies are good if managed properly!
~Rich

Gold - We Want our Safe Haven Back ❗️Hello TradingView Family / Fellow Traders. This is Richard, also known as theSignalyst.
XAUUSD has been overall bearish trading inside the falling channel in blue, and it is currently approaching the lower bound of the channel.
Moreover, the zone 1800.0 is a strong support, demand and round number.
🏹 So the highlighted blue circle is a strong area to look for trend-following buy setups as it is the intersection of the green support and lower red trendline acting as a non-horizontal support.
As per my trading style:
As XAUUSD approaches the lower blue circle zone, I will be looking for bullish reversal setups (like a double bottom pattern, trendline break , and so on...)
📚 Always follow your trading plan regarding entry, risk management, and trade management.
Good luck!
All Strategies Are Good; If Managed Properly!
~Rich

Reversal Pattern | Long BiasDaily Chart
I figured out Inverse Head Shoulders that's reversal pattern with neckline is broken and below price now.
OP is trading at 1.36x and I expect OP will go up to 1.63 and higher after completed reversal pattern
Wait for next move

⚡️ Gov SHUTDOWN?! Market will tank?! What to do in this case? ⚠️⚡️Some shutdown insights with chart:
Chart shows longest shutdown: 12/22/18 - 1/25/19
The fear factor has always been PRE-shutdown. Not DURING or POST-shutdown.
⚡️ That means what?
If we shutdown, we may dip say 2-3%.
But what happens during shutdown?
You'd be surprised market actually RECOVERS during shutdown. BY A LOT.
During the shutdown in 2018-2019, the market recovered the ENTIRE DIP, whole +15%.
That's the same thing that happened in 2013. The market rose 3% during shutdown.
⚡️ So is shutdown really bad for markets?
No. Only shutdown fears really cause a dramatic effect BEFORE it happens.
Remember the psychology of "priced in". Once a shutdown happens and market reacts for a day or 2, it's priced in.
⚡️ But why?
After the shutdown happens, anything is good news.
If they announce a deal, that's good news.
If they vote, that's good news.
Thus, market does well during shutdowns.
Good luck. 🙂
AMEX:SPY NASDAQ:QQQ NASDAQ:TSLA NASDAQ:AAPL AMEX:DIA

PROSBUSD - Bump and Run Reversal Bottom PatternThe bump-and-run reversal bottom is a chart pattern that is a surprisingly good performer in both bull (ranking best for performance) and bear markets (ranking second best). It has a low break even failure rate and high average rise after the breakout. Discovered by Thomas Bulkowski in 1999.

BURGER KING (RBA) Possible long entry The share is making a comeback. Showing some strength after long downtrend.
I would accumulate slowly waiting upto a clear confirmation from neckline break in the charts.
and most importantly a Golden crossover has already formed.
Target price is Rs.200 anytime during the year 2024.
Note: Trade with caution! Do not trade solely based on my strategies, these are just individual ideas, kindly consult your investment advisor before taking trades.

ETH - Bulls Are Strong 💪Greetings, TradingView Family! This is Richard, also known as theSignalyst.
Based on my last ETH analysis, we know that the bulls took over by breaking above the 1610.0 resistance.
📈 Now we are expecting a movement till the 1700.0 resistance.
📉 The bulls will remain in control, unless the last low 1650.0 is broken downward.
📚 Always remember to follow your trading plan when it comes to entry, risk management, and trade management.
Good luck!
Remember, all strategies are good if managed properly!
~Rich

XAUUSD_28.09.2023_Potential Price ReversalXAUUSD
1. If we see in daily timeframe, currently price in support area.
2. In daily timeframe, price looks to develop triangle pattern.
3. In H-4 timeframe, price in fibonacci retracement 161.8
Previously, prices had decreased quite significantly, so with 3 points above we can wait and look for a position to make a good purchase.
Notes:
*) This is a personal analysis, please adjust it to the existing conditions.
*) nThis is not a buy/sell recommendation. This is just my personal analysis.
*) Please analyze again, because you are responsible for your decision. Your losses are your responsibility, your profits are yours.
*) I'm still in the learning process, let's learn together :)
Thank you

TRIDENT Long opportunityNSE:TRIDENT
Long term opportunity of approx 25 to 50% up move in price unless the stock changes to downtrend.
Have reversed after downtrend and forming support level.
Target price: (Rs.50 - 60)
Note: Trade with caution! Do not trade solely based on my strategies, these are just individual ideas, kindly consult your investment advisor before taking trades.

Banks Across Europe Pause for Breath after Mammoth Rate Hike RunHello guys, my idea on EURGBP is that we are overall in a uptrend and due to the pause for breath after the mammoth rate hike run the trend might reverse or continue little higher before we expect a reversal to the downside.. trade safe. James ❤

QQQ strangle on bear flag/ reversalI have to post on the 15 min, but here's the 5 min:
This is a clear and obvious bearish continuation/ descending triangle. But being 1.20% down already ( NASDAQ:QQQ / AMEX:SPY ), we can't be sure that it'll continue to 2%. So the easiest thing to do is get a strangle. Watch for outcome. Posted a strangle yesterday too and it went +150%.
Thanks for reading.
Welcome to follow me for more tips on how to trade with discipline.

Price action tightening on $QQQ: impulsive move coming.I think it'll pop downwards because of this diamond bottom. But it's anyone's game here. A strangle would probably pay best.
Just watch for future reference.
Should affect NASDAQ:QQQ NASDAQ:TSLA AMEX:SPY as well.

3I INFOLTD possible uptrend in futureNSE:3IINFOLTD
After a long down trend, the stock has consolidated and reversed from its 52 week low of Rs.26.25.
Showing good and steady accumulation overtime.
Up move short term (1 to 3 months) target: Rs. 55.
Up move long term (3 to 6 months) target: Rs. 75
Would look at short trade if goes below 35.
Note: Trade with caution! Do not trade solely based on my strategies, these are just individual ideas, kindly consult your investment advisor before taking trades.

AUDUSD DOWNTREND CONTINUATION FOLLOWING USD INTEREST RATES 09/23AUDUSD has been in a bear market July 2023.
Price stalled out and ranged since August 2023.
We have since seen bulls try to break out of this 3-month range and failed every time.
The resistance is around 0.6530, which is yet to be broken.
We recently have seen a strong rejection of that resistance following last weeks USD interest rates.
The Australian Dollar has been a weak currency in the basket of majors for several months this year and the United States Dollar has been getting stronger.
I am awaiting my trigger just below 0.64159 and am a bit late to the action so my P/L will not be as ideal as I planned but I will take what I can get and still be realistic with the target which is sitting at 0.6360 lows which is also where many longer term buyers may have their stop losses if the uptrend doesn't work out in their favor.
I will be utilizing a trailing stop loss along the progression of the trade and have my hard stop around today's daily highs in case it does not work out in my favor.
If the trade fails then the price may go back into chop or could be a possible reversal towards range highs of 0.64159.

EURAUD - Looking For Trend-Following Buy Setups↗️Hello TradingView Family / Fellow Traders. This is Richard, also known as theSignalyst.
EURAUD has been overall bullish trading inside the rising channel in orange, and it is currently approaching the lower bound of the channel.
Moreover, the zone 1.63 is a strong support.
🏹 So the highlighted orange circle is a strong area to look for trend-following buy setups as it is the intersection of the green support and lower orange trendline acting as a non-horizontal support.
As per my trading style:
As EURAUD approaches the lower orange circle zone, I will be looking for bullish reversal setups (like a double bottom pattern, trendline break , and so on...)
📚 Always follow your trading plan regarding entry, risk management, and trade management.
Good luck!
All Strategies Are Good; If Managed Properly!
~Rich

Falling Wedge, wait for breakoutChart 1H TF
I figured out a reversal pattern, Falling Wedge.
This pattern combines with Support zone around 1.7 that is very good for reversal.
So wait for a signal to confirm this pattern

WATCH CLOSELY: Megaphones indicate explosive volatility incomingMegaphones indicate explosive volatility incoming.
If spotted at the bottom of a downtrend (like this one), it can indicate an explosive reversal is coming.
Therefore, keep an eye on AMEX:SPY CME_MINI:ES1! CME_MINI:NQ1! NASDAQ:QQQ for a reversal. And of course, all your favorite stocks.
Good luck to all, welcome to follow and stay tuned.

$NSE:DEVYANI possible uptrend continueDEVYANI INTERNATIONAL LTD
There is possibility of uptrend continuation in the future. have given the strategies that I would go with for both short and long trades.
Expecting to reach Rs. 250 - 275 anywhere by year 2024
Note: Trade with caution! Do not trade solely based on my strategies, these are just individual ideas, kindly consult your investment advisor before taking trades.

Compressing for massive moveFX:EURCHF has resistance around 0.96 and support by lower descending trend line
Besides, I figured out the reversal pattern Inverse Head Shoulders
FX:EURCHF needs to close above the neckline to confirm for this reversal pattern
Wait for next move

Reversal for uptrend after a long downside for FIBERWEB INDIAFIBERWEB INDIA
Probable reversal for uptrend in the charts.
My target is Rs. 45-50 by anywhere in Year 2024.

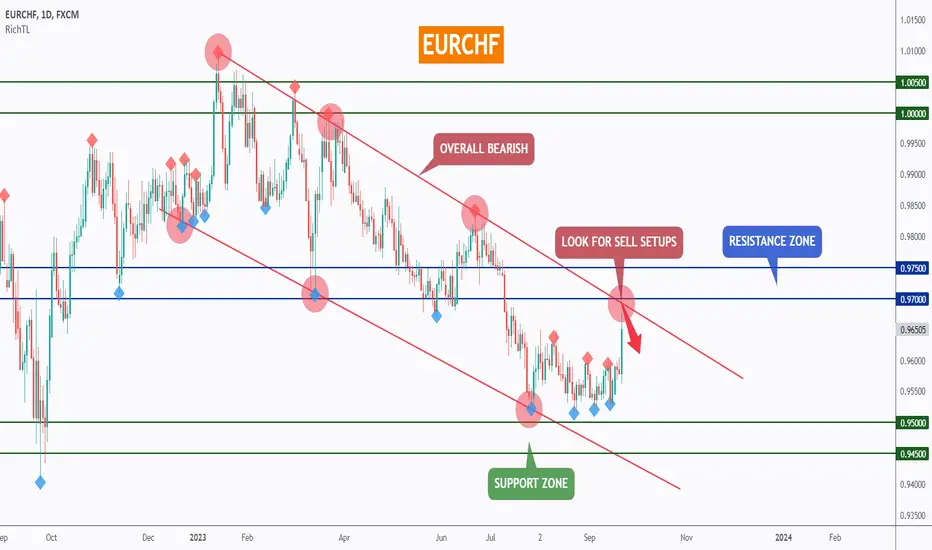
EURCHF - Already Overbought ↘️Hello TradingView Family / Fellow Traders. This is Richard, also known as theSignalyst.
EURCHF has been overall bearish trading inside the falling channel in red, and it is currently approaching around the upper trendline.
Moreover, the zone 0.97 - 0.975 is a strong resistance.
🏹 So the highlighted red circle is a strong area to look for sell setups as it is the intersection of the blue resistance and upper red trendline acting as a non-horizontal resistance.
As per my trading style:
As EURCHF approaches the red circle zone, I will be looking for bearish reversal setups (like a double top pattern, trendline break , and so on...)
📚 Always follow your trading plan regarding entry, risk management, and trade management.
Good luck!
All Strategies Are Good; If Managed Properly!
~Rich