FORD fell after good earnings - now reverses LONGFORD on the 2H chart double topped in mid July and then descended as it had reached
the second deviation line above the mean anchored VWAP. It continued the fall had a bit
of pre-earnings run up and then paradoxically fell with very decent top and bottom line
earnings. If you know why please let me know. After earnings and the fall, FORD reached
the long-term mean VWAP and reversed as can be seen on lower time frames. I see this
as a VWAP bounce, the favorite place for institutional traders to make their trades. A volume
profile and its POC line find the highest trading volumes of the time interval. the MACD
and Price Momentum Oscillators are confirmatory with reversal signals. I will take a long
trade here. The stop loss will be 13 below VWAP. Targets are 14 (25%) 14.5 (50%) and 14.85
(25%). This is a simple trade with $0.25 risk which will be eliminated once price gets
to $13.5 making it risk and stress-free. I have an options trade in mind. Comment if
you want my specifics.
Reversal

NIFTY to start falling more than S&P500 from next week onwardsNIFTY/SPX chart has hit the upper trendline of ASCENDING WEDGE this week. it had hit the upper trendline 2 TIMES and the lower trendline 3 TIMES till now and has reversed every time since 2020
we can clearly see that whenever the price has reversed from the LOWER TRENDLINE , NIFTY has started performing better than S&P500 and whenever price has reversed from the UPPER TRENDLINE S&P500 has started performing better than NIFTY
Now that the REVERSAL is imminent in the WEDGE pattern and global markets are VERY BEARISH , hence we can expect that the BEAR RALLY of indian market is over and it will become MORE BEARISH than the USA market from the next week onwards
SP:SPX
NSE:NIFTY
Thanks a lot for reading...

UPST mid-term VIEW Pre Earning LONGUPST on the daily chart with 2022-2023 in range shows a downtrend of more than 70% and
now a round bottom reversal. The volume profile shows the high volumes of the high volume
area which is relatively thin and mostly below the current price. That is to say, UPST has a
lot of volume voids to fill on its way back to $162 . The Triple EMA ( 200,100,50) shows
a convergence over a long interval followed by the reversal and now divergence. The
MACD indicator is upgoing as are the trends of the dual RS lines of the RSI indicator. I see
this as a long swing trade or investment while UPST is awaiting earnings next month.
For targets, I plan the red lines generated by the volume profite and so $94 and $161.
UPST is on my current favorite stock list. My current holding includes an option striking $51
for 8/4. I will roll that option over about 8/2 to avoid time decay. Additionally,
I will buy another option striking $75 and expiring on 9/15 costing about $950 at the
market price with the bid/ask spread of about 4%. I expect the combined two call optins
will yield on average 5-7% per trading day and may hold them through the earnings period.
The only downside risk is that an earnings beat is somehow already priced into UPST
and that the momentum will decelerate and fade. Buying the contact cheap and out of
the money seeks to manage that risk.

EURUSD late long biashi,
when price 1.09 discount area, look for lower time frames for a bullish choch and get in to uptrend. now it is early under 0.61 level pressure to long, wait for end of bearish trend.

CHFJPY - Following The Trend ↗️Hello TradingView Family / Fellow Traders. This is Richard, also known as theSignalyst.
CHFJPY has been overall bullish trading inside the rising broadening wedge in red, and it is currently retesting the lower trendline.
Moreover, the blue level is a strong support.
🏹 So the highlighted purple circle is a strong area to look for buy setups as it is the intersection of the blue demand and lower blue trendline.
As per my trading style:
As CHFJPY is sitting around the purple circle zone, I will be looking for bullish reversal setups (like a double bottom pattern, trendline break , and so on...)
📚 Always follow your trading plan regarding entry, risk management, and trade management.
Good luck!
All Strategies Are Good; If Managed Properly!
~Rich

TSLA Weekly Longterm Pre-EarningsTSLA on the weekly chart appears to be in a widening and ascending channel somewhat
suggestive of a megaphone. At the same time it is below heavy resistance at 360 which is
the same level as two standard deviations above the mean VWAP line anchored back to
November 2021. The resistance zone is the highs of November 2021 and late March / early
April 2022. The double RSI indicator shows RS rising on the higher monthly time frame slowly
and steadily while the RS on the lower daily time frame has peaked at 88 and fallen below 80
consistent with bearish divergence. The zero-lag MACD indicator shows the lines perhaps
impending a cross at an amplitude well extended above the histogram. Price is high in
that widening ascending channel.
Overall, I conclude that TSLA is a hold right now as it could be impending a significant reversal
in the weeks ahead. A hold would mean not to sell existing positions nor take new positions
for the time being unless one is an intraday or short time frame swing trader or stocks
or options. With an earnings report impending, TSLA volatility is likely to jump in one direction
or the other.

Is the SNAP Sell Off overreaction a Reversal Setup?Yes, I think that it is. On the 15-minute chart, the price action of the post-earnings
drop is seen The earnings beat the analysts. Price has started a low momentum
recovery. The dual time frame RSI shows the low/blue line RS rising above the
high/black line. SNAP is in the deep oversold and undervalued territory in the area
of the lowermost intermediate-term anchored VWAP lines. The mass index indicator
triggered a reversal in the pre-market hours today. I will take a cautious long trade
here expecting a price appreciation to 11.8 at or below the mean black VWAP.or about
10%.

AMZN a long reversal tradeAMZN on the 30 minute chart has descended from a double top / head and shoulders pattern
in early to mid July and is now set up in the lowest VWAP bands in oversold undervalued
territory. The RSI shows lines bounced from the lowest green line set at 20. the low time
frame blue- 5 minute line has crossed above the higher 60 minute black line time frame
and they are both above the 50 level demonstrating bullish momentum in the early reversal.
The mass index indicator crossed above the reversal zone and then down triggering the signal.
I will take a long trade on AMZN seeking to profit from this reversal with about 8% near term
upside. The trading plan's targets are in the text boxes on the chart.

EURCHF - from Daily to M30📹Hello TradingView Family / Fellow Traders. This is Richard, also known as theSignalyst.
📈 Here is a detailed update top-down analysis for EURCHF.
Which scenario do you think is more likely to happen? and Why?
📚 Always follow your trading plan regarding entry, risk management, and trade management.
Good Luck!.
All Strategies Are Good; If Managed Properly!
~Rich

EURUSD - Be Patient ⏱Hello TradingView Family / Fellow Traders. This is Richard, also known as theSignalyst.
EURUSD has been overall bullish trading inside the rising broadening wedge in red, and it is currently retesting the lower trendline.
Moreover, the zone 1.10 is a strong support.
🏹 So the highlighted purple circle is a strong area to look for buy setups as it is the intersection of the blue demand and lower blue trendline.
As per my trading style:
As EURUSD is sitting around the purple circle zone, I will be looking for bullish reversal setups (like a double bottom pattern, trendline break , and so on...)
📚 Always follow your trading plan regarding entry, risk management, and trade management.
Good luck!
All Strategies Are Good; If Managed Properly!
~Rich

COST the retailing warehouse chain LONGCOST had lackluster earnings two months ago and is due for another report in
late September, Despite the earnings miss, COST immediately uptrended as if
traders and investors were expecting far worse. Since June 1st, COST has been
in an ascending parallel channel bounded by the dynamic support and resistance
of the first and second VWAP standard deviation lines above the mean as anchored
to a date before the earnings. The MACD is currently showing bearish divergence
while COST is at the upper resistance in the channel. As a result I will place
a short trade on COST here with a stop loss above that red dynamic resistance
line. Upon managing the trade, I will close and reopen the trade long when price
meets the lower support blue VWAP line and is likely to reverse.

🔥 INJ Perfect Reversal Area: Wait For Bounce!INJ has been trading bullish alongside an upward trending support line. With INJ reaching the support again, we're going to scout for an entry.
BTC is currently trading (and potentially reversing) from a massive area of resistance, so we're going to decrease our risk and wait for INJ to bounce off the support and close the daily candle above 9$. Only then will this trade be activated.

Triangle pattern Reversal in SIEMENSSIEMENS LTD
Key highlights: 💡⚡
📊On 1D Time Frame Stock Showing Reversal of triangle Pattern .
📊 It can give movement upto the Reversal target of Above 3810+.
📊There have chances of Breakout of Resistance level too.
📊 After Breakout of Resistance level this stock can gives strong upside rally upto above 4400+.
📊 Can Go Short in this stock by placing stop loss below 3530- or last swing Low.

Divergence on Petronet Weekly ChartThe weekly chart analysis suggests a potential upward movement. The 14-day stochastic oscillator has reversed from the oversold zone, indicating a momentum shift. Price found support at 220 level. A fresh divergence on the chart adds to the indication of an upcoming upward trend.
Buy at Market, Target at 235, Stop Loss at 218

usdcad buy tradeusdcad buy trade
possible buy opportunity
price creating a head and shoulder pattern on 15min chart

NAS100 Reversal 21.07.2023Yesterday the NAS100 underperformed with a great downward rapid movement.
It is an apparent reversal after a long upward path.
It is Friday and we are not expecting much activity after the NYSE opening,
however it is expected that a retracement will take place after this reversal.
As per the arrow, back to the 61.8 Fibo level.
__________________________
Information Regarding Important News and Figures can be found here in our Economic Calendar: mau.bdswiss.com/economic-calenda...
Risk Warning: Trading in CFDs is highly speculative and carries a high level of risk. It is possible to lose all of your invested capital. These products may not be suitable for everyone, and you should ensure that you fully understand the risks taking into consideration your investment objectives, level of experience, personal circumstances as well as personal resources. Speculate only with funds that you can afford to lose. Seek independent advice if necessary. Please refer to our Risk Disclosure.
BDSwiss is a trading name of BDS Markets and BDS Ltd.
BDS Markets is a company incorporated under the laws of the Republic of Mauritius and is authorized and regulated by the Financial Services Commission of Mauritius ( FSC ) under license number C116016172, address: 6th Floor, Tower 1, Nexteracom Building 72201 Ebene.
BDS Ltd is authorized and regulated by the Financial Services Authority Seychelles (FSA) under license number SD047, address: Tenancy 10, Marina House, Eden Island, Mahe. Payment transactions are managed by BDS Markets (Registration number: 143350).

Can VZ reverse with earnings coming up?VZ on the 2H chart has been in a trend down since July 5 and the fall is accelerating
in the past three trading days. Earnings are a week away. The dual time frame RSI
indicator shows the weakness with RS in the oversold and undervalued zone while
the zero-lag MACD shows hard bearish momentum. Relative selling volumes are
about 3X the mean. Overall considering that price is now three standard deviations
below the mean anchored VWAPs set in March and April I believe that price is now
at or near the bottom. Accordingly I will watch for signs of a reversal on a 30-60
minute time frame from which to consider a long entry. the upcoming earnings
could increase volatility and potential profits if VZW can rally some trader interest.

Will JPM higher after earnings ?JPM is in an uptrend since earnings the morning of July 14th at the end of the
trading week. On the 1H chart with VWAP band lines anchored to a week before
earnings as a dynamic support and resistance reference shows a rise from below
the first standard deviation above the mean VWAP to above it with a pullback
after the earnings and then a continuation at the depth of the pullback today
July 17th.
The two-time frame RSI indicator shows the lower TF blue line moving lower
despite the uptrend today. This is suggestive of bearish divergence.
The zero-lag MACD shows a cross of the lines above the histogram suggesting
a reversal as does the green to red and positive to negative on the histogram.
As a result, I will watch JPM for reversal and a put option or short sell stock
trade.

Shooting Star Reversal bearish divergence at resistance Weekly Possible shooting star reversal on the weekly if the next candle closes lower. We are at overhead resistance and there is bearish divergence on the RSI. Could be the bull trap that brings us back to the bottom of the pattern. If we lose all the support levels, we could test the lows again.
BTC is up 100% since the beginning of the year.
The appearance of this pattern at a resistance level is significant as it might suggest a potential exhaustion of the buying momentum.
Could be a pullback consolidation at support before moving to much higher prices in the future.

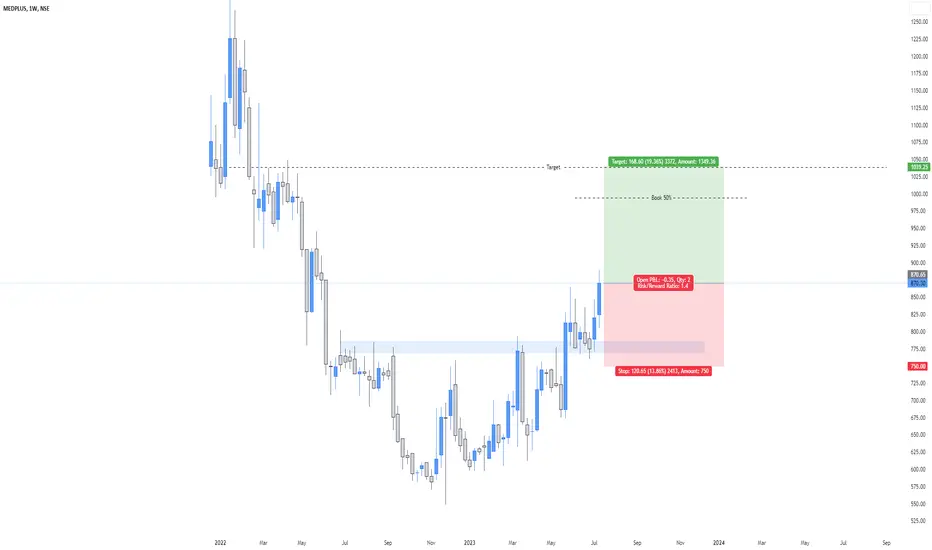
MEDPLUS: A good reversal stockMEDPLUS Chart looks good
It is showing some reversal trend!
You can keep this is watchlist
Don't missed nearly 4% | Reversal PatternDaily Chart
Gold ( OANDA:XAUUSD ) has bounced EMA200 and Support Level at $1893 and it's trading around $1925.565 now
Chart 4H TF
Gold just has completed a right shoulder and all we need is a breakout and closed above neckline
Wait and see next move

COP- Divergences suggest bearish reversal.COP has had a brief trend up in the past three and a half trading days of about 8%. An analysis
of the 30 minute chart suggests this could reverse. Firstly, the HA candles are now narrow-
ranged and more or less Dojis. The MTF RSI indicator of Chris Moody shows dropping RSI
on the 5 minute TF while it is hold up at 100 on the 60 minute TF. The former is indicative
of bearish divergence. In a similar fashion the zero lag MACD shows an early cross-over of
the K and D lines over the positive histogram another bearish divergence and sign of impending
reversal of momentum. Based on all of this I will take two put option on COP striking $110
one expiring 7/14 and the other 7/21 targeting stock prices of $105 then $102. I am projecting
profits of 25% on the shorter trade and 75% on the longer trade. I will find the entry on the 5
minute chart looking for a pivot high coupled with a transitioning EMA200 from a positive slope
to zero or negative. Other traders may simply short COP and hold to the lower target.

KO - a Warren Buffet Fav setup long from bottom of cycleKO as a long standing Buffet holding- is a slow mover with a decent dividend. For stock and
options traders like myself, it is now well positioned for a long trade. KO's recent pivot
highs were early to mid May with the highest trading volume at $64 according to the interval
volume profile. KO descended mid-May into June 1st and then had a Fib. retracement and
reversal. On the 4H chart, KO price is now at the bottom of the high volume area of the overall
while the RSI / MTF ( Chris Moody) shows relative strengths in the range of 25.
I see this as a classical opportunity to buy low and sell high. Trade specifics are a stop loss
of 59.30 and targets based on anchored VWAP lines of 61 (25% off) 62.5 (50%) and
63.75 (25%). As a low-risk trade for the stop loss compared with the potential profit, I will
devote 5 % of the account to this trade. Once price hits $60.25, I will raise the stop loss to
the break-even price of the entry and the trade will become stress and risk free. I will
select an entry buy focusing down onto the 5-15 minute time frame. Profits from a low
risk trade like this will be re-deployed into others a bit riskier as a means of stratifying
risk and its managment.
