EURUSD reversal signalI placed a short entry with an 11 pip stop loss. I believe that this intraday uptrend is over, and this week will be relatively bearish beginning with last Friday's daily indecision candle and false break of a resistance.
Reversal

#joe long RR 11 r i s k yits support is very thin and it looks very delicate but it can be a great trade with a very short stoploss.

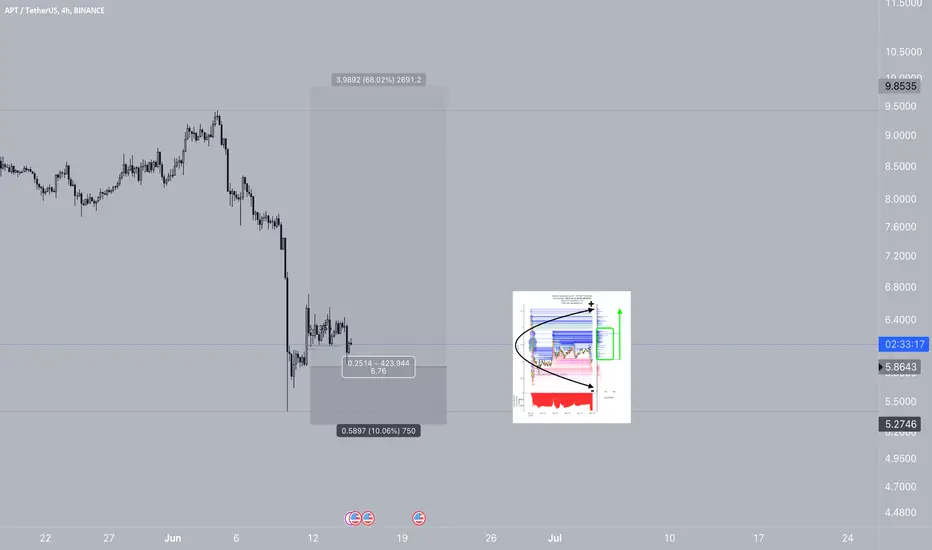
#apt long RR +-7 r i s k yThis is a somewhat more risky trade since the stop can be turned to a 4h candle close as the chart indicates, which we are talking about possible traps, but beyond that if Btc really fulfills this as its support we should see good squeezes .
ETHUSDT bullish signals resulting from the BSR and BTIOn the ETHUSDT 4-hour chart we just saw 3 nice buying signals from the Blockunity Strength Reversion (BSR) and Blockunity Trend Identifier (BTI) indicators.
As per usual let’s first explain what you see on the chart.
On the side of the BSR we have:
• In red the BSR Upper Line and in green the BSR Lower Line.
• A blue arrow indicating that the Confirmed Reversal Indicator (CRI) just gave a signal.
On the side of the BTI we have:
• The Volatility-Adjusted MA (VAMA) an evolved moving average that considers the volatility of the asset to better reflect the state of the market. Depicted in a red and green line regarding the position of the asset compared to the line.
• The 1-Day Vegas Cloud in dark blue which is a trend following indication.
Coming to the signals that were just emitted:
• The CRI gave a buy signal which is an indication that the asset was in a long and strong period of excess (blue arrow).
• The last 4-hour candle closed above the VAMA for the first time since yesterday, which is a bullish indication.
• Also, a Combined Buy Signal was emitted, resulting from a bullish VAMA & Zero Lag Signal.
We will have to see if the VAMA can hold the price evolution of ETH and enable it to continue its positive trend of the last few days.

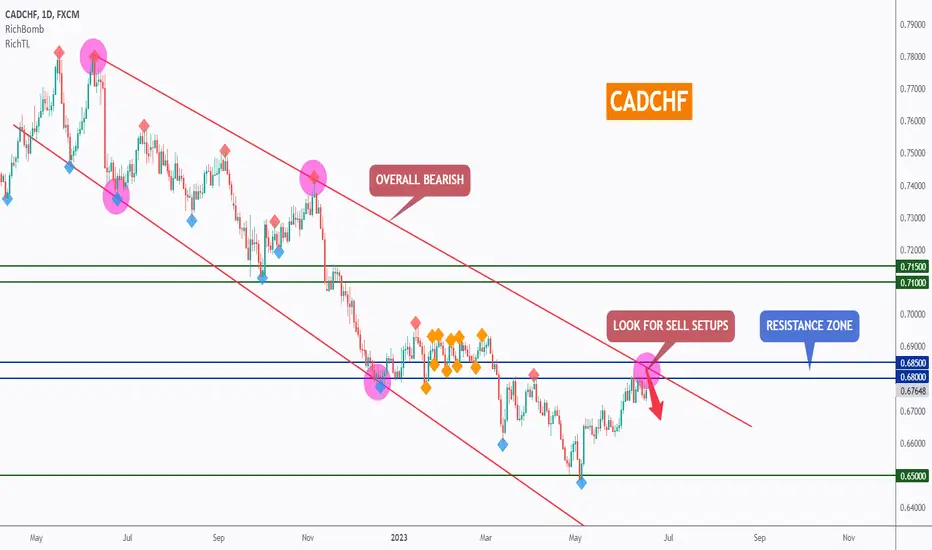
CADCHF - Looking For Sell Setups ↘️Hello TradingView Family / Fellow Traders. This is Richard, also known as theSignalyst.
CADCHF is overall bearish trading inside the falling broadening wedge pattern in red, and it is currently sitting around the upper trendline.
Moreover, the zone 0.68 is a resistance zone.
🏹 So the highlighted purple circle is a strong area to look for sell setups as it is the intersection of the blue resistance and upper red trendline.
As per my trading style:
As CADCHF approaches the purple circle zone, I will be looking for bearish reversal setups (like a double top pattern, trendline break , and so on...)
📚 Always follow your trading plan regarding entry, risk management, and trade management.
Good luck!
All Strategies Are Good; If Managed Properly!
~Rich
#ldo long RR 17Currently this currency runs a liquidity risk in terms of liquidations, beyond that we can see a small support which can be used as something critical, let's go!


GBPNZD - Looking For Sell Setups ↘️Hello TradingView Family / Fellow Traders. This is Richard, also known as theSignalyst.
on DAILY: Left Chart
GBPCHF has been stuck inside a big range and it is currently sitting around the upper bound so we will be looking for sell setups on lower timeframes.
on H1: Right Chart
GBPNZD is forming a wedge pattern in red but it is not ready to go yet.
For the bears to take over, we need a momentum candle close below the last major low in gray.
Meanwhile, until the buy is activated, GBPCHF would be overall bullish and can still break the resistance upward.
📚 Always follow your trading plan regarding entry, risk management, and trade management.
Good luck!
All Strategies Are Good; If Managed Properly!
~Rich

GBPNZD - Looking For Sell Setups ↘️Hello TradingView Family / Fellow Traders. This is Richard, also known as theSignalyst.
on WEEKLY: Left Chart
GBPNZD is sitting around a strong weekly resistance in green, so we will be looking for sell setups on lower timeframes.
on H4: Right Chart
GBPNZD has been overall bearish trading inside the red channel and it is currently sitting around the upper trendline.
🏹 So the highlighted purple circle is a strong area to look for sell setups as it is the intersection of the green resistance and upper red trendline.
As per my trading style:
As GBPNZD is sitting around the purple circle zone, I will be looking for bearish reversal setups (like a double top pattern, trendline break , and so on...)
📚 Always follow your trading plan regarding entry, risk management, and trade management.
Good luck!
All Strategies Are Good; If Managed Properly!
~Rich

Workhorse threatening trend reversalWorkhorse is at the neckline of the trend-line today, it needs a surge 10% above the trend-line for reversal confirmed.

$HOOD - A New Generation, A New Bull MarketState of the Stock
Robinhood’s time in the stock market has been an arduous one and not one without controversy. The stock went public in a hotly anticipated IPO at about $36.41 on July 29th, 2021. It saw tremendous interest in the first week of trading reaching an overly lofty value at ~$85 a share before starting to sell off. This sell off has relentlessly continued and in many places, you will find negative commentary on the stock.
I personally believe that the stock’s price action bottomed on June 17th, 2022 at about $6.84 a share. Since then the stock has been slowly plodding along and striking higher lows, which I will illustrate later in the charting.
I also believe that the stock’s story is close to turning around and could get more positive attention in the later half of this year. I am going to talk about the balance sheet, cost cutting, charts, and the controversy.
I will be limiting my comments on the balance sheet to lines that I believe deserve notice. For this post, I will be comparing Robinhood to their old school rival, Charles Schwab.
The Balance Sheet
(See Robinhood's Financials)
Overall, I read Robinhood’s balance sheet as being quite strong. Particularly in the amount of cash and sort term investments that the company is carrying. At 5.46 Billion in cash and 1.52 Billion in short term investments the company can cover operating expenses (excl. COGS) for about 3.5 years.
The company has also shared that the short term investments are in <1 year term treasuries. Which is quite a good decision given the current rates. I only wish they had purchased a little more than 500 million or so.
As of this writing (6-11-23), Robinhood carries a market cap of ~$8.5 billion as well. Their cash position is nearly the size of their entire equity. In comparison,
SCHW
(Charles Schwab) has about $75 billion in cash and a market cap of 100 Billion. I believe that the market is underestimating how Robinhood can deploy that cash.
Lastly, Robinhood is very close (9.41 market) to their book value per share (7.83). In comparison,
SCHW
has a book value per share of 15.36 and is trading at 55.0 in the market. I believe this illustrates that Robinhood is quite cheap, even after the June ’22 bounce when it was cheaper than the book.
(See Robinhood's Financials)
Next, the cashflow at Robinhood is quite good and turned positive in Q4’22. Whereas their rivals are experiencing negative free cash flow during this same period. Robinhood, on a relative basis for this metric, looks to be outperforming during the banking crisis.
During their earnings calls they have also reported a net increase in deposits as well as assets under custody (AUC) increasing by an impressive 26% due to the run on stocks in 2023.
What I find most interesting about this is that customer cash in Robinhood has steadily grown to $11 billion from $2 billion at IPO. It has been on an impressive path of growth. I believe this is the result of their strong “Brokerage Cash Sweep” program and the rates they’ve been able to offer.
They have been able to effectively remove the friction between treasury yield and their customers. This also creates a beneficial situation where their clients can deploy capital quickly, while maintaining some yield from their cash. Effectively, creating productive reserves for their customers who can choose to deploy it at any moment right on their app.
(See Robinhood's Financials)
Lastly, the company itself is quite close to profitability. The next 4 quarters are projected by broader WallStreet to come in at an EPS of about -0.01 to -0.03. Any positive change in their costs or earnings could lead to a surprise profit. Such as cash from treasury yield, cost cutting measures, new products, or increased business. The company itself continues to stress, that they are becoming leaner as time goes on. I believe that to be true.
Cutting Costs – The Layoffs
In 2022, Robinhood performed several rounds of lay offs. This allowed them to cut Q2 ’22 and Q3 ’22 operating expenses significantly (excl. COGS). This does not appear to have impacted their revenue growth and has given them the added benefit of being ‘right sized’. And to the best of my knowledge, no further lay offs are currently on the table. In fact, their revenue is now higher than it has ever been since IPO at $447 million and is pushing them ever closer to profitability.
“Robinhood Is Laying Off 9% of Its Full-Time Employees”
– Wall Street Journal, Apr. 29, 2022
www.wsj.com
“Robinhood Lays Off 23% of Staff as Retail Investors Fade From Platform”
– Wall Street Journal, Aug. 2, 2022
www.wsj.com
2023 Road Map – 4 Catalysts
Now that we’ve talked about cost cutting, let’s take a look at the road map and see if there are opportunities for fundamental growth. I will list out 4 that I believe can have a positive impact on their business.
Options Trading in Cash Accounts
Margin Outside Gold
Futures Trading
UK Market Expansion
Lets tackle the first two on the list.
Options Trading in Cash Accounts should continue to grow their existing business. This should increase their revenue generated per user as more current customers have access to more products. Options trading is particularly popular among Robinhood’s customer demographic.
Margin Outside Gold I find personally controversial. I personally don’t believe in using margin. Regardless, it should also increase their revenue generated per user.
While both of these are improvements that could turn the company profitable for EPS. They are not as major as the next two items.
Futures trading would open an entire new market for the Robinhood user. I believe it is an incredibley potent catalyst for their user base and will allow their customers to trade more often and in new ways.
Robinhood advancing offerings for active traders
In March, we applied for a Futures Commission Merchant license and, if approved on a typical timeline, we
expect to launch futures trading by the end of 2023.
s28.q4cdn.com
UK Market Expansion should allow them to acquire a significant number of new users.
Robinhood continues to explore growth opportunities, expands access globally
With an experienced team leading and an existing license in place, we believe we’re on track for our
ambitious goal of launching brokerage services in the UK by the end of the year.
s28.q4cdn.com
To summarize, I believe expanding into a new country, the UK, and providing futures trading to their existing customers they expand their business significantly over time.
Lets take a look now at the charts and see what we can find in the price action.
Charting A Path
The first thing of note on Robinhood’s stock chart is that a series of higher lows have been put in. The price action, for the first time since IPO, is showing an increasing pattern in the price. I believe the stock has a classic Falling Wedge which I interpret as bullish. I believe the wedge has formed because of the positive developments in the balance sheet, cost cutting, and the future outlook.
Examining the MACD on the 1D time scale we also see higher lows put in as well as an MACD crossover onto the positive scale. Overall, I read the charts as having increasingly positive momentum. I also believe that momentum is growing, albeit slowly.
Lastly, on the 2D time scale my favorite indicator, DMI, shows the bulls having taken control on ~May 24 2023. I don’t think it’s any coincidence that was the low after the most recent earnings report. I believe the majority of the bears have left the stock as evident by their strength at ~11.5. We also have seen the natural termination of the ADX which implies, to me, that the previous trading trend for the stock has come to an end. A new trend does appear to be forming. It could fizzle out, but that’s up to Robinhood’s management.
I believe all of the necessary setups are currently there for them to succeed as both a company and a stock.
Closing Thoughts & Possible Risks
The Demographic & The Controversy
By discussing Robinhood here, I feel that I must mention reddit’s r/wallstreetbets. The community there has a significant impact I believe on Robinhood’s success or failure.
The community has a significant following and many of their members use the app. I believe they are an opportunity for Robinhood as well as a possible risk. The 14 million members are potential customers for the Futures trading introduction as well as the increased margin offerings.
However, the community has aligned itself with being against the Robinhood app and have been in a ‘boycott’ of the app since the
GME
trading saga of early 2021. While the community is very vocal on the matter, many of the posts continue to show use of the Robinhood app. At a minimum, it remains controversial, but still in use.
This has led me to believe that most of the drama has faded and because of the high quality product Robinhood offers, has started to draw users back to the app. I believe this is well illustrated in their MAU and NFA graphs. There’s a unique opportunity here for them to either win back this community or lose them forever.
This could also be related to the flurry of trading activity seen in stocks related to AI in the past few months.
Heavy Insider Selling
An additional risk is that the insiders, specifically Tenev Vladimir, CEO & Bhatt Baiju, Chief Creative Officer, continue to sell large numbers of shares. This is creating an immense downward pressure on the stock price. If this pattern continues, it could contribute negatively to the stocks performance.
However, I believe that’s a non-issue if the company becomes profitable. I hope that we are approaching the end of the insider selling.
Crypto & SEC Action
Additionally, due to recent events, Robinhood has pulled 3 of their crypto offerings. I believe this is another mixed risk. While they will take a revenue hit by delisting those tokens, they may end up gaining users if customers of Coinbase or Binance decide to take their business elsewhere. It could end up being beneficial to Robinhood, but there’s no way of knowing at this time.
At the time of this writing there has been no report that I can find of Robinhood receiving a notice on the matters affecting Binance and Coinbase. Robinhood instead chose to remove the 3 affected securities voluntarily.
I believe this is the responsible thing to do and well advised. By taking pre-emptive action they are protecting their business from getting entangled in the matter and remaining compliant with the SEC. This is a value the company has stated a number of times during their earnings calls. I believe their actions demonstrate that value and is representative of good governance from the company leadership.
That said, the SEC could still take action against the company if they choose to do so. Therefore, it still carries some risk and must be considered.
Macro & Last Thoughts
So, here we are. It’s June 11th, 2023. Costs are significantly reduced and being controlled, notable Roadmap 2023 objectives are close, plans for new markets and offerings are approaching, and revenue continues to grow. The company is just a few pennies away on EPS from breaking even or potentially turning a profit. There is also significant distance from the drama surrounding GameStop, Robinhood, and WallStreetBets.
The charts are showing higher lows being put in place. More positive momentum looks to be coming into the stock via the MACD. Additionally, the bulls appear to have taken control via the DMI on ~May 24th, 2023.
I believe this is a case where a significant breakout could occur. It remains to be seen if it will, but I believe there is a potential trade here to the upside. It is not without downside risk though and that must be taken into consideration.
Current thinking in the market is that we may be entering a new bull market based off of recent SP500 closing levels. However, the macroeconomic picture still remains unclear. Particularly in regards to inflation, interest rates, and consumer spending.
If it is a new bull market, Robinhood may benefit from increased trading activity, but if the macroeconomic picture deteriorates it could degrade Robinhood’s business and affect the stock.
Either way, I personally believe the stock is in an interesting position within the market.
Trade carefully, trade wisely.
~Kryptonite
As always, please consult the appropriate professionals for any financial decisions. I am not a professional. I am an amateur hobbyist. These are my own personal opinions that I’ve expressed regarding the market and the companies mentioned above. I am not responsible for any decision, trade, or investment you may make.
You should assume that as of the publication date of any report, post, or communication referencing any publicly traded security or asset that Kryptonite Research (myself) may have a position in the security or asset and I might stand to realize significant gains if the price of the stock moves. Following publication of any report, post, or communication, I intend to continue transacting in the securities covered therein, and Kryptonite Research (myself) may be long, short, or even neutral at any time thereafter regardless of Kryptonite Research’s (myself) initial position. I reserve the right to alter my position at any time without notice.
Images are sourced from the TradingView app, Adobe Stock photos, and Robinhood’s Investor Relations. I do not claim ownership.
As an additional disclaimer, at the time of this writing I am a Robinhood customer and holding a position in Robinhood’s stock.

Bitcoin >>> Prepare to Take OffBitcoin Price (BTCUSD Chart) nearly reach it's reversal point at 0.382 Fibonacci level. Bitcoin soon will be back in it's bullish trend in order to enliven the next halving in 2024 and the new world order that probably happen after de-dollarization.
BTC can go lower to the next Fibonacci level below 0.382 but will reach 1.618 in the future

ETH - Boring Range Until... 🕝Hello TradingView Family / Fellow Traders. This is Richard, also known as theSignalyst.
on DAILY: Left Chart
As per my last analysis, we know that ETH is approaching a strong rejection zone as it is the intersection of a horizontal support in green and lower trendlines in blue and red.
So we will be looking for buy setups on lower timeframes.
on H4: Right Chart
🏹 For the bulls to take over from a short-term perspective, we need a break above the previous major low in orange.
Meanwhile, ETH can still trade lower till the daily green support.
Which scenario do you think is more likely to happen first? and why?
📚 Always follow your trading plan regarding entry, risk management, and trade management.
Good luck!
All Strategies Are Good; If Managed Properly!
~Rich

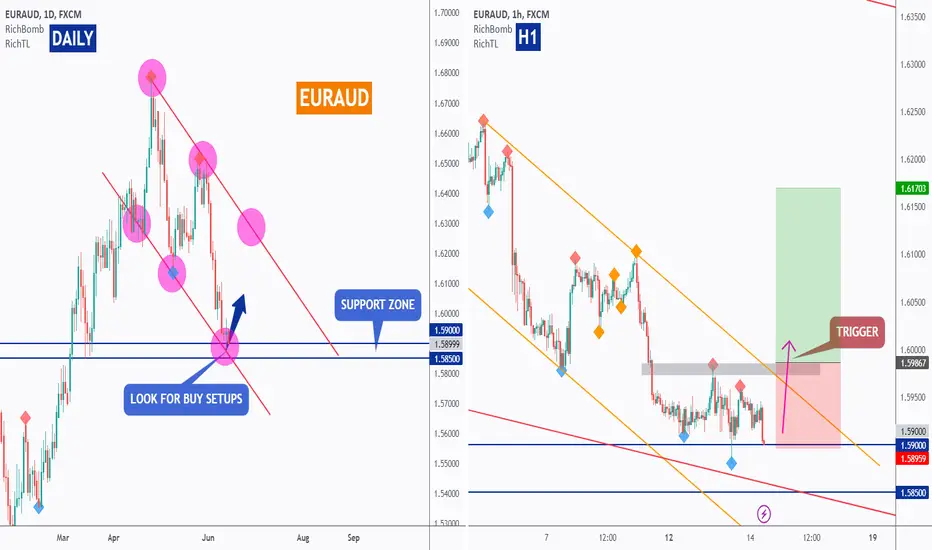
EURAUD - Wait For The Trigger 🏹Hello TradingView Family / Fellow Traders. This is Richard, also known as theSignalyst.
on DAILY: Left Chart
As per my last analysis, we know that EURAUD is sitting around a strong rejection zone as it is the intersection of a horizontal support in blue and a non-horizontal support in red.
So we will be looking for buy setups on lower timeframes.
on H1: Right Chart
EURAUD has been overall bearish medium-term. However, it is diving inside the daily support zone.
🏹 For the bulls to take over , for a potential shift in momentum, we need a break above the last major high in gray and upper orange trendline.
Meanwhile, EURAUD can still trade lower.
📚 Always follow your trading plan regarding entry, risk management, and trade management.
Good luck!
All Strategies Are Good; If Managed Properly!
~Rich
USDJPYA Indecision pullback to resistanceUSDJPY is in an intraday uptrend again. The overall trend is bullish however I believe that this is a re-test of the former high and based on how price is approaching the resistance it doesn't signal much bullish strength anymore. Price is currently at a high of an untested zone, the all time high and a Daily evening star pattern.

AUDUSD - Video Top-Down Analysis!Hello TradingView Family / Fellow Traders. This is Richard, also known as theSignalyst.
Here is a detailed update top-down analysis for AUDUSD .
Which scenario do you think is more likely to happen? and Why?
Always follow your trading plan regarding entry, risk management, and trade management.
Good Luck!.
All Strategies Are Good; If Managed Properly!
~Rich

Procter & Gamble is soon to see good times Ahead
TECHNICALS -
Procter & Gamble has formed a nice Positive Divergence or Hidden Bullish Divergence pattern on the Monthly chart indicating upside momentum on the chart
It has also Reversed Twice from a Strong Support level which had earlier acted as Resistance level indicating further upside potential for the stock
It has also tested 50 Day Moving Average and has reversed from it nicely
FUNDAMENTALS -
It is in the sector of Consumer Non-Durable Goods (healthcare & hygiene) which is an all-weather sector making the stock immune even to the upcoming recession (if it comes at all)
Its EBITDA & Net Profit Margin growth stands at 24% & 17% which beats almost 90% of its peers and ROE is at 31% which is the industry standard
If that's not enough then the stock also gives a dividend with yield at 2.72% and it has paid dividend for 133 years and raised dividend for 67 consecutive years, what could be a better alternative than such a stable dividend paying stock during the upcoming downturn in the market (if it comes)

Shorting a Daily shooting star re-testAUDUSD provided a daily shooting star on Monday which signaled that intraday it may become bearish. This re-test is after a Bearish Engulfing was confirmed on the prior touch. The 4H failed to break beyond a monthly resistance. I took a 1H evening star short beneath resistance.

EURAUD - OverSold Zone Ahead 👌Hello TradingView Family / Fellow Traders. This is Richard, also known as theSignalyst.
EURAUD is overall bearish trading inside the falling channel in red, and we are currently approaching the lower bound.
Moreover, the zone 1.590 is a support zone .
🏹 So the highlighted purple circle is a strong area to look for buy setups as it is the intersection of the blue support and lower red trendline.
As per my trading style:
As EURAUD is sitting around the purple circle zone, I will be looking for bullish reversal setups (like a double bottom pattern, trendline break , and so on...)
📚 Always follow your trading plan regarding entry, risk management, and trade management.
Good luck!
All Strategies Are Good; If Managed Properly!
~Rich

USDJPY rejected at 4H Lower HighI decided to short UJ here as the 4H shooting star at a re-tested area was a bearish enough signal for me to go short. Price has been making Lower Highs on 4H and daily chart. The bullish candles have been forming with a lot of indecision. This entry was taken based on the 4H close, as well as the 1H presenting a strong evening star at a Evening star re-test. My entry was upon a bearish 15min engulfing at a potential high/re-test of resistance. My stop loss is just Above the high of the shooting star. My target is the next daily Lower Low.

Gold broke another correction trendlineI believe that as gold continues to become bullish at support that its willing to break into a higher high. Currently the downtrend momentum is halted by consolidation. Because the overall trend is currently bearish, I will await a reversal candlestick along with volatility on support for any long positions. Potentially a false breakout to the downside. Currently there will be some intraday bearish activity as another shooting star presented at resistance and a bearish engulfing. Price is currently trading beneath the neckline of a double top.

usdjpy consolidating before breakoutUSDJPY is hinting at a momentum swing. The overall trend is still up however price has not been making any new higher highs on the daily, In fact, volatility at the high forms a bearish reversal signal. I believe price is pulling back intraday bullish, but this push isn't very strong. Another daily rejection at the high will trigger a short setup for me.

EURUSD intraday 1st higher highI believe EURUSD is reversing as it formed its first higher high within this consolidation range. ADX was not bullish during this move, however structure was broke. I will look to capitalize on any breakout. I have a zone marked at the bottom of the zone as the daily has formed two bullish reversal candlesticks along with volatility at support. Currently price is at daily swing high, which price failed to break. The 4H has formed a higher high and is retracing with indecision to form a higher low. If the daily support holds. Im long EURUSD.
