Introducing the Bars Since EMA Touch IndicatorHey there traders, Stock Justice here! Are you ready to elevate your trading game? Today, we're going to delve into an exciting indicator I call 'Bars since EMA touch', or 'BSET' for short. Buckle up, because we're about to kick your technical analysis up a notch!
The BSET, at its heart, revolves around the Exponential Moving Average, or EMA. When setting up BSET, you'll be prompted for the length of the EMA, with the default being 9. This number represents the number of bars that will be averaged to create your EMA line. A higher value smooths out the line, reducing noise but potentially delaying important signals. A lower value makes the EMA more responsive, but at the risk of responding to market noise.
BSET calculates how many bars it's been since the price last touched the EMA. A positive number indicates the number of bars since the price was last above the EMA, and a negative number shows how long it's been since the price was below the EMA.
BSET also uses the MACD and signal line to color-code these bars. Blue and red bars indicate price is above the EMA, with blue signaling an upward trend and red signaling a possible downturn if the bar number is above 3. White and green bars indicate price is below the EMA, with white signaling a downward trend and green indicating a possible upturn if the bar number is above 3.
This color-coding can be a useful tool to quickly determine whether a potential reversal is in the making or if the current trend is likely to continue. But that's not all! BSET takes it a step further by keeping track of how often price trends extend beyond certain thresholds, updating these thresholds if necessary.
These thresholds, shown as red and green lines on the histogram, indicate the 15% percentile for bull and bear trends, respectively. If more than 20% of trends exceed the current threshold, it's adjusted upwards. This gives you a historical context for how long trends usually last and can help you spot when a trend is overextended and might be due for a reversal.
BSET is an innovative tool that combines trend tracking with volatility in a unique way, helping you better understand market dynamics and make informed trading decisions. Just remember, every indicator, BSET included, is just a tool. Always use them in conjunction with other analysis methods and never risk more than you're willing to lose.
That's it for now, traders. Keep your eyes on the charts and remember: Trade safe, trade smart! This is Stock Justice, signing off!
Reversal

BOIL LONG a 3x leverage Natural Gas ETF Natural Gas prices have finally reversed on the FOREX markets
after significant downtrends from a historical high.
BOIL on the hourly chart has reversed a two-week downtrend
and today has an increasing volume. Ir bounced off the lower
Fibonacci levels and is looking to revert to the mean. Price
was undervalued below the green fair value zone at the VWAP
+/- one standard deviation but is now heading back into it
from the buying pressure.
As a 3x leveraged ETF is prone to more volatility than the
unleveraged UNG counterpart. I will play this with a call
option contract expiring 3/31 striking $4.00 and expecting
at least a 50% return in the upcoming 8 trading days.
The risk here is that this is just a short pullback on the
downtrend but getting in early on a long and watching carefully
is the approach I have taken.

GBPJPY - Strong Resistance Zone!Hello TradingView Family / Fellow Traders. This is Richard, also known as theSignalyst.
GBPJPY has been trading in range between our blue/green support and resistance zones.
Lately, from a medium-term perspective, GBPJPY has been bullish trading inside the rising broadening wedge pattern and it is currently approaching the upper red trendline.
Moreover, the blue zone 171.0 is a strong resistance.
🏹 So the highlighted purple circle is a strong area to look for sell setups as it is the intersection of the blue resistance and upper red trendline. (acting as non-horizontal resistance)
As per my trading style:
As GBPJPY is sitting around the upper purple circle zone, I will be looking for bearish reversal setups (like a double top pattern, trendline break , and so on...)
📚 Always follow your trading plan regarding entry, risk management, and trade management.
Good luck!
All Strategies Are Good; If Managed Properly!
~Rich

Analyzing $QQQ with the Dual Dynamic Fibonacci Retracement ToolI've been closely monitoring the QQQ ETF, which tracks the NASDAQ-100 Index. It's a popular trading instrument, and I'm always looking for patterns and potential trade setups that might provide interesting opportunities.
In this particular analysis, I used the Fibonacci retracement tool, a widely-used technical analysis method that predicts potential support and resistance levels based on previous price movements. The tool works by drawing horizontal lines at key Fibonacci levels (23.6%, 38.2%, 50%, 61.8%, and 100%) between a significant peak and a significant trough.
In our case, the significant peak was QQQ's all-time high of 408.71 in November 2021, and the significant trough was its drastic fall to 254.26 by October 2022. I used these levels to plot the Fibonacci retracement lines.
On the date of the analysis, QQQ had rallied to a high of 331.71, slightly above the 50% Fibonacci retracement level of 331.46. This is significant because the 50% retracement level is often a strong resistance or support level. As a trader, it's important to watch how the price behaves around these levels.
Now, if this 50% retracement level does indeed act as resistance, we would expect a pullback. But to what extent? To answer this, I plotted a short-term Fibonacci retracement from the October 2022 lows to the current high.
The short-term retracement gives us three potential support levels:
The 38.2% retracement level at around 315.50
The 50% retracement level at around 303.80
The 61.8% retracement level at around 294.34, often referred to as the 'golden ratio' in Fibonacci analysis.
These levels serve as potential targets for the pullback. If QQQ price starts to fall, we'll watch these levels closely to see if they act as support. If they do, it could provide a good entry point for a long position. If they don't, we'll assess if the price could potentially fall further.
Of course, this analysis isn't foolproof. Market conditions are dynamic, and multiple other factors can influence price action. However, Fibonacci retracement levels are a valuable tool in my technical analysis toolkit and provide a systematic way to identify potential trading opportunities.

USDJPY I Approaching weekly reversal pointWelcome back! Let me know your thoughts in the comments!
** USDJPY Analysis - Listen to video!
We recommend that you keep this pair on your watchlist and enter when the entry criteria of your strategy is met.
Please support this idea with a LIKE and COMMENT if you find it useful and Click "Follow" on our profile if you'd like these trade ideas delivered straight to your email in the future.
Thanks for your continued support!

Introducing the Dual Dynamic Fibonacci Retracement IndicatorHey there, Stock Justice here. Today, I walked you through using the Dual Dynamic Fibonacci Retracement Levels Indicator on TradingView. This powerful tool calculates pivot points and determines Fibonacci retracement levels based on your position in the market. I explored every input, from lookback periods to toggling extra levels, to shifting and extending lines. We also delved into the use of two sets of Fibonacci levels to identify areas of confluence for more robust trading decisions. With vivid colors marking each retracement level and the flexibility to modify the lookback period, this indicator is a game-changer for pinpointing support, resistance, potential reversals, and continuations. Remember, the magic is in the details. Happy trading!

Introducing the Trendicator (by Stock Justice)In this comprehensive tutorial, we dive deep into the world of the Trendicator, a powerful and innovative trading tool made by @StockJustice that enables traders to identify trends, spot reversals, detect bullish and bearish divergences, and perform multi-timeframe analysis. We delve into the inner workings of this never-before-seen indicator, demystifying its complex algorithms and showing you how to harness its full potential. From understanding the unique features of the Trendicator such as its compression stages, divergences, and MACD crossovers, to learning how to pair it with a Displaced Aggregated Moving Average (DACD) for enhanced precision, we cover it all in a fun and engaging manner.
The tutorial is not just about explaining the Trendicator's functionalities, but it also provides practical tips and strategies for using it in real-world trading scenarios. We discuss how the Trendicator can help traders spot the onset of a trend, gauge its strength, and pinpoint potential reversal points. Additionally, we explain how traders can utilize the bullish and bearish divergences identified by the Trendicator to anticipate market turns and make informed trading decisions.
Lastly, we emphasize the importance of multi-timeframe analysis in trading and demonstrate how the Trendicator can facilitate this process. By interpreting the Trendicator's signals across different timeframes, traders can gain a more comprehensive view of the market and make more accurate predictions. This tutorial is a must-watch for any trader aspiring to level up their technical analysis skills and trade more confidently and effectively. So, get ready to embark on an exciting journey of learning and discovery with the Trendicator!

Bearish divergence explained in NIFTY & BANK NIFTY.DIVERGENCE is when the price of a scrip is moving in opposite direction of an indicator, usually an oscillator. It acts as a warning that the price trend may be getting weaker. It does not necessarily mean that the trend will reverse. It could signal an exhaustion of the current trend, the beginning of a period of consolidation or a medium to long term reversal.
_________________________________________________________________________________
Divergences are classified according to their levels of strength. Type A divergences are the strongest, Type B divergences show lesser strength and Type C divergences are the weakest. Type A divergences usually present the best trading opportunities, whereas Type B and Type C mostly lead to choppy price movement or consolidation.
_________________________________________________________________________________
TYPE A: Type A bearish divergences occur when price rises to a new high but the oscillator is only able to rise to a high that is lower than the previous high of the oscillator. The divergences of this type often indicate a reversal towards a downtrend.
TYPE B: Type B bearish divergences are formed when the price makes two equal highs or a double top and the oscillator makes a lower second top.
TYPE C: Type C bearish divergences occur when price rises to a new high but the indicator stops at the same level it reached during the previous rally.
_________________________________________________________________________________
Divergences are important signals which can be used to book profits on existing positions or pulling up your trailing stop losses. NIFTY and BANK NIFTY both, are displaying bearish divergences on the daily timeframe.
Which type of bearish divergence do you see in NIFTY?
Comment below.

EURCHF - Wait For The Bulls!Hello TradingView Family / Fellow Traders. This is Richard, also known as theSignalyst.
As per my last analysis (attached on the chart), we were looking for sell setups as EURCHF has been sitting around the upper brown trendline.
Now EURCHF is approaching the lower bound trendline.
Moreover, the blue zone is a strong support.
🏹 So the highlighted purple circle is a strong area to look for buy setups as it is the intersection of the blue support and lower brown trendline. (acting as non-horizontal support)
As per my trading style:
As EURCHF is sitting around the lower the purple circle zone, I will be looking for bullish reversal setups (like a double bottom pattern, trendline break , and so on...)
📚 Always follow your trading plan regarding entry, risk management, and trade management.
Good luck!
All Strategies Are Good; If Managed Properly!
~Rich

🔥 LINK Bullish Channel ReversalLINK has been trading inside this bullish channel for nearly half a year now. The price has found support during last weeks' sell-off and seems to be reversing today.
Since there's still some uncertainty in the market whether we go up or down, I'll keep my targets close, see blue lines.

BTC - Short-Term Correction!Hello TradingView Family / Fellow Traders. This is Richard, also known as theSignalyst.
As per my last BTC analysis, I have mentioned that if we break below the green previous low, we will be expecting a movement till the 25,000 support.
🏹 Here is why the 25,000 zone marked by red circle is a strong support:
1- Round number => 25,000
2- Classic Resistance Zone Turned Support
3- Lower red trendline acting as a non-horizontal support
4- Lower orange trendline acting as a non-horizontal support
5- Demand zone
📈 BTC is now sitting around that green area and since the daily candle hasn't closed below it, the bulls can still kick in for a correction.
Yes, we will keep calling every bullish movement a correction as long as we are trading inside the falling orange channel.
For the bulls to take over medium-term again, we need a break above the upper orange channel.
For now, we are expecting a short=term bullish correction followed by another bearish impulse.
📚 Always follow your trading plan regarding entry, risk management, and trade management.
Good luck!
All Strategies Are Good; If Managed Properly!
~Rich

XAGUSD Spot Silver - Is it ready to reverse up?Spot Silver dropped this past week about 6.5 % from its high early in the week. On the
15-minute chart the drop occurred over three days. XAUUSD is now underneath the POC line
of the volume profile as well as the negative bands of the mean anchored VWAP. The Mass
Indicator and faster / slower MA ratio indicator are both near the zero line showing that
bearish momentum has subsided and a reversal may be underway. Overall, I expect a reversal
with XAGUSD seeking the mean. The first target is the POC line confluent with VWAP so
25.08 while the final target is 25.55 being the redline demarcating the top of the high volume
area. I expect this to be a 1-2 day trade with high potential reward especially if leveraged
on forex.

Introducing Dynamic Action Convergence Divergence (DACD)Hello, it's Stock Justice here! In our latest video, we explore the intricate workings of the Dynamic Action Convergence Divergence (DACD) - a tool that synergizes the robustness of the ADX and the DI lines to create a dynamic and responsive trading indicator.
We plunge into the depths of DACD, starting with the base components - the Average Directional Index (ADX) and the Directional Movement System (DI). We then demonstrate how these two indicators are harmoniously fused together to form a comprehensive tool capable of signaling market momentum and potential trend reversals.
We further elucidate how the DACD uses moving averages to mark potential bullish or bearish trends, and how divergence within the DACD can indicate trend continuations or reversals. The video also highlights the DACD's proficiency in multi-timeframe analysis, enabling traders to view market trends from a broader perspective.
Closing out, we underline the DACD's versatility as a powerful trading instrument, while emphasizing the need for using it in conjunction with proper risk management and a balanced blend of other technical analysis tools. This video is an essential watch for all traders seeking to enhance their trading arsenal and navigate the market more proficiently!

Introducing the Dynamic Fusion OscillatorHello, it's Stock Justice here! In our latest video, we delve into the world of the Dynamic Fusion Oscillator (DFO) - a tool that blends the power of the Relative Strength Index and the Stochastic Oscillator. I walk you through how it works, from understanding these two base components to how we fuse them to create a balanced and sensitive tool for identifying market trends and reversals.
We dive deep into how the DFO uses moving averages to signal potential bullish or bearish trends, and how divergence within the DFO can indicate trend reversals or continuations. I also touch on the DFO's capacity for multi-timeframe analysis, giving you the bigger picture of market trends.
Wrapping up, I remind you of the DFO's value as a versatile trading tool, but also emphasize the importance of using it alongside proper risk management and other technical analysis components. All in all, this video is a must-watch for traders aiming to enrich their toolkit and navigate the market more effectively!

CAD CPI could trigger next wave downThe previous CAD CPI data marked a significant turning point, with CAD having a 2 week hangover and the basket of major currencies getting a wild ride against the weakened CAD.
Could we see the opposite this time around? USD is seeing significant strength against the basket but is starting to look ripe for a pullback. If we see another strong day for USD on monday, pushing USDCAD into the cluster of pre vious activity between 1.36000 - 1.36500, we could be primed for a significant pullback in USD strength and the CAD CPI might just be the catalyst for a major leg down to back below 1.34500.
Of course, don't trade blindly, wait to see if the setup occurs, see the CPI numbers and how the market reacts. This is a very specific scenario, but if we are in that 1.36000 range when the numbers are released Tuesday, I'll be very quick to enter short if the market sees intraday downside momentum.

GBPUSD Plummets after 12month HighAfter briefly breaking the 12-month high from May 2022 of 1.26670 this week, a wave of selling came in amid a big news week.
The Bank of England (BoE) jacked up the UK Bank Rate to 4.5%, marking the 12th hike in a row. Despite two dissenting votes, the committee expects more tightening if price pressures persist. This could mean the rate peaking around 4.75% by the end of 2023.
BoE expects the UK's inflation to drop sharply from April, but that they are ‘continuing to address the risk of more persistent strength in domestic price and wage setting, as represented by the upward skew in the projected distribution for CPI inflation.’
Meanwhile, BoE's forecast for UK growth is cautiously upbeat, predicting flat growth in the first half of the year and a slight uptick after that.
Over in the States, the US Dollar gained strength headed into the weekend as investors look for safety amid uncertainty. This comes after a regional US bank, PacWest, reported a substantial 10% deposit drop and the Michigan Consumer Sentiment report came in weak.
From a technical perspective, tapping new highs briefly but failing to hold, leading to a sharp sell-off and retracing 2 weeks worth of gains in 2 days could signal a significant shift for the Cable ahead. We've seen a clean downside channel break, and - while a retracement seems likely after such volatile selling into the weekend - lower highs and lower lows could be the blueprint for the days and weeks ahead.

EURUSD - A review of this week's newsWe're beginning to see a Tale Of Two Economies emerge, as US data this week shows the path of disinflation continues, albeit slowly, giving investors hope that the Fed's interest rate increases are making an impact. Meanwhile across the pond, all quotes from the ECB are warning that the fight against inflation rages on and further rate hikes will be coming.
However, one major factor hanging over the Dollar is the news that there is "significant risk", according to the CBO, that the US won't be able to pay all of it's obligations as soon as the beginning of June, leading to the possibility of a default unless Congress votes to raise or suspend the Debt Ceiling.
From a technical perspective we see EURUSD failed a number of attempts to break through at the highs and has now begun to create lower highs and lows with it's violent moves down in recent days. Key trendlines and support levels have been broken and all signs point to the countertrend move having begun. While we appear overextended on lower timeframes, it may be prudent to wait patiently for a new lower high for a viable short entry.
It seems likely that we're witnessing a breakout to the upside on the DXY combined with profit taking and shift in sentiment for the Euro due to continued inflationary pressure in contrast to US inflation.
United States (US):
US CPI YoY 4.9% (Forecast 5%) : Consumer prices rose 4.9% on an annual basis, below forecast.
US Core PPI YoY Actual 3.2% (Forecast 3.3%, Previous 3.4%): The US core Producer Price Index (PPI) rose by 3.2% year-on-year, slightly below the forecasted 3.3%.
US PPI MoM Actual 0.2% (Forecast 0.3%, Previous -0.5%): The US Producer Price Index (PPI) increased by 0.2% on a monthly basis, slightly below the forecasted 0.3%.
US Initial Jobless Claims Actual 264k (Forecast 245k, Previous 242k): The number of Americans filing for initial unemployment benefits rose to 264,000, exceeding the forecasted 245,000. This increase suggests ongoing challenges in the US job market.
The “single biggest threat” to the economy now is the US hurtling towards a default on its obligations, said Karine Jean-Pierre, press secretary.
European Central Bank (ECB):
ECB: Consumers see 5% inflation over the next 12 months vs 4.6% in February : The European Central Bank (ECB) reports that consumers in the Eurozone expect inflation to reach 5% over the next 12 months. This represents an increase from the previous estimate of 4.6% in February, reflecting growing concerns about rising prices.
ECB's Nagel says the "latest interest rate hike won't be the last".
ECB's Lagarde spoke on Thursday, saying "the fight against inflation isn't over".

BTC - Critical Zone ❗️Hello TradingView Family / Fellow Traders. This is Richard, also known as theSignalyst.
As per my last analysis (attached on the chart), we have been waiting for the bulls to approach the green major low to look for buy setups.
BTC is now sitting around that green area and since the daily candle hasn't closed below it, we will be looking for buy setups.
🏹 For the bulls to take over, we need a break above the red channel and last minor high in gray.
📈 Meanwhile, until the bulls take over, the bears will remain in control, especially if we break below the green zone. Then a movement till the 25,000 support zone as mentioned on my last week's BTC analysis
Which scenario do you think is more likely to happen first? and why?
📚 Always follow your trading plan regarding entry, risk management, and trade management.
Good luck!
All Strategies Are Good; If Managed Properly!
~Rich

USDCAD - Bears Took Over, Now Wait For Bulls!Hello TradingView Family / Fellow Traders. This is Richard, also known as theSignalyst.
As per my last analysis (attached on the chart) USDCAD rejected our upper red trendline and supply, and traded lower.
Now USDCAD is approaching the lower bound of the symmetrical triangle again so we will be looking for buy setups on lower timeframes.
Moreover, the green zone is a strong support.
🏹 So the highlighted purple circle is a strong area to look for buy setups as it is the intersection of the green support and lower red trendline. (acting as non-horizontal support)
As per my trading style:
As USDCAD is sitting around the purple circle zone, I will be looking for bullish reversal setups (like a double bottom pattern, trendline break , and so on...)
📚 Always follow your trading plan regarding entry, risk management, and trade management.
Good luck!
All Strategies Are Good; If Managed Properly!
~Rich

BTC Update.This count is based on my assumptions so anything can happen not a trading or financial advice just for educational purposes only kindly do your own ta thanks trade with care good luck.

BTC - Key Rejection Zone!Hello TradingView Family / Fellow Traders. This is Richard, also known as theSignalyst.
BTC rejected the 30,000 resistance zone and now trading lower for a bearish correction.
If BTC breaks below 27,000 previous major low, we will expect a movement till 25,000 zone where we will be looking for long-term trend-following buy setups.
🏹 Here is why the 25,000 zone marked by red circle is a strong support:
1- Round number => 25,000
2- Classic Resistance Zone Turned Support
3- Lower red trendline acting as a non-horizontal support
4- Lower orange trendline acting as a non-horizontal support
5- Demand zone
📈 As per my trading style:
As BTC approaches the red circle zone, I will be looking for bullish reversal setups (like a double bottom pattern, trendline break , and so on...)
📚 Always follow your trading plan regarding entry, risk management, and trade management.
Good luck!
All Strategies Are Good; If Managed Properly!
~Rich

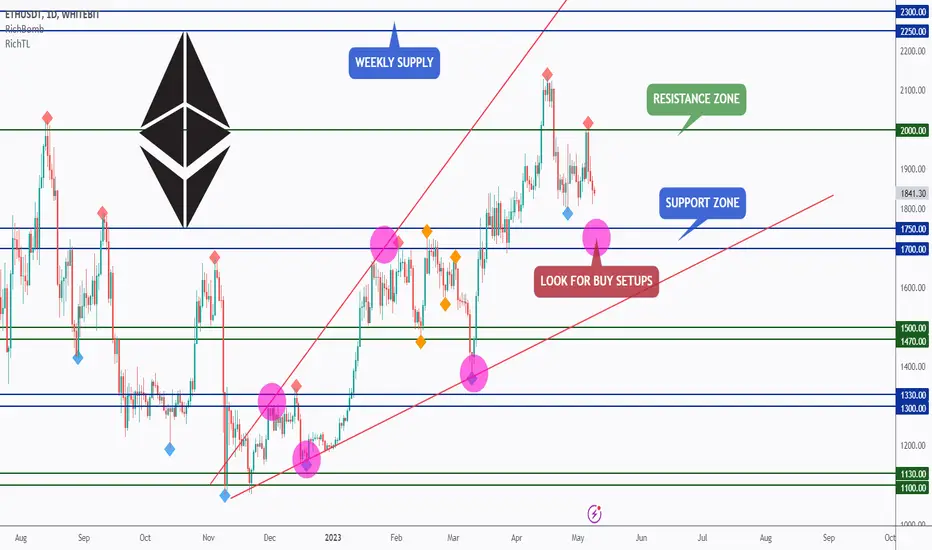
ETH - Long-Term Trend-Following Setup 🏹Hello TradingView Family / Fellow Traders. This is Richard, also known as theSignalyst.
After rejecting the 2000 resistance, ETH has been bearish short-term making lower lows and lower highs on H4.
🏹 Here is why the 1750 zone marked by purple circle is a strong support:
1- Round number => 1750
2- Classic Resistance Zone Turned Support
3- Lower red trendline acting as a non-horizontal support
4- Demand zone
📈 As per my trading style:
As ETH approaches the purple circle zone, I will be looking for bullish reversal setups (like a double bottom pattern, trendline break , and so on...)
📚 Always follow your trading plan regarding entry, risk management, and trade management.
Good luck!
All Strategies Are Good; If Managed Properly!
~Rich
LONDON: GBPUSD - REVERSAL SETUP - MOMENTUM ENTRYGU has met all requirements for a reversal setup after breaking downtrend line and failing to break new low. Lets see if we can generate at least 2R from this setup
