ASIA: USDJPY - REVERSAL/BREAKOUT - MOMENTUMUJ has come to a critical location and buyers seem to be stalling. Using our reversal setup will try to catch a potential fall
Reversal

BTC Deep Analysis: Next 4 stepsHello Traders!
Welcome back to another trade with analyst Aadil1000x.
This is a deep analysis of BTC. The previous analysis was an overview of Bitcoin.
According to this analysis, we will see a nice drop from here which will break the trendline. Later we will see some retracement and one more drop.
We will move step-wise.
Don't forget to hit the like button and follow to stay connected.

XRP - Long-Term View 🕝Hello TradingView Family / Fellow Traders. This is Richard, also known as theSignalyst.
As per my last analysis (attached on the chart) we were looking for medium-term buy setups as XRP was sitting around the 0.3 support zone.
The bulls already took over medium-term and now approaching the 0.6 resistance zone.
🏹 Long-Term: Left Chart
For the bulls to over from a long-term perspective, we need a weekly candle close above 0.6 which would be breaking both the last major high and upper brown trendline.
Meanwhile, 0.6 is acting as a resistance zone and the bears can take over for a bearish correction.
Which scenario do you think is more probable and why?
📚 Always follow your trading plan regarding entry, risk management, and trade management.
Good luck!
All Strategies Are Good; If Managed Properly!
~Rich

BCH LONGBCH is looking great on 3, 4 Charts, as we are in the golden zone when it comes to a reversal/upward price action. Class A Bullish Divergence on MACD with positive momentum building. Short Term targets are reflected on chart.
Yeeeeee

SOLUSDT Next 4 stepsHello Traders!
Welcome back to another trade with analyst Aadil1000x.
Sol is ready for a breakout and after a breakout, we will see a minor retracement and then we will see a pump. We will see a pump because market is aiming to test the broken trendline.
After testing the Broken trendline we will see a nice drop.
Don't forget to hit the like button and follow to stay connected.

ETH: Next Five stepsHello Traders!
Welcome back to another trade with analyst Aadil1000x.
This is the analysis of ETHusdt and it is ready for a major trend break. At the first break, i am expecting some reversal pattern and at the third step, we will see a test of the trendline and some more drops.
The 4th wave can take ETH below 1700 and this dip will be a good time for buyers to catch the bullish wave as after this wave we are going to see strong bullish run.
Each and every wave is tradeable.
Don't forget to hit the like button and follow to stay connected.

APT Bullish MoveHello Traders!
Welcome back to another trade with analyst Aadil1000x.
Today we are going to APT from this zone as a reversal move is expected and it will be strongly bullish.
APT Buy Now @ 10.865
Target 1, 11.298(+4%)
Final Target 11.675(+7.5%)
Stoploss 10.535(-2.9%)
Don't forget to hit the like button and follow to stay connected.

XAUUSD : Gold demand zone long tradeOANDA:XAUUSD
Hi trader's , Gold as per our last analysis went down and hit all target's
Now Gold consolidating and making a potiential reversal pattern
'W' pattern is bullish reversal pattern , as after double bottom , buyer's can push market in upward direction
Once 20 and 50 ema resistance area clear , gold can move upto 1973 mark minimum
❤️Please, support my work with follow ,share and like, thank you!❤️

📉Bearish Reversal Patterns & Showcase📉What are Reversal Patterns?
In trading, candlestick patterns are used to analyze the behavior of the market and identify potential opportunities to enter or exit a trade. Reversal patterns and continuation patterns are two types of candlestick patterns that traders look for.
Reversal patterns are characterized by a change in the direction of the trend. These patterns indicate that the market is likely to reverse its direction and move in the opposite direction. In contrast, continuation patterns signal that the trend is likely to continue in the same direction after a temporary pause or consolidation.
Reversal patterns usually take longer to form than continuation patterns because it's easier for the market to continue moving in the same direction than to change course. For example, if sellers are pushing the market lower, it takes more effort for buyers to turn the market around and initiate an uptrend.
A reversal pattern may occur after a period of strong selling or buying pressure, as traders become exhausted or the market reaches a key support or resistance level. Once this happens, traders who missed the initial move may see an opportunity to enter a new trade in the opposite direction of the previous trend.
However, for a reversal pattern to be considered valid, there must have been a previous trend in place. A sideways market cannot be classified as a reversal because it doesn't reflect a change in trend direction. Traders typically look for confirmation of a reversal pattern, such as a breakout from a trendline or a significant price movement in the opposite direction of the previous trend.
👤 @AlgoBuddy
📅 Daily Ideas about market update, psychology & indicators
❤️ If you appreciate our work, please like, comment and follow ❤️

BTC.D - Altcoin Season Getting Closer ❗️Hello TradingView Family / Fellow Traders. This is Richard, also known as theSignalyst.
📌 BTC.D has been stuck inside a weekly range for for almost two years.
After rejecting the lower bound of the range, BTC.D has been overall bullish trading inside the rising broadening wedge pattern in green.
📉 However, BTC.D is currently approaching the upper bound of the range, and upper green trendline acting as a non-horizontal resistance.
That's why we are speculating Altcoins to gain strength after a couple of days / weeks.
For now, as long as BTC.D is trading higher , BTC would be dominant and outperforming almost all altcoins.
What do you think? Will BTC.D reject the red resistance or break it upward? and why?
📚 Always follow your trading plan regarding entry, risk management, and trade management.
Good luck!
All Strategies Are Good; If Managed Properly!
~Rich

BTC's Wave 1,2,3 CompleteHello Traders!
Welcome back to another trade with analyst Aadil1000x.
I posted the analysis of BTC with the set of 6 waves. 3 waves worked as expected and 4th will also work as expected but the position is a little different.
It is forming a reversal pattern below the reaction zone and this wave has a clear aim and it is aiming to touch the red line which is above 27.7K. Look for a pattern below the reaction zone and go for the buy.
Don't forget to hit the like button and follow to stay connected.

A Forced Push: Next move still bearishHello Traders!
Welcome back to another trade with analyst Aadil1000x.
Previously I was expecting an instant drop but it was invalidated immediately after a forced push. These type of moves occurs when the market wants to change its structure.
The Next move is still bearish as it is going to break the trendline which is at the bottom but later we will see a bullish move. The market is not going anywhere it will remain in the range.
Don't forget to hit the like button and follow to stay connected.

EURAUD Trend reversal - Double Top - DIvergence-EUR vs AUD
-Double-top formation
-Significant Divergence
-Short Position

NZDUSD - Wait For The Trigger, AGAIN!Hello TradingView Family / Fellow Traders. This is Richard, also known as theSignalyst.
NZDUSD is overall bullish trading inside the flat wedge pattern in red. So we have been trading the range.
Now since NZDUSD is sitting around the lower red trendline we will be looking for buy setups on lower timeframes.
🏹 For the bulls to take over , we need a momentum candle close above the last major high in gray.
We are following a basic price action approach just like the previous examples.
Meanwhile, until the buy is activated, NZDUSD can still trade lower and even break the entire structure.
📚 Always follow your trading plan regarding entry, risk management, and trade management.
Good luck!
All Strategies Are Good; If Managed Properly!
~Rich

#PKFUSDTYou should enter trading when the price cross above the 20-day moving average.. Don't trade against the market.

BTCUSDT: Next 6 stepsHello Traders!
Welcome back to another trade with analyst Aadil1000x.
BTC is trading in a range and it is ready to break this range soon. We can see there is a symmetrical triangle pattern at the end of this range and it will force the price to move towards the close breakout of the range and the closet breakout is towards the downside.
The whole chart is analyzed deeply and each and every wave is tradeable.
If there is a change in structure then i will post the new update.
Don't forget to hit the like button and follow to stay connected.

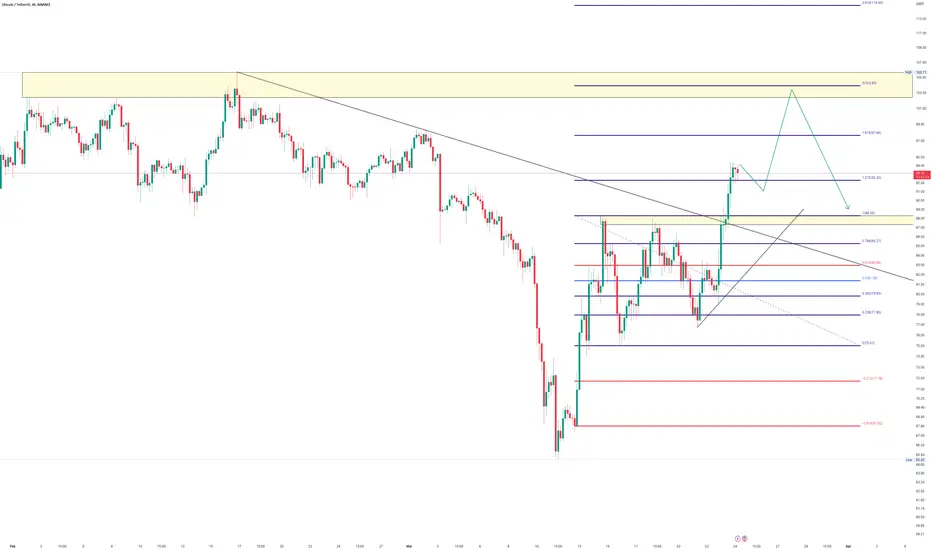
Target around 105 before dropBINANCE:LTCUSDT is going up to 105
Good point to join around 88
Wait and see
TSLA close analysis, 3/23/2023 -- Will it be an island?!I've been tracking a TSLA long term short from a prior idea and was greedy expecting price to trace back to 150 levels. With the bearish nature of the past couple day's moves, a gap down creating an island is just what the doctor ordered for TSLA to continue its downward path.
TLDR Open gap down I’m super bearish. Continue to range in this 190+ zone I will continue to hedge long.

Btcusd : Bitcoin sharp price actionBINANCE:BTCUSDT
Hi trader's , Bitcoin after yesterday fed news of interest rate
Price went down with immense pressure and hit 50 ema of 4hr
50 ema support's the buyer's and price went up sharply again
price trading around daily resistance , if candle of daily closes below 28350 than u can see a downtrend for next few day's
vice versa if candle closes above than u can see upward movement to 30k mark , where major resistance can push market down again
❤️ Please, support my work with follow ,share and like, thank you! ❤️

ASIA: GBPCAD - BOBBI/REVERSAL - MOMENTUMBreak out break back in with momentum shift. Failure to make new high and broken trend line. Lets see if it plays out

GBPCAD - Video Top-Down Analysis!Hello TradingView Family / Fellow Traders. This is Richard, also known as theSignalyst.
Here is a detailed update top-down analysis for GBPCAD .
Which scenario do you think is more likely to happen? and Why?
Always follow your trading plan regarding entry, risk management, and trade management.
Good Luck!.
All Strategies Are Good; If Managed Properly!
~Rich

buy thangamayl @ 1040.10 currently trading around good demand levels can add more till 1020-1000 Target 1095/1145/1180/1220

NY: USDCHF - REVERSAL - DEPLETIONAll criteria for our playbook reversal setup met and entry using depletion of buyers
