GBPUSD | Perspective for the new week | Follow-upAmidst a backdrop of economic uncertainty, the US Dollar has managed to hold its ground, gaining modest strength against various currencies. This resilience comes on the back of a surprising surge in the US economy, defying recession fears that have loomed since 2022. Data reveals a robust 4.9% growth rate in the third quarter, marking the fastest pace in nearly two years. Despite this positive momentum, the market remains on edge, balancing optimism from strong economic data against concerns of higher rates and a more restrictive Federal Reserve.
Meanwhile, the GBPUSD pair has maintained a steady position above the $1.2100 mark throughout October. Despite attempts to capitalize on this demand zone, the Pound struggles in the face of hawkish Fed expectations, which bolster the USD and limit upward movements. The anticipated Bank of England decision to maintain interest rates at 5.25% on November 2 adds another layer of complexity, potentially hindering bullish bets around the British Pound and capping the GBPUSD pair.
GBPUSD Technical Analysis:
Will the pound find solid support at the $1.20500 zone, or are we heading towards a potential breakdown and a possible sell-off? The stakes are high, and we're on the edge of our seats!
The spotlight is on high-impact economic events from both the US dockets for clues. Brace yourselves as the anticipation and the actual events may trigger sharp price movements that could present incredible trading opportunities.
In this video, we've analyzed the Daily and 4-hour timeframes, exploring bullish and bearish sentiments to uncover the most promising trades for the week ahead. We've delved into key levels, trendlines, and support/resistance points, unveiling essential insights into the current market structure.
Keep a close eye on that demand zone at $1.20500. It's a decisive moment where both sellers and buyers are vying for control, and how the market reacts here will set the course for GBPUSD in the upcoming days.
Stay connected and join the conversation in the comment section to stay updated on the latest developments. Thank you for tuning in, and get ready for more enlightening insights into GBPUSD in our upcoming content. Buckle up for a thrilling journey ahead! Happy trading!
Disclaimer:
Trading on margin in the foreign exchange market (including commodities, CFDs, stocks, etc.) carries a high level of risk and may not be suitable for all investors. The content of this speculation (including all data) is provided by me for educational and informational purposes only to assist in making independent investment decisions. All information presented here is for reference purposes only, and I do not accept any responsibility for its accuracy.
It is important that you carefully consider your investment experience, financial situation, investment objectives, and risk tolerance level, and seek advice from an independent financial advisor to assess the suitability of your situation before making any investment.
I do not guarantee the accuracy of the information provided and shall not be held liable for any loss or damage that may arise directly or indirectly from the content or the receipt of any instructions or notifications related to it.
Please note that past performance is not necessarily indicative of future results
Reversalpattern

GBPUSD | Perspective for the new week | Follow-upDespite a setback in UK Retail Sales last Friday, where September's retailers' receipts fell by -0.9% against the expected -0.1%, the Pound Sterling is finding its footing amidst a weakening US Dollar (USD). As it finds demand around the $1.21000 area; the GBPUSD pair is capitalizing on the current market conditions, aiming to secure gains in the face of global uncertainties.
Looking ahead, market enthusiasts are eyeing Tuesday's UK Labor and Purchasing Manager Index (PMI) figures. Forecasts suggest a decline of 198K job additions in August, a slight improvement from July's -207K. Additionally, there is optimism for an uptick in the UK preliminary PMI, with the PMI Composite expected to print at 48.8, compared to the previous 48.5.
Federal Reserve (Fed) Chairman Jerome Powell's recent comments regarding significant tightening in financial conditions, particularly with higher bond yields, might influence policy decisions, potentially weakening the US Dollar. However, it's essential to acknowledge the ongoing Israel-Hamas conflict, which could prompt investors to seek refuge in safe-haven assets, possibly bolstering the USD against its counterparts.
As we step into the new week, we approach the market with flexibility, keeping our strategies adaptable to changing scenarios.
GBPUSD Technical Analysis:
Will the pound find solid support at the $1.2000/$1.18000 zone, or are we heading towards a potential breakdown and a possible sell-off? The stakes are high, and we're on the edge of our seats!
The spotlight is on high-impact economic events from both the US dockets for clues. Brace yourselves as the anticipation and the actual events may trigger sharp price movements that could present incredible trading opportunities.
In this video, we've analyzed the Daily and 4-hour timeframes, exploring bullish and bearish sentiments to uncover the most promising trades for the week ahead. We've delved into key levels, trendlines, and support/resistance points, unveiling essential insights into the current market structure.
Keep a close eye on that critical confluence at $1.21800. It's a decisive moment where both sellers and buyers are vying for control, and how the market reacts here will set the course for GBPUSD in the upcoming days.
Stay connected and join the conversation in the comment section to stay updated on the latest developments. Thank you for tuning in, and get ready for more enlightening insights into GBPUSD in our upcoming content. Buckle up for a thrilling journey ahead! Happy trading!
Disclaimer:
Trading on margin in the foreign exchange market (including commodities, CFDs, stocks, etc.) carries a high level of risk and may not be suitable for all investors. The content of this speculation (including all data) is provided by me for educational and informational purposes only to assist in making independent investment decisions. All information presented here is for reference purposes only, and I do not accept any responsibility for its accuracy.
It is important that you carefully consider your investment experience, financial situation, investment objectives, and risk tolerance level, and seek advice from an independent financial advisor to assess the suitability of your situation before making any investment.
I do not guarantee the accuracy of the information provided and shall not be held liable for any loss or damage that may arise directly or indirectly from the content or the receipt of any instructions or notifications related to it.
Please note that past performance is not necessarily indicative of future results

BTC Falling to new LOWWeekly, Daily, 4 Hourly
TDI indicator made 2 dow break down, ready to fall.
Entry trigger: Waiting 4h price dow break down, and on the pull back up, enter short.
Note: Dow break means structural break.

NQ Power Range Report with FIB Ext - 10/24/2023 SessionCME_MINI:NQZ2023
- PR High: 14752.00
- PR Low: 14737.00
- NZ Spread: 33.5
Key Economic Event
09:45 – S&P Global Services PMI
Maintaining long-term inventory above 14600
Evening Stats (As of 12:25 AM)
- Weekend Gap: +0.21% (filled)
- Session Gap 8/2: -0.33% (open > 15807)
- Session Gap 7/20: -0.11% (open > 15939)
- Session Open ATR: 254.80
- Volume: 26K
- Open Int: 260K
- Trend Grade: Neutral
- From ATH: -11.9% (Rounded)
Key Levels (Rounded - Think of these as ranges)
- Long: 15247
- Mid: 14675
- Short: 14103
Keep in mind this is not speculation or a prediction. Only a report of the Power Range with Fib extensions for target hunting. Do your DD! You determine your risk tolerance. You are fully capable of making your own decisions.

UNIONBANK for a REVERSALAfter being in a downtrend for so long UnionBank looking good to give a reversal from there as the volumes are increasing as well. If price starts making higher highs and higher lows structure, we can watch it

Reversal Pattern, the Falling Wedge for potential longDaily Chart
Aptos has bounced back from the lower line acts a support in Falling Wedge
It's trading at 5.71x now
To complete this pattern, it needs to breakout and close above 6.15 before.
Wait for next move

Falling Wedge | Wait a BreakoutDaily Chart
Aptos has bounced back from the lower line acts a support in Falling Wedge
It's trading at 5.71x now
To complete this pattern, it needs to breakout and close above 6.15 before.
Wait for next move

US Oil SPOT | Perspective for the new week | Follow-upThe week concluded with crude prices surging by a staggering 7%, leaving investors on edge as the Middle East crisis intensified. Israel's announcement of a ground assault on Gaza propelled the region into a new phase of heightened tensions, further fueling market uncertainty. As we look ahead to the coming week, two pivotal factors will shape the direction of oil markets. Firstly, the extent to which the conflict in the Middle East escalates and its potential impact on oil supplies in the world's leading oil-producing region. Secondly, all eyes will be on the eagerly awaited weekly update on US crude stockpiles, set to be released on Wednesday.
Notably, last week witnessed a significant surge in crude stocks, with exports experiencing a sharp decline of nearly 2 million barrels, bringing the daily average to 3.067 million barrels compared to the previous week's 4.956 million barrels. These developments set the stage for a captivating week ahead, filled with anticipation and potential market shifts. Let's explore what lies in store for us in the upcoming week.
US Oil Technical Analysis:
In this video, we delve deep into the 4-hour timeframe, dissecting key supply and demand zones to uncover invaluable insights into the potential trajectory of price action for USOILSPOT in the week ahead.
Join us as we delve into a comprehensive technical analysis of the US oil market, exploring trends, key levels, and chart patterns that hold the key to unlocking profitable opportunities. Don't miss out on this golden opportunity to elevate your understanding of the future path of USOILSPOT. Stay ahead of the curve and gain a distinct competitive edge by immersing yourself in this price-action-based technical analysis.
Disclaimer Notice:
Please be aware that margin trading in the foreign exchange market, including commodity trading, CFDs, stocks, and other instruments, carries a high level of risk and may not be suitable for all investors. The content of this speculative material, including all data, is provided by me for educational purposes only and to assist in making independent investment decisions. All information presented here is for reference purposes only, and I do not assume any responsibility for its accuracy.
It is important that you carefully evaluate your investment experience, financial situation, investment objectives, and risk tolerance level. Before making any investment, it is advisable to consult with your independent financial advisor to assess the suitability of your circumstances.
Please note that I cannot guarantee the accuracy of the information provided, and I am not liable for any loss or damage that may directly or indirectly result from the content or the receipt of any instructions or notifications associated with it.
Remember that past performance is not necessarily indicative of future results. Keep this in mind while considering any investment opportunities.

XAUUSD | GOLDSPOT | New perspective | follow-up detailsGold prices showcased an impressive rally, primarily propelled by mounting geopolitical tensions in the Middle East and the optimism surrounding the Federal Reserve's (Fed) decision to refrain from further interest rate hikes this year. The precious metal exhibited remarkable resilience, bouncing back swiftly from a knee-jerk reaction triggered by the United States Consumer Price Index (CPI) report for September, which revealed higher-than-expected headline inflation, exerting bearish pressure initially on Thursday.
However, gold quickly regained its footing as traders placed their bets on an unchanged interest rate decision by the Fed in its upcoming November monetary policy meeting. This confidence was further bolstered by the CPI's core inflation reading, which softened in line with market expectations.
Adding to the positive sentiment, Philadelphia Fed President Patrick Harker offered a neutral perspective, stating that concerns about persistent inflation were notably absent in recent data. This assurance reinforced the belief that the central bank would maintain the current interest rates, providing a supportive backdrop for gold prices.
XAUUSD Technical Analysis:
In this video, we dissected the XAUUSD chart from a technical standpoint, analyzed the key levels, analyzed historical price moves, market behaviors, and buyer-seller dynamics, and uncovered potential trading opportunities.
The range between the $1,900 and $1,930 zones will remain our center stage for this week. Its historical significance makes it a crucial point. If the bullishullish momentum is sustained then the $1,900 and resistance of the descending channel will serve as platform for new highs. However, if price breakdown/retest the $1,900 we could witness a renewed selling pressure.
Stay tuned for more thrilling updates on the Gold market! Hit the like button if you found this analysis helpful, and don't forget to subscribe for more insightful content! 📺🔔💼
Disclaimer Notice:
Please be aware that margin trading in the foreign exchange market, including commodity trading, CFDs, stocks, and other instruments, carries a high level of risk and may not be suitable for all investors. The content of this speculative material, including all data, is provided by me for educational purposes only and to assist in making independent investment decisions. All information presented here is for reference purposes only, and I do not assume any responsibility for its accuracy.
It is important that you carefully evaluate your investment experience, financial situation, investment objectives, and risk tolerance level. Before making any investment, it is advisable to consult with your independent financial advisor to assess the suitability of your circumstances.
Please note that I cannot guarantee the accuracy of the information provided, and I am not liable for any loss or damage that may directly or indirectly result from the content or the receipt of any instructions or notifications associated with it.
Remember that past performance is not necessarily indicative of future results. Keep this in mind while considering any investment opportunities.

CADJPY_28.09.2023_Potential to develop triangle & double topCADJPY analysis:
1. Time frame daily & weekly, currently price in a strong resistance area, but the upward movement in prices is starting to slow down.
2. Time frame daily, price has the potential to develop double top pattern which is a reversal pattern.
3. Time frame H-4, price has the potential to develop rising wedge pattern.
Double top & rising wedge patterns have potential to form in a strong resistance area, so we can make this momentum to find a good position to have a selling position.
Notes:
- This is a personal analysis, please adjust it to the existing conditions.
- This is not a buy/sell recommendation. This is just my personal analysis.
- Please analyze again, because you are responsible for your decision. Your losses are your responsibility, your profits are yours.
- Still in the learning process, let's learn together :)
Thank You

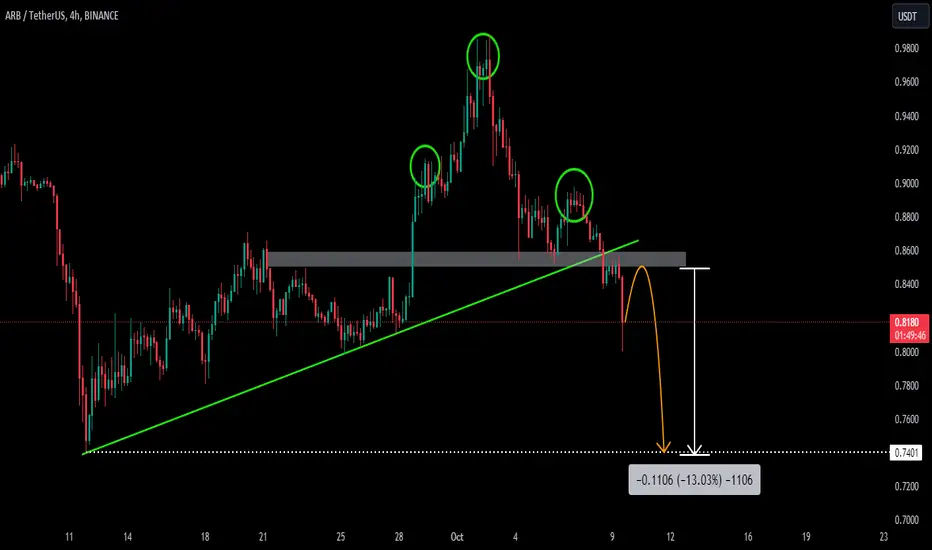
ARBUSDTARBUSDT is trading in bullish parallel channel, and created Head and Shoulder pattern at strong resistance area. And a massive sell rally break the neckline of HnS pattern. any successful retest of broken level will be nice option to sell.
if the sell pressure continues, the next target could be the back to lows at 0.7400 region.
GBPUSD | Perspective for the new week | Follow-upAccording to recent data from the UK's National Statistics, the second-quarter Gross Domestic Product (GDP) registered a 0.2% QoQ growth, aligning with the initial estimate and continuing the trend from the previous reading. Dive deep into the market dynamics as late-week price action propelled Cable back to the opening levels of the previous week, hovering around $1.22600.
Intriguingly, the GBP's recent sell-off appears oversold, hinting at potential corrections. With a potentially bullish close for the week, the market is showing signs of strengthening correction risks, possibly extending gains to 1.2350 in the short term. Yet, the GBPUSD pair faces challenges amidst the dominant US Dollar.
GBPUSD Technical Analysis:
Will the pound find solid support at the $1.21100 zone, or are we heading towards a potential breakdown and a possible sell-off? The stakes are high, and we're on the edge of our seats!
The spotlight is on high-impact economic events from both the US dockets for clues. Brace yourselves as the anticipation and the actual events may trigger sharp price movements that could present incredible trading opportunities.
In this video, we've analyzed the Daily and 4-hour timeframes, exploring bullish and bearish sentiments to uncover the most promising trades for the week ahead. We've delved into key levels, trendlines, and support/resistance points, unveiling essential insights into the current market structure.
Keep a close eye on that critical confluence at $1.22600. It's a decisive moment where both sellers and buyers are vying for control, and how the market reacts here will set the course for GBPUSD in the upcoming days.
Stay connected and join the conversation in the comment section to stay updated on the latest developments. Thank you for tuning in, and get ready for more enlightening insights into GBPUSD in our upcoming content. Buckle up for a thrilling journey ahead! Happy trading!
Disclaimer:
Trading on margin in the foreign exchange market (including commodities, CFDs, stocks, etc.) carries a high level of risk and may not be suitable for all investors. The content of this speculation (including all data) is provided by me for educational and informational purposes only to assist in making independent investment decisions. All information presented here is for reference purposes only, and I do not accept any responsibility for its accuracy.
It is important that you carefully consider your investment experience, financial situation, investment objectives, and risk tolerance level, and seek advice from an independent financial advisor to assess the suitability of your situation before making any investment.
I do not guarantee the accuracy of the information provided and shall not be held liable for any loss or damage that may arise directly or indirectly from the content or the receipt of any instructions or notifications related to it.
Please note that past performance is not necessarily indicative of future results

Island reversal pattern forming for Home Depot?Island reversal pattern forming for Home Depot NYSE:HD ?
Started in Feb 22 almost a year ago after earnings report.
If it completes, exceeding 339, then it will be a bullish reversal and 400-420 will be in play. So for next earnings it's possible that price will gap higher. Still watching though.
This is not advice. Do your own research and trade your own plan!!

E9 ERASER PATTERN
Naming this the E9 Eraser Pattern as it literally erases traders out the game...
Impulse leg creates a peak with liquidity pool above the peak, this area (usually the wick area) is eaten into signalling to go short, as price moves in that direction price is sharply reversed after an internal structure break, trapping said short traders. As price breaks/pushes out of the prior Initial high, triggering buy stops / stop losses, once again we can expect price to sharply reverse.
Ideally we will see an OVERWATCH candle signal print, signalling potential reversal pattern in play.

Reversal Pattern | Long BiasDaily Chart
I figured out Inverse Head Shoulders that's reversal pattern with neckline is broken and below price now.
OP is trading at 1.36x and I expect OP will go up to 1.63 and higher after completed reversal pattern
Wait for next move

Compressing for massive moveFX:EURCHF has resistance around 0.96 and support by lower descending trend line
Besides, I figured out the reversal pattern Inverse Head Shoulders
FX:EURCHF needs to close above the neckline to confirm for this reversal pattern
Wait for next move

Bullish comback | Long BiasChart 4H TF
HBAR is trading at 0.0505
I found out Inverse Head Shoulders and it's reversing to resistance around 0.052
Wait for a breakout to confirm for this reversal pattern

JCHAC - Best trade set up plan 1. Market Trend - Bullish
2. Stock Trend - Reversal
3. Reversal Pattern - Falling Wedge
4. Potential - 1:10+ RR
Two Price entries are available from current levels to the pull back levels, both can be a good buy levels as per chart.

CVS showing bullish reversal signalCVS Health Corporation consistently going up with convergence on rsi scale and with good volumes .
the price can break 1st resistance after a small drop and can reach 0.6 fib levels where a sell must be initiated

XAUUSD | GOLDSPOT | New perspective | follow-up detailsIn the world of precious metals, gold is facing a delicate balancing act. Recent economic data from the United States has added a layer of complexity to the gold market. The ISM Manufacturing PMI for August surprised many by exceeding expectations, while the U.S. jobless rate edged up to 3.8% while the NFP data slightly surpassed predictions.
Wage growth, though still expanding, has slowed its pace. These mixed signals in the U.S. job market have cast uncertainty over the upcoming Federal Reserve interest-rate decision, scheduled for September 20th. Fed Chair Jerome Powell's remarks at the Jackson Hole Symposium emphasized that policy decisions would hinge on incoming data, especially considering the evolving relationship between inflation and employment.
In this landscape of economic flux, gold finds itself at a critical juncture, hovering just above the pivotal $1,900 threshold. Investors are eagerly awaiting clearer signals, and the precious metal's next move remains uncertain.
XAUUSD Technical Analysis:
In this video, we delve into XAUUSD from a price action-based technical analysis standpoint. By analyzing historical price moves, market behaviors, and buyer-seller dynamics, we extract insightful cues.
The $1,950 zone will take center stage. Its historical significance makes it a crucial point. If the bullish momentum is sustained then the breakout of both the descending trendline and the $1,950 level could incite a strong uptrend continuation. However, if selling pressure persists below the $1,950 then some short-term selling opportunities could take center stage to trigger a USD-favored sell-off.
Stay tuned for more thrilling updates on the Gold market! Remember, trading involves risks, and I always recommend exercising caution and seeking advice from financial professionals. Hit the like button if you found this analysis helpful, and don't forget to subscribe for more insightful content! 📺🔔💼
Disclaimer Notice:
Please be aware that margin trading in the foreign exchange market, including commodity trading, CFDs, stocks, and other instruments, carries a high level of risk and may not be suitable for all investors. The content of this speculative material, including all data, is provided by me for educational purposes only and to assist in making independent investment decisions. All information presented here is for reference purposes only, and I do not assume any responsibility for its accuracy.
It is important that you carefully evaluate your investment experience, financial situation, investment objectives, and risk tolerance level. Before making any investment, it is advisable to consult with your independent financial advisor to assess the suitability of your circumstances.
Please note that I cannot guarantee the accuracy of the information provided, and I am not liable for any loss or damage that may directly or indirectly result from the content or the receipt of any instructions or notifications associated with it.
Remember that past performance is not necessarily indicative of future results. Keep this in mind while considering any investment opportunities.

WIPRO: PICK OF THE YEARWipro Looks Great with Technical Analysis!
There are a lot of hidden reasons for selecting Wipro as the Pick of the Year.
Let me show you:
First, Wipro and Nifty Ratio Chart
This is a hidden Information, and see how chart is taking support
Secondly, Wipro and NiftyIT Ratio Chart
Again a hidden information and See how Wipro is taking support in this also
Both of Above information suggesting a good support after a long time in Wipro
And this support can give you the best investment price.
Third, watch how Wipro is taking support on Monthly chart
It was a resistance trendline where Wipro gave a breakout few years back and now it is retesting those levels, and is consolidating. This can be a good Demand Zone and we can expect a price reversal
Also, if you notice the previous Wipro High, It is giving Wipro a Horizontal Support.
And the best part is, the level is 0.618 Fibonacci Zone, that too in a Monthly Chart.
Fourth, Fundamentals are still great with Profits increasing every year.
FIIs and DIIs have increased there stakes in the company last quarter, so this information can be a highlight for us to invest in WIPRO.
With all these analysis, I think Wipro can be a very good reversal stock for next few months, and we can see a good up move in Wipro.
This all reasons make me pick WIPRO as the PICK OF THE YEAR.
What do you think about this idea?

Confirmation & Time to enter for reversal! (Update to last post)Time Frame:
- 4HR analysis
- 15min Confirmation for Entry
As mentioned in my previous post titled “Clear Head and Shoulders Long or Short term play”, we were waiting for an entry signal into our H&S trade. This signal could come in many ways but in my strategy, once a larger time frame (2Hr-1day) supply zone is hit, I then turn to the lower time frame and wait for a bearish signal (typically a CHoCH (major or minor)) and thereafter identify the LTF supply zone that caused that CHoCH. Reaching that supply zone is our signal to enter and we therefore have a tight and calculated stop loss with a stronger R:R.
We have now broken previous structure and are considered in a LTF downtrend (with a lower high and lower low) and can begin our descent toward breaking through the H&S neckline and the important trend line that is holding us up.
My trade plan is as follows:
Stop Loss – Above LTF Supply zone (higher R:R), Above right shoulder/previous higher high (lower R:R)
Take Profit 1 – Neckline of H&S = 8.32 R:R
Take Profit 2 – Trendline bounce/break = 12.5 R:R (or 6.6 with higher stop loss)

Head Shoulders has done | DowntrendChart 1H TF
SUI has done Head Shoulders Pattern.
It's trading at 5243 and down lower
SUI has the support around 48xx
Wait for next move
