ZIGA SET Island ReversalI bought 4.9 with SL tp at previous top.
An island reversal is a price pattern on bar charts or candlestick charts that, on a daily chart, features a grouping of days separated on either side by gaps in the price action. This price pattern suggests that prices may reverse whatever trend they are currently exhibiting, whether from upward to downward or from downward to upward.
Reversalpattern

GBP / USD 1.35754 - 0.07 % SHORT IDEA * PRICE ACTION & STRUCTUREHELLO EVERYONE
HOPE EVERYONE IS DOING GOOD HAVING A GOOD ONE, HERE'S A LOOK AT POSSIBLE SCENARIOS THAT COULD PLAY OUT IN THE COMING WEEK ON THE POUND / DOLLAR PAIR.
* The PAIR is currently trading in an descending channel but seems the channel now consolidating in a ascending channel within this structure.
- Short term the pair has currently entered an up trend as WE broke above on the 4h chart.
- There is a supply zone that the pair is currently testing as we see the formation of a double top in this area.
- Looking for SHORT entries on the pair this week should all the rules of the formation be met.
lets see how it goes
IF THIS IDEA ASSISTS IN ANY OR IF YOU LIKE THIS ONE
SMASH THAT LIKE BUTTON & LEAVE A COMMENT.
ALWAYS APPRECIATED
____________________________________________________________________________________________________________________
* Kindly follow your entry rules on entries & stops. |* Some of The idea's may be predictive yet are not financial advice or signals. | *Trading plans can change at anytime reactive to the market. | * Many stars must align with the plan before executing the trade, kindly follow your rules & RISK MANAGEMENT.
_____________________________________________________________________________________________________________________
| * ENTRY & SL -KINDLY FOLLOW YOUR RULES | * RISK-MANAGEMENT | *PERIOD - SWING TRADE


USOIL 78.87 +0.03% SHORT IDEA * REVERSAL & PRICE ACTIONHELLO EVERYONE
HOPE EVERYONE IS DOING GOOD HAVING A GOOD ONE, HERE'S A LOOK AT POSSIBLE SCENARIOS THAT COULD PLAY OUT IN THE COMING WEEK ON THE USOIL ENERGY.
* The ENERGY is currently trading in an ascending channel but seems the channel now consolidating in a BEAR FLAG just above of structure.
- Short term the pair has currently entered a consolidation as WE break below on the 4h chart this set up comes into play.
- There is a demand zone to look out for on the ENERGY before we continue with the bears, BREAK BELOW will trigger the set up.
- Looking for SHORT entries on the pair this week should all the rules of the formation be met.
lets see how it goes
IF THIS IDEA ASSISTS IN ANY OR IF YOU LIKE THIS ONE
SMASH THAT LIKE BUTTON & LEAVE A COMMENT.
ALWAYS APPRECIATED
____________________________________________________________________________________________________________________
* Kindly follow your entry rules on entries & stops. |* Some of The idea's may be predictive yet are not financial advice or signals. | *Trading plans can change at anytime reactive to the market. | * Many stars must align with the plan before executing the trade, kindly follow your rules & RISK MANAGEMENT.
_____________________________________________________________________________________________________________________
| * ENTRY & SL -KINDLY FOLLOW YOUR RULES | * RISK-MANAGEMENT | *PERIOD - SWING TRADE

xauusdlong legged doji candlestick it shows indecision of buyers and sellers, it is a bearish reversal pattern in this market is in a bullish mood

EUR/USD Price Still In ConsolidationPrice is still ranging pretty strong. It bounced with some force back up from a micro level. Can price breakout of consolidation & channel? if so i know it will be a solid reverse for a possible long setup! What are your thoughts?

USDCHF | Perspective for the new weekFrom the weekly chart, the overall perspective is Bearish despite the uptrend scenario on the daily chart that began on the 2nd of November 2021.
The Greenback climbed to over a two-week high prior to the Non-farm payroll report but was struck with a wave of "sells" after the report detailed that the US economy added 199,000 new jobs in December - a feat which was below the consensus of 400, 000.
Tendency: Downtrend (Bearish)
Structure: Breakdown | Supply & Demand | Trendline
Observation: i. Since July 2020, it is observed that the Fr0.93750 zone has been a strong area for the bears.
ii. The Bullish run that began on the 2nd of November 2021 was stalled at Fr0.93750 (an area peculiar with strong selling pressure in the last 18months) and was immediately followed by strong selling pressure which is represented on the chart bearish engulfing candle
iii. Trendline: The visual representation of a line drawn above pivot highs reveals the prevailing direction and speed of price action in the last42 days.
iv. And since the strong reversal, buyers have been finding it difficult to break through Fr0.92800. A character that emphasizes the selling pressure at this juncture in the market.
v. The breakdown of the Bullish trendline and Key level in December 2021 is a further signal that buyers are losing steam as they make another attempt to hijack the momentum from sellers during last week trading session.
vi. For me, the surge in price during last week trading session could probably lead to a retest of the bullish trendline broken to incite a further decline in price in the coming week(s).
vii. The early hours/days of the new week might see a price climb into the new supply zone I have identified within Fr0.92120 &0.92450 where I shall be looking for a reversal set up to take a short position
viii. If this does not happen and price decides to do an outright breakdown of key level @ Fr0.91750 then it is advisable to use the key level as a yardstick for precautionary measures... Trade consciously!😊
Trading plan: SELL confirmation with a minimum potential profit of 150 pips.
Risk/Reward : 1:5
Potential Duration: 2 to 7days
NB: This speculation might be considered to make individual decisions on the lower timeframe.
Watch this space for updates as price action is been monitored.
Risk Disclaimer:
Margin trading in the foreign exchange market (including commodity trading, CFDs, stocks etc.) has a high risk and is not suitable for all investors. The content of this speculation (including all data) is organized and published by me for the sole purpose of education and assistance in making independent investment decisions. All information herein is for your reference only and I take no responsibility.
You are hereby advised to carefully consider your investment experience, financial situation, investment objective, risk tolerance level, and consult your independent financial adviser as to the suitability of your situation prior to making any investment.
I do not guarantee its accuracy and is not liable for any loss or damage which may result directly or indirectly from such content or the receipt of any instruction or notification therewith.
Past performance is not necessarily indicative of future results.

Double Top on Cosmos?4H chart. Double top forming on Cosmos? Lines represent historical support and resistance lines I've had for a while that are continuing to give some insight, which do line up to fibs.

4H DOTUSDT potential to the upside!Hi everyone!
4H"
DOT is currently looking to bounce back up from this local support level at $25, If this is accomplished over the weekend. We might continue to see it retest $30 mark. But due to the current market "BTC" I see that we need a lot buying pressure to build the required volume for it to able to go back up to the $40 Mark.
Also Looking at the chart I see a formation of reversal pattern. Further more I have used the Pitch-Fork to help me analysed to see possible break out points in conjunction with the resistance levels showed. (to project future the trajectory)
If we fail to for a break out pattern we my see it going below $20 and sitting at a lower support.
ALWAYS look for extra confirmation before making any trade.
Happy trading people
(No financial advice)
DISCLAIMER
The trading ideas, analysis, and comments above should not be considered financial advice or recommendation to trade or invest in any financial product. Your personal situation has not been taken into consideration in the trade ideas. This page is for general educational purposes only. Do not buy or sell any product discusses on this page before doing your own research. Always do your own analysis and research and be aware of the risks involved in trading any financial product :)

#AMC did double bottomthere's a support we might visit if we didn't hold our double support above the 20$, which will be at 17.30$, where we meet our ascending line that was respected for a year, after the last squeeze .

EURUSD | Perspective for the new weekHappy New Year!
I welcome you to another new year with an against all odds expectation as I look forward to a Bullish expectation if the price successfully completes the reversal set-up identified on the Daily time frame (despite everyone looking for sell opportunity).
Technically, the Euro continues to lurk around respected Demand level with high hopes of shooting above Key level @ $1.31
Price action remains stuck in a tight range as participants wait for additional catalysts such as economic data from the EU and U.S., Non-Farm Payrolls report for signals.
Tendency: Uptrend (Bullish)
Structure: Supply & Demand | Reversal pattern (ascending triangle)
Observation: i. Since the beginning of the last year 2021, the Euro recorded a 9.4% decline against the Greenback to express an emphatic bearish momentum.
ii. The bearish momentum appears to have found bottom @ $1.12 in November 2021 which can be evident in the character of price action in the last 3 months.
iii. Since hitting bottom @ $1.12, we have noticed a gradual bullish momentum as the price continue to find higher lows but met with a strong resistance level @ $1.138 area hereby transposing into an Ascending Triangle formation.
iv. Ascending Triangle: the resistance line runs parallel while the support line is rising and to avoid false breakout at $1.138, we might want to wait for confirmation in the form of a retest of this level to go long.
v. However, it is worthy of me to note here that the above key level @ $1.131 appears to be a comfort zone for me to long with hopes of adding to my existing position at Breakout/Retest of $1.138 area.
NB: Considering the long-term Bearish momentum, it is appropriate that we remain conscious as this narrative on a Bullish bias might be a correction phase that might incite a downtrend continuation but till then ... Trade consciously!😊
Trading plan: BUY confirmation with a minimum potential profit of 250 pips.
Risk/Reward : 1:4
Potential Duration: 5 to 15days
NB: This speculation might be considered to make individual decisions on the lower timeframe.
Watch this space for updates as price action is been monitored.
Risk Disclaimer:
Margin trading in the foreign exchange market (including commodity trading, CFDs, stocks etc.) has a high risk and is not suitable for all investors. The content of this speculation (including all data) is organized and published by me for the sole purpose of education and assistance in making independent investment decisions. All information herein is for your reference only and I take no responsibility.
You are hereby advised to carefully consider your investment experience, financial situation, investment objective, risk tolerance level, and consult your independent financial adviser as to the suitability of your situation prior to making any investment.
I do not guarantee its accuracy and is not liable for any loss or damage which may result directly or indirectly from such content or the receipt of any instruction or notification therewith.
Past performance is not necessarily indicative of future results.

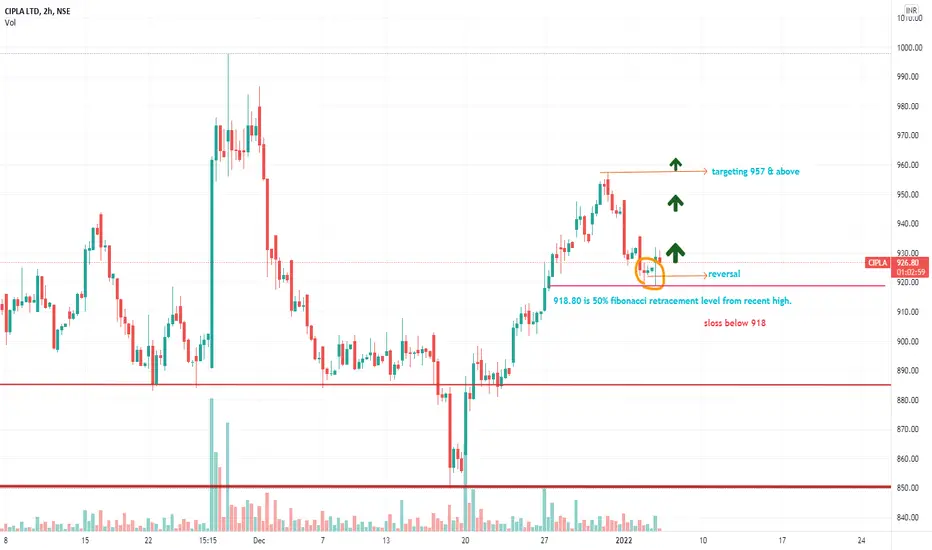
CIPLACipla is showing signs of reversal on hourly charts.
Cipla took support near 50% FIBONACCI RETRACEMENT level of 918.80 & reversed.
As long as Cipla is above 918 then its buy with mentioned stop-loss & target.
DXY 96.28 +0.06% LONG IDEA * PRICE ACTION & REVERSAL PATTERNSHELLO EVERYONE
HOPE EVERYONE IS DOING GOOD HAVING A GOOD ONE, HERE'S A LOOK AT POSSIBLE SCENARIOS THAT COULD PLAY OUT IN THE COMING WEEK ON THE DOLLAR INDEX .
* The index broke out of a ascending channel but seems the channel might not be out of play as of yet.
- Short term the index is currently completing a possible inverted H&S formation on the 4h chart.
- Looking for long entries on the metal this week should all the rules of the formation be met.
lets see how it goes
IF THIS IDEA ASSISTS IN ANY OR IF YOU LIKE THIS ONE
SMASH THAT LIKE BUTTON & LEAVE A COMMENT.
ALWAYS APPRECIATED
____________________________________________________________________________________________________________________
* Kindly follow your entry rules on entries & stops. |* Some of The idea's may be predictive yet are not financial advice or signals. | *Trading plans can change at anytime reactive to the market. | * Many stars must align with the plan before executing the trade, kindly follow your rules & RISK MANAGEMENT.
_____________________________________________________________________________________________________________________
| * ENTRY & SL -KINDLY FOLLOW YOUR RULES | * RISK-MANAGEMENT | *PERIOD - SWING TRADE

USOIL 76.02 +0.06% SHORT IDEA * REVERSAL & PRICE ACTIONHELLO EVERYONE
HOPE EVERYONE IS DOING GOOD HAVING A GOOD ONE, HERE'S A LOOK AT POSSIBLE SCENARIOS THAT COULD PLAY OUT IN THE COMING WEEK ON OIL .
* The ENERGY is range bound within support and resistance structure of an descending channel .
- long term the metal is currently completing a possible H&S formation on the D,W & M chart.
- Looking for shorts on the ENERGY this week
lets see how it goes
IF THIS IDEA ASSISTS IN ANY OR IF YOU LIKE THIS ONE
SMASH THAT LIKE BUTTON & LEAVE A COMMENT.
ALWAYS APPRECIATED
____________________________________________________________________________________________________________________
* Kindly follow your entry rules on entries & stops. |* Some of The idea's may be predictive yet are not financial advice or signals. | *Trading plans can change at anytime reactive to the market. | * Many stars must align with the plan before executing the trade, kindly follow your rules & RISK MANAGEMENT.
_____________________________________________________________________________________________________________________
| * ENTRY & SL -KINDLY FOLLOW YOUR RULES | * RISK-MANAGEMENT | *PERIOD - SWING TRADE

XAU/USD 1804.60 +0.19% LONG IDEA PRICE ACTION HELLO EVERYONE
HOPE EVERYONE IS DOING GOOD HAVING A GOOD ONE, HERE'S A LOOK AT POSSIBLE SCENARIOS THAT COULD PLAY OUT IN THE COMING WEEK ON THEGOLD METAL .
* The metal is range bound within support and resistance structure of an ascending channel.
- Short term the metal is currently completing a possible double bottom formation on the 4h chart as confirmation.
- Looking for long opportunities on the metal this week
lets see how it goes
IF THIS IDEA ASSISTS IN ANY OR IF YOU LIKE THIS ONE
SMASH THAT LIKE BUTTON & LEAVE A COMMENT.
ALWAYS APPRECIATED
____________________________________________________________________________________________________________________
* Kindly follow your entry rules on entries & stops. |* Some of The idea's may be predictive yet are not financial advice or signals. | *Trading plans can change at anytime reactive to the market. | * Many stars must align with the plan before executing the trade, kindly follow your rules & RISK MANAGEMENT.
_____________________________________________________________________________________________________________________
| * ENTRY & SL -KINDLY FOLLOW YOUR RULES | * RISK-MANAGEMENT | *PERIOD - SWING TRADE

EUR/CAD gives bullish divergence cluesEur/Cad currently at 1.4498, shows a possible bullish divergence.
Notice the RSI achieving higher lows, yet the price continues down. A possible reversal is likely.
Chris at TheTradingMentors
