Final wave in USDCAD triple three correctionBuy FX:USDCAD into potential wave C to complete triple three correction and form a three drives pattern @ 1.3830. Still, might not complete this one as it looks too perfect to materialize :)
Buy 1.3170
Stop 1.3140
Target1 1.3430
Target2 1.3670
Target3 1.3830
Reversalpoint

eurjpy small retractment before going long 3 hour chartAfter bouncing of a 2 month resistance level, The eurjpy goes short before marching off in a continued up trend.
Has the eurjpy finally reversed from last years down trend?

AUD/JPY, DAY CHART, SHORT (8-JAN-2017)Note:
AUD/JPY is reaching the strong resistance zone at
86.2x level.
There are 3 potential trading plans for this pair:
1. We expect the price will approach the resistance
zone at 86.2x level. If there are 1 strong bearish or
2-3 bearish signals, we will choose to short.
2. There is possibility that the price break the resistance
zone and reaching the previous peak at 86.9x level
before heading down. Need to watch this level.
3. If the price break both resistance level strongly,
we will support bullish view on this pair

EURUSD Deep Crab Reversal Targets Hello traders
we are near the completion point D of deep crab reversal pattern ,
Please wait for good entry setup which matches your strategy and make some profit
Our first target will be the 38.2 Retracement
Our second target will be the 61.8 Retracement

GOPROReversal pattern.
Support level at week timeframe.The support line must be at this area 8 - 7.50 $. if price breaks that line ther is Fibbo 1.272 at 6.16 $.
Good luck for all.

Dont Miss ETC Reversal!! Just starting! still bottom. Buy - hold - wait- profit. long term spot position.
target 4-5X
Buy spot to have a stress free trade,
for Fundamentals & more in depth analysis check the charted posted 2 weeks ago at the very bottom very bullish reversal signals were evident.

Key reversal in Gold after a double zigzag correctionIt has been a pretty deep six month correction in OANDA:XAUUSD . The only valid interpretation of this corrective move in accordance with Elliott theory appears to be a double zigzag W-X-Y .
This double zigzag subdivides into two actionary zigzag waves A-B-C intervened by simple reactionary X , which is a corrective wave itself.
According to an introduced count, we have an impulse-triangle-impulse representation of both A-B-C sequences. Where B waves are both running triangles, implying subwave b going below the end of wave A , previous impulse low.
As OANDA:XAUUSD has completed another triangle (which always occurs in a position prior to the final actionary wave) inside an impulse wave C, we are going to have a 20 point decline to complete subwave v . As impulse C has 3rd subwave iii extended, I expect subwave v to be equal to subwave i , which is also equal the height of triangle in subwave iv . Thus we have to arrive to over target and long position entry point @ 1115.x
In a zigzag, the length of wave C is usually equal to that of wave A, although it is not uncommonly 1.618 times the length of wave A. This relationship applies to a second zigzag relative to the first in a double zigzag pattern. As one can see, we have closely approached this target @ 1120.x. Gold rarely bounce right of the targets, more common behavior is to penetrate a target and take one's stops out first ;)
I suggest to look this subwave v evolves, making an RSI divergence between subwave iii and subwave v . Daily RSI(14) have been in an oversold territory for a while, but the recent sharp move to 1223.x took it to 20 level and then it bounced back, creating a good opportunity to form a divergence. One can also take a look at 15m TF, count subwaves of this last impulse subwave v and spot some divergence between 3rd and 5th subsubwaves for more precise entry.
As a confirmation we have 78.6 retracement of the bullish move from 1046 low @ 1116.x and a longterm trendline from 2006 or 2008 local lows @1106-1122 area depending on what scale one use. CoT report also suggests the possibility of reversal as producers cut more then 60% of their net positions (which appears to be short) throughout this decline. Seasonality is also in favour of Gold after a New Year as the inflation picks up after a holiday/sale period.
For my first entry @ 1115 I'm going to place a stop around 1107, just below previous market structure extremums.
The target for this longterm trade really depends on where we are at. Either next up wave will be a wave C circled of bearish A-B-C circled correction or wave III braced of a bullish 5 wave advance. In first case wave C circled could be equal or a 1.618 v 0.618 product of wave A circled . In case of bullish wave III braced the target couldn't be set before we will see the subwaves developing.
I hope it isn't the case, but keep in mind a triple zig-zag correction, which is less probable but still possible, which could take us even below 1046 lows. Anyway now we need to bounce.
Trade safe, cut your losses short and let your profits run.
Cheers!

MM-Reversal-Probability-Index [MM-RPIDX]This indicator tries to show the probability of an impending reversal. It's using a number of different input signals and candle stick patterns and conditions:
6 different moving averages
Averages of moving averages
MACD
RSI
Stochastics
Keltner channels
Pin bar patterns
Engulfment patterns
The indicator is designed as an oscillator and treats positive values as a signal for an impending bearish reversal and negative points for an impending bullish reversal.
At the moment it includes 46 different conditions to calculate the overall index. The 46 conditions flow into 15 signal lines which are summarized to the overall reversal index.
This indicator is not just a simple line with a couple of peaks.
It’s designed to interactively work with it. It's got tons of tweaking options in the settings section.
Examples of usage:
Use it for primary reversal detection
Use it for reversal confirmation
Use it for candle stick pattern detection
Use alert levels to increase/decrease the number of reversal detections
Detect MACD crossings
Detect Moving Average crossings on different levels
Detect indecisive areas of sideway chopping
Examples of conditions:
is there a crossing of the MACD?
are there multiple MACD crossings?
are there any significant crossings of moving averages?
is the market chopping sideways?
are there any reversal relevant candle stick patterns?
did these patterns appear inside or outside the Keltner channels?
are these patterns confirmed by the subsequent candle?
was there a crossing of the %K and %D line of the stochastics in the last periods?
is or was the RSI in the overbought or oversold zone?
...
Concept:
Instead of watching 10 different signal lines of indicators and candle stick patterns simultaneously I wanted to have one indicator which aggregates all (or at least a lot of) the relevant information.
So the idea was to create an index and assign a specific amount of points to specific attributes or situations (e.g MACD crossed or pin bar candle stick pattern occurred and was confirmed by the subsequent candle and was outside the Keltner channels).
After gathering all the information (or points) everything is boiled down to one index.
Notice: there is no holy grail in TA!

Reversal occurs if it will go upif price will follow arrow, upwards, it will be revered from the point shown on chart

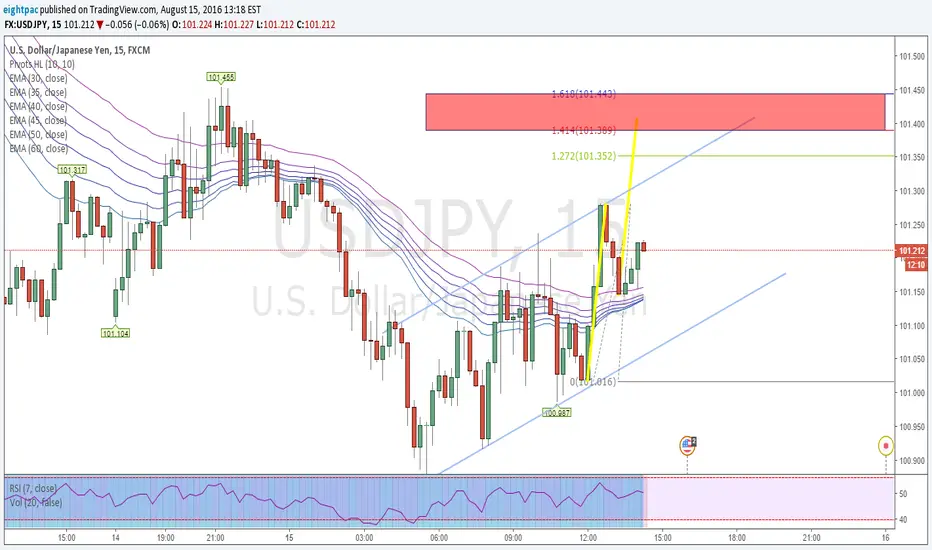
Short it the safe way!So USDJPY is now near a good supply zone and we can look to shot it from here.
But do it safe and no rush to take the extreme top, that use to burn fingers and wallets.
In the chart you see two ways to do it the safe way, and that how i would take that trade.
Like if you agree, follow and support please!
Good luck!

XAUUSD - Long SetupWith this Doji pattern we expect a reversal movement.
Long Setup:
Entry: 1185.39
TP: 1252.96
SL: 1160.761
Happy trade :)

BOUNCE AND BREAK [EURUSD Daily]If the gold S/R -D1 Holds, the price should break the trend line and a trend reversal could take place.
A green candle that breaks the upper trend line is my first confirmation.
Further divergence on RSI will validate the trade

GBPNZD - Long positionCould be a reversal zone.
R:R : 4.09
Buy Entry: 1.68717
Stop Level. : 1.63906
Take Profit Level. : 1.88392

AB=CD completion near a PRZ.AUDCAD completed an AB=CD near the highs of 2014(See the link below for older post on this). For me this is a very good PRZ and gonna watch it closely next week.
If you switch to 4H you will see the divergence more clear on the RSI. As always i'm putting both aggressive and conservative entry scenario.
Like if you agree, follow and support please!

ETC price actionMaybe, just MAYBE, this could be the beginning of a reversal of sorts, so let's wait and see if the price manages to consolidate above the broken trend line.

Nike Showing Double BottomLooking for a bounce with NKE now showing a double-bottom from it's June 2016 low. Volume looks to be getting lighter, so I'm looking for volume to increase on the reversal and take it to $55.

Helpful Gold Analysis and trade set up with entry strategy!A breakdown of Gold with potential scenarios for both the up and downside.
The blue box indicates the criteria for entry with 4/5 requirements needing to be met before entry, this method cuts losses and gives a clear structured way to enter trades that can be back-tested.
Good luck!

USDJPY ABCD Pattern Short Sticking with the prevailing trend on the higher time frames and looking for a possible short entry to get in on should this thing break to the downside based on the 1D chart. The area where this harmonic pattern would complete comes in at a previous structure level on the 15m chart.This may serve as a possible short entry should there be SIGNS that the market wants to revert and continue down (I need conformation like a teenager!). I would only enter if both legs match, AND if there are bearish signals at that level. Just my two cents, what do you think?
long term 1 week buy on cadjpyreversal of major downtrend since price has been way below 50 EMA and stoch is oversold id say buy now or soon as possible with a buy order for 76.152. collecting profit at 79.432 would be ideal for price consolidation.

Wedge Top on 4hr chart4hour chart is showing a wedge and it strongly reversed down. It is now in process of testing the top again. It is a good place for double top than breakout so it offers good risk reward ratio here.
Sell in the region of 1.118X with SL at 1.1210. target area is 1.1120 and 1.1080.

NZDUSD 1D possible reversal.This pair went all the way down nicely to the support area and the indecision candle formed at the end of the week. This area has been tested several times before, but NZD/USD is in major uptrend right now, plus, the bottom wicks and the placement of indecision candle (the Friday one) are indicating that Bulls're taking control, so I'll aim for opening long position, when the reversal is confirmed.

Possible Bottom & Breakup >>> Reversalpoint?... (!!!)Looks like we have some a break out (although not 100% clear) on the 4h.
Moreover, the last dip makes up for a possible bottom since it met a) the lower end of bull channel and b) the lower end of linReg(50,200).
It is not a clear hit, what could mean it takes another shot at it, but the bottom might be in here already. Especially, in the light of Bert continuing to be weak as hell, this is a reasonable spot to long...
Happy Tarding!

USDJPY to reach 108The pair dropped significantly after the BOJ announcement but recovered strongly soon aftertwards. Strong support is now at 105.560 and the jpy is heading up to 108. This is gonna be a interesting area as large selling volumes were spotted in there in April. USDJPY is being traded within the downard channel and there's no bullish sentiment until the 111.3+ is broken. I assume at 108 we could see a nice move down to 107.32. As alternative scenario the breakout to the upside is possible too.
www.fxkool.wordpress.com
