Is CVNA setting up a short trade with its pop?CVNA on the 2H chart appears to be retesting the resistance zone established by a head and
shoulders pattern over the middle of June. Additionally, on the stochastic RSI it is at a level
from which it reversed on May 25th as well as the pivot highs associated with the H & S.
While volume is above the running average, it is not a spike and so without high significance.
I see CVNA as reversing now or very soon. I will monitor this on a lower time frame and look
for an entry. Once I see some indecision HA candles and their color change from green to red
accompanied by some volume and/or volatility possibly confirmed by a bearish divergence
downtrend on the RSI I will take a short trade and potentially a put option as well.
I think short sellers will be stepping in here with volume after the price spike CVNA just
completed. I will be among them.
Reversaltrading

Can NVAX rise again?NVAX has had significant down trending over a wide range of time. On the 4H chart it seems to
be pivoting from a swing bottom 3-4 days ago. This is accompanied by a cross of the MACD
lines under the histogram on that indicator and a flip of volatility on the relative volatility
indicator. NVAX has been subject to significant short selling. Price is presently nearly
two standard deviations below the mean anchored VWAP set in mid May. Basically it is in
deep undervalued oversold territory and now with a rise. The volume profile has a point of
control level considerably above the mean VWAP. This is the level with the highest volume
of trades showing most trades occurred well above VWAP. This would be traders taking
profit and selling or alternatively short sellers opening a position but more likely a combination
of them. Price wants to ascend to at least VWAP if not the POC line. My analysis is that
any significant rise could begin a squeeze on short positions. Those closing with a buy to
cover trade would in effect be synergizing new buyers and add to the bullish momentum,
Accordingly, I will open a position early and see if I can get in ahead of a potential
short squeeze. While speculative, a narrow stop loss at 6.80 the second band line below
the mean VWAP will take a lot of risk off the trade and allow me to be patient comfortably
watching the price action.

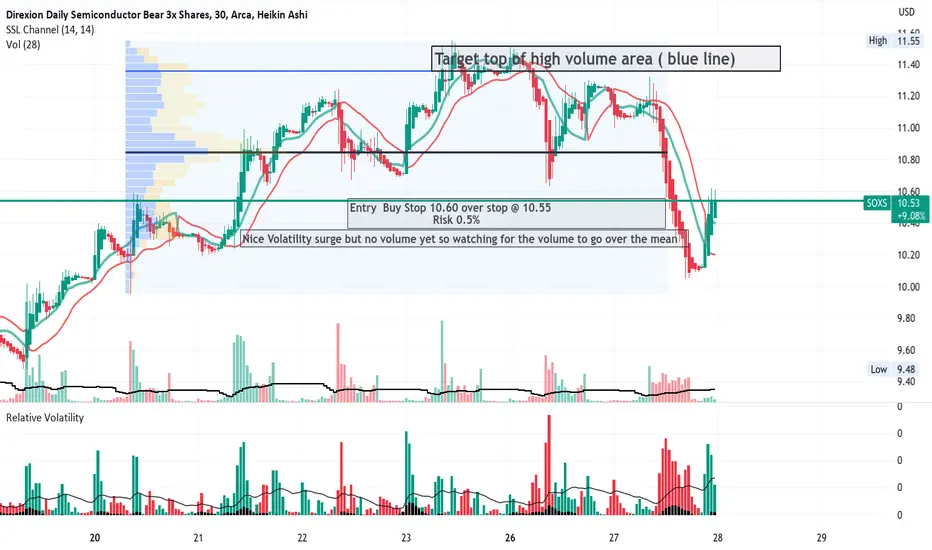
SOXS Bearish Leveraged semi-conductors ETFNVDA turned down today while SOXS rose a bit. On the 30 minute chart is shown to have
have been trending down but then reversed in the after-hours trading period albeit with
the low volumes typical of after-hours. The relative volatility indicator however showed
a dramatic reversal and will be beyond the moving average within the indicator.
Overall, I see this as a day trade for June 27th. I have marked out a tight stop loss to minimize
risk. This trade which I will enter in the premarket is expectant for 8-9% profit and so
a reward to risk of 15:1
SDOW a triple leveraged ETF shorts the DOWSDOW is shown here on a 30 minute chart current rising above a parallel descending channel
which is within a longer trend of a downward-facing megaphone pattern where it is currently
situated near the top of the megaphone. I have drawn the two trendlines onto the chart
and added an RSI indicator. My plan is to take a short trade on SDOW by looking for an entry
on the 5 minute time frame where the HA candles are red and the RSI has dropped below
50. I will set the stop loss above the resistance trendline while targeting the support
trendline at the low of the pattern.

MDT is set to recover - overreaction on the outlookMDT beat analysts' estimates but guided somewhat dovish. The market has penalized the stock - it could be an overreaction. The management executes well on the business. I expect higher prices.

Can MULN reverse its decline?MULN is a stock in the EV automotive space. As recently as last year it was priced at $30-40 per
share. It has steadily declined but continues to have volatility flare-ups where the price spikes.
I understand it has a bit of a cult-like following which is not uncommon. Price has lost
50% since the latter part of May. On the 15-minute chart, price has jumped about 10% in the
past few days with increased volatility and a confirmatory trend of the lines of the MACD
crossing above the zero horizontal line. I suppose this could be a retracement /correction but
it also could be a reversal in its earliest phase. I see this as suitable for a small position risking
less than a tenth of a percent of the account. The stop loss is 46 cents or about 6-7%. This is
the recent pivot low. My first target is 1/2 of the previous decline or about $.70 with a second
target at $.80 and the final target of $0.95 knowing that $ 1.00 is a psychological level.

Is AUDNZD due for a reversal?AUDNZD as shown on the 15- minute chart is rising after the Australian central bank raised its
prime rate in keeping up with another global tightening. Since May 24th AUDNZD has risen 4%
in various legs with some consolidation but no downturns. ADUNZD may be due for a correction.
IT is shown here on the 15-minute chart along with the "Alpha Trend" indicator, the zero lag
MACD indicator and the visible range volume profile. AUDNZD is above the POC line
showing bullish buying pressure to have pushed it higher. However, on the MACD, the K/ D lines
are setting up a cross over the histogram which typically is a sell signal. AUDNZED may hae
had a decent trend up but could now be getting ready for a "reversion to the mean"
Because of this I will watch AUDNZD as a candidate for a short trade perhaps with a
retracement of 2% ( 1/2 of the trend up) over a period of several days.

DGLY is due for a correctionDigital Ally, has had a bit of a slow motion pump after earnings in mid-May. Insofar as the
earnings go, there were none. The news is DGLY is burning cash less than expected. No matter
how you cut it shareholder value is not there and still the price went up since then especially
in the last few trading sessions. DGLY could dilute shareholders to raise capital. Insiders
could be manipulating the price. According to FinTel, there are 12 insiders who own 7.7% of
the shares. Seemingly, if they act in a coordinated scheme without any paper trail they could
have run the price up especially if they got help with one of the several penny stock trading
rooms with lots of followers. Overall, this looks like a pop and drop pumped up and ready
to flush. I will take a short trade of put options on this expectant for a quick profit over
a week or two.

Food Gaint Kroger reverses from a trend downKR has an overall fairly narrow trading range. On this 4H chart, it is presently in a symmetrical
triangle or slowly rising wedge. Earnings beats have been respectable. KR reversed on June 1
at the trending support line and is heading toward overhead resistance. Just before that upper
resistance trendline is the POC line of the high volume area of the profile where high volatility
and increased trading could result in a bounce and fall. Confirmation is found in the zero-lag
MACD indicator which shows a K /D line cross under the histogram.
I will take a long trade on KR (reversion to the mean) with the stop loss at that pivot low on
June 1st and the target a nickel below the POC line at 48.95. I see this as a low-risk and low
reward trade which may also be the basis for adding a low risk call options trade to the
options portfolio.

Is DISH ready to dish out some profits?On the weekly chart, DISH has been in a steady decline for over a year and is now on sale for
20% of the asking price a year ago. It is sitting on the long term support zone and has passed
over the POC line of the volume profile putting buyers in control. The red doji candle followed
by the green doji candle is the capitulation of the bottom. Volume in 2023 has steadily and
persistently grown compared with 2022. The accumulation/distribution curve slope has
finally approached zero to suggest a price action reversal
. I will take a long trade early and beon the leading edge of the uptrend after noting a 15%
breakout to kick off the month of June.

FULC Biotech Fib Level BouncdFULC on the 15 minute chart had a good response to favorable earnings and then retraced.
It is now bounding off the Fib 0.5 level and also confluent with the POC line of the volume
profile and the mean of the anchored VWAP. Buying volume appropriately overtook selling
volume on the reversal Luxalgo's Echo indicator, an AI predictive tool, suggests a 10% price
rise in the after-hours which is typically a busy trading period for biotechnology penny stocks.
I will take a long trade on FULC in after hours and take off a part of the position in the next
trading day and hold the rest through the weekend.

XAGUSD Spot Silver - Is it ready to reverse up?Spot Silver dropped this past week about 6.5 % from its high early in the week. On the
15-minute chart the drop occurred over three days. XAUUSD is now underneath the POC line
of the volume profile as well as the negative bands of the mean anchored VWAP. The Mass
Indicator and faster / slower MA ratio indicator are both near the zero line showing that
bearish momentum has subsided and a reversal may be underway. Overall, I expect a reversal
with XAGUSD seeking the mean. The first target is the POC line confluent with VWAP so
25.08 while the final target is 25.55 being the redline demarcating the top of the high volume
area. I expect this to be a 1-2 day trade with high potential reward especially if leveraged
on forex.

NIO REVERSES within descending parallel channelOn the 30-minute chart, I have drawn the upper (red) and lower (green) trendlines
of the descending parallel channel. While it had been riding the upper edge of
the Fibonacci/ EMA channel, it has reversed and headed toward the base EMA with
the candles green to red. The zero-lag MACD indicator lines crossed above the
histogram while the True Strength Index oscillator has had a line cross in the supply /
resistance zone for further information. I conclude it is time to close long positions
in profit and cross the aisle into short positions. I will take a put option trade for
the expirations of 5/19 @ $ 9.50 but a less risky trade would be a longer exiration
by 1-2 weeks ( while at the same time decreasing the reward potential.)

EUR/JPY 147.775 +0.29% LONG IDEA 🐮📈HELLO EVERYONE
HOPE EVERYONE IS DOING GOOD.
* Looking at EURJPY London session TRADE which my play out NEW-YORK SESSION
* Asian session took out last Fridays HIGHS taking ASIAN buy side liquidity
* waiting on some market structure shift as price is delivered this morning torwads the upside.
- momentum is significantly bullish so this trade might play out new-york session.
-looking to take ASIAN liquidity below & unmitigation bullish OB.
- TARGET would be the the BSL.
lets see how it goes.
IF THIS IDEA ASSISTS IN ANY OR IF YOU LIKE THIS ONE
SMASH THAT LIKE BUTTON & LEAVE A COMMENT.
ALWAYS APPRECIATED
____________________________________________________________________________________________________________________
* Kindly follow your entry rules on entries & stops. |* Some of The idea's may be predictive yet are not financial advice or signals. | *Trading plans can change at anytime reactive to the market. | * Many stars must align with the plan before executing the trade, kindly follow your rules & RISK MANAGEMENT.
_____________________________________________________________________________________________________________________
| * ENTRY & SL -KINDLY FOLLOW YOUR RULES | * RISK-MANAGEMENT | *PERIOD - I TAKE MY TRADES ON A INTRA DAY SESSIONS BASIS THIS IS NOT FINACIAL ADVICE TO EXCECUTE ❤
LOVELY TRADING WEEK TO YOU!

HOW TO SPO REVERSAL USING ORDERFLOWLets find out how to use orderflow o spot end of a trend/reversal. hope this helps you guys

Possible beginning of a new bearish leg for SPXSummary:
Main bearish trend (dotted teal downtrend line)
Reversal attempt in progress (purple uptrend line)
200-SMA breakout in jan-2023
Failure to continue the breakout (failed bull flag - orange lines)
Arrow #3 as a good entry option for a bear trade.
Possible beginning of a new bearish leg, aligned with the main trend
Possibility to surpass the last low (oct-13-2022). Set target @3,330.00.
Timeframe expected: 3 to 4 months.
Detailed explanation:
2022 was a very bearish year for stock markets, and prices have navigated under the 200-days simple moving average (200-SMA) for the most part of the year. On the other hand, the first months of 2023 had some attempts of breakout to this widely known indicator.
By December, 2022, prices tried to break-up the 200-SMA, but failed, then pulled back and tried a new breakout in January, 2023, that succeeded and provided some hope for a reversal. Arrow #1 is signaling the top of this bullish leg. After this, prices developed a little bull flag (orange lines) , near a resistance level.
I have been closely following the price movement on this flag, to try to catch a trading opportunity, bullish or bearish. The bullish case was the most evident, and would happen with the breakout of the flag, confirming the continuation of the main trend reversal. But if it didn’t come true, prices could continue on a longer range or even breakdown the 200-SMA, providing, hence, a bearish trade. It turned out that the second case is being developed.
On February 21st the bull flag was undone, by a very bearish -2% candle, then some days passed and the 200-SMA offered a support for the prices, this movement came along with some doubt candles (tiny ranges, long wicks), their in the area near arrow #2.
This arrow points specifically to a bullish engulfing candle, that signaled a possible return of the bull and that the 200-SMA would indeed sustain the prices. After that, a bullish candle confirmed the engulfing pattern, and I considered that now it was a “make or break” situation, that either had to continue with strong buyings or finally give away and return to the main bearish trend (dotted teal downtrend line) .
The second scenario happened, with a classical shooting star candle denoting a top, indicated by arrow #3 and followed by a relevant -1.53% bearish candle. I consider it can turn out to be the beginning of a new bearish leg in favor of the main market trend. If it breakdown the 200-SMA (and the previous bottom, of arrow #2) we will probably be full gas back to the bearish trend, reverting that secondary bullish trend indicated by the purple line.
Predicting the future is impossible, but trading is a probability game, and to my criteria the odds are high enough to make a bet now. So, I started a trade yesterday near the market close. The stop zone is a little above the high of the shooting star candle of mar-06-2023, and my target is @3,300.00, I chose this number considering that this is a movement with the main trend, and that the last low (oct-13-2022) is usually surpassed in this kind of situation.
PS: I know there’s a whole FED policy/interest rates discussion going on, and that it provides much of the ultimate reasons for the market movements I described, but I will stick to technical analysis here and to the principle that the chart sums it all up, hence I considered only price patterns in my analysis.

EURUSDEURUSD has been examined in different dimensions:
1- Strong supply and demand levels that I identify with my own indicator and system.
2- The structure of recently formed waves
3- Current market momentum
4- The structure of classical and price patterns
In this idea, I identified the direction of the market in different ways and in the second step, I analyzed the potential of continuation or reversal. Usually, paying attention to the trend and strength of the trend can greatly increase the accuracy of the analysis.
In general, I tried to describe the continuation of the movement in the simplest possible way in the diagram.
⚠️ Disclaimer:
This is a personal opinion and you are responsible for any trading decisions.

❓What's Your Trading Style❓Which of these methods is your favorite trading method? Comment below 👇
🔹 Breakout trading
Breakout trading involves identifying key levels of support and resistance and entering a trade when the price breaks through one of these levels. Traders using this strategy look for price patterns that suggest a breakout is likely to occur. For example, a trader might look for a currency pair that has been trading in a narrow range for an extended period and then enter a trade when the price breaks out of that range.
Example: A trader might identify a resistance level on the EUR/USD currency pair at 1.2000. If the price breaks through that level, the trader might enter a long position, anticipating that the price will continue to rise.
🔹 Momentum trading
Momentum trading involves entering a trade based on the strength of a trend. Traders using this strategy look for currency pairs that are trending strongly in one direction and then enter a trade in the same direction as the trend. This strategy is based on the assumption that the trend will continue.
Example: A trader might notice that the USD/JPY currency pair has been trending higher for several weeks. The trader might then enter a long position, anticipating that the trend will continue.
🔹 Reversal trading
Reversal trading involves entering a trade when a trend is about to reverse. Traders using this strategy look for signs that a trend is losing momentum or that a reversal is imminent. This strategy is based on the assumption that the trend will change direction.
Example: A trader might notice that the GBP/USD currency pair has been trending higher for several weeks but is now showing signs of weakness. The trader might then enter a short position, anticipating that the trend will reverse.
In summary, breakout trading involves entering a trade when the price breaks through a key level of support or resistance, momentum trading involves entering a trade based on the strength of a trend, and reversal trading involves entering a trade when a trend is about to reverse. Each strategy has its strengths and weaknesses, and traders should choose the strategy that best suits their trading style and risk tolerance.
👤 @AlgoBuddy
📅 Daily Ideas about market update, psychology & indicators
❤️ If you appreciate our work, please like, comment and follow ❤️

MULN $ Bottom Reversal after the short attach on Muln that opened after we broke our ascending line at the 16th of feb, we went down to test our support above the 0.25$, which we broke it now, we need to hold above our current box between (0.18$/0.20$), in order to have a reversal and then test our current resistant below the 0.25$, which will give us the first signal for several and going again towards the 0.31$ profit taking .

3 Things To Do After You Lose A TradeWe have all been there. You analyze a trade setup. You know how much you're going to risk on a trade. You enter the trade just to come back to your chart and find you've been stopped out.
It's not fun. It sucks. You thought the setup would work because you followed you rules. The thing is, the market is the market.
In my early stages of trading I hated being stopped out. My reasoning was because. I had no idea how to make up for my loss.
I thought if I just plotted more lines and levels on my chart I could enter the trade again and make my money back.
The problem I kept running into was I had no idea why I lost the trade or how to handle my feelings. I also had no real plan on how to adjust to the price change.
I honestly thought my levels or trend lines didn't work. It was deeper than that.
What changed?
I had to change the way I viewed the market and my next steps to recover my loss. Not only that, I had to learn how to be "ok" with losing money.
I created a 3 Step Process that would increase my probability of winning my next trade. Because we are a trading family, I thought I'd share it with you.
Step 1: Access my previous trade
You hear this all the time, "I made a mistake thats why I lost the trade." The true question is did you really make a mistake or did you follow your trading rules?
When I follow my rules no mistakes are made. When I lose a trade that can mean 1 thing. The market reversed. This leads me to step 2.
Step 2: Change my bias
In the book The Unknown Market Wizards by Jack Schwager, I heard the most beautiful and profound statement by one of the wizard traders. He said, "I realized I have a right to change my mind about my trade at any time."
I can't tell you how that made me feel. I've been doing that all along, but this market wizard summed up my actions in just one sentence.
When I'm stopped out that means I have to change my mid about the direction of the trade. I made being stopped out so simple so I won't confuse the next action I should take. That leads me to step 3, update my chart and adapt to the new price movement.
Step 3: Update and Adapt
I have a no nonsense rule and that is to stop trading in 1 direction if I'm stopped out. Go opposite. I'm a true trend trader. I don't naturally trade against the trend. It gets me in trouble.
So at the first sign of trouble, I adapt.
See, USDCHF was in a downtrend.
I sold the trade at 0.92835( sell limit) and overnight I was stopped out. It happened so fast and just as fast as I was stopped out, I knew I had to become the buyer.
My Mental
In the recent past, being stopped out would have spooked me. Now, its making me want to come back to the charts to face my fear. I used to have a fear of success and failure. Now I have a hunger to want to succeed and learn.
Putting on trades is a bit more fun since I've began working with pending orders. They challenge me. Especially in situations when price reverses and I'm stopped out.
I pray you gained new insight and a key takeaway on what you can do next after you lose a trade.
Just remember, losing a trade doesn't make you a loser, it makes you a trader.
Comment down below what your takeaway was. I'd appreciate it if you could like the post. It helps boost my Trading view reputation. Much love,
Shaquan

Reversal VisibleThis counter can move up to 335 in the next few weeks. One should track this counter for knowledge purposes. At attractive valuations and reverse zones on technical charts.

RUN ( Sunrun) and other solars ready to reverseDowntrending but with diminishing candle ranges and Dojis. The MACD oscillator
has lines crossed under the histogram. Currently priced more than one standard
deviation below VWAP and ready for entry.
See also ENPH, SEGD, SUNW, and the ETF- TAN.

HOW TO trade USDCAD reversals 💵🍁We have an alert for a sell on USDCAD.
Trading on the 30M timeframe.
I'm using my POW EDGE reversal strategy for this trade idea.
Little red arrow is entry point.
Red trade label shows trade details.
Green lines are TP and purple lines SL.
Stats for the strategy can be found at base of idea.
Chart shows previous trades from last week.
Strategy is in a rich vein of form.
Can we start this week off in the same manner last week ended.
__________________________________________________________________________________________________________
What is our POW reversal script?
Quiet simply our script is a reversal strategy and can be used on any instrument and time frame.
POW reversal strategy sits within your TradingView and you as the user will see exactly what we see - the trade, entry price, SL and TP values.
This is a mechanical trading system, Which through third party services can be automated.
Our script is based on a combination of indicators with the main ingredient being RSI .
As a user using the script you are able to see all available settings and what they are.
The values for each setting can be adjusted to fit and suit each individual instrument as well as the time frame said instrument is being used on.
We know upon changing settings if they will work on the trading instrument and the time frame being worked as we have coded in a built in strategy tester.
A big overlooked not used enough feature of TradingView's pine code is the strategy tester which saves hours of time not having to manually back test a strategy.
Having the data in an instant enables us to enter trades with full confidence knowing we are working a proven system.
Having the built in strategy tester also doubles up as a live trading journal too as the strategy tester will confirm and support every open and closed position.
We are working to a rules based approach to trading for our entry, exit and risk management.
All subjectivity and emotions are removed we simply follow and execute the already tested strategy.
My latest trade recap video can be seen below and gives great insight into POW tradingview pine scripts we use
Thanks for looking at my idea 👍
Darren
