REZUSDT at a Critical Point– Testing a Major Long-Term TrendlineComplete Analysis:
The REZUSDT pair is currently showing a highly compelling setup, as price approaches a long-term descending trendline that has held since May 2024. This is a pivotal moment that could dictate the next significant move—either a bullish breakout or a bearish rejection continuation.
---
📉 Pattern and Structure
The chart is forming a large Descending Triangle pattern, with the descending trendline consistently pushing the price lower for over a year.
Price is now nearing a key horizontal resistance at approximately 0.01826 USDT, which also intersects with the long-term trendline.
The lowest support level sits at 0.00698 USDT, marking the bottom from a major previous decline.
---
📈 Bullish Scenario
If the price successfully breaks and closes above the trendline (~0.01826 USDT), then:
The next potential upside targets could be:
0.03254 USDT
0.04627 USDT
0.06289 USDT
This breakout could signal a trend reversal in the medium term, especially if accompanied by strong volume.
---
📉 Bearish Scenario
However, if the price gets rejected at this resistance area:
It could pull back toward:
The minor support at 0.01200 USDT
The major support at 0.00698 USDT
A rejection at this trendline would confirm the continuation of the bearish descending triangle pattern, which traditionally favors further downside.
---
🧠 Conclusion:
REZUSDT is currently in a make-or-break zone. The market’s reaction to the descending trendline will be crucial in determining the next move. Traders should monitor volume and wait for a solid candle confirmation before entering any position.
#REZUSDT #CryptoAnalysis #TechnicalAnalysis #AltcoinBreakout #DescendingTriangle #CryptoTrading #TrendlineBreak #SupportResistance #REZAnalysis #BreakoutWatch
Rezusdtanalysis

REZ / USDT : Trying to breakout from Trendline resistanceRez/USDT is currently testing a crucial trendline resistance. The chart shows signs of a potential breakout, and if it surpasses this resistance, we could see a strong move towards $0.0025. With increasing momentum, this could trigger a short-term bullish rally. 📈
Bullish Scenario:
If Rez/USDT breaks the trendline resistance decisively, we could see a price surge towards $0.0025.
Target: $0.0025 with a possible continuation beyond that if momentum builds.
Bearish Scenario:
If the price fails to break the resistance and gets rejected, we may see a short-term pullback.
Watch for a strong support zone to form for potential re-entry at lower levels.
Pro Tip:
1. Enter after breakout above trendline.
2. Set stop-loss below trendline.
3. Target $0.0025 for short-term gains.
REZUSDT 1D AnalysisREZ ~ 1D Analysis
#REZ Buy again from here if you still have confidence in this coin with a short term target of at least 15%+

This Hidden Altcoin Could Explode—But Only If THIS Level Holds!Yello Paradisers, have you seen what’s quietly brewing on REZUSDT? A high-probability bullish reversal setup is forming, and if this level holds, it could lead to one of the cleanest altcoin plays we’ve seen recently. This isn’t just about one signal—REZUSDT is showing a rare confluence of bullish indicators that deserve your full attention.
💎Currently, REZUSDT is moving within a descending channel while printing a bullish divergence on momentum indicators. At the same time, a textbook W-pattern has just formed, and what makes this even more significant is that it’s happening right at a support zone. This triple confluence—descending channel, bullish divergence, and W-pattern at support—is increasing the probability of a bullish breakout in the coming sessions.
💎From an entry perspective, those looking for more favorable risk-to-reward (RR) could benefit from a deeper pullback. That would offer a higher probability setup and tighter risk management. However, for aggressive or short-term traders, the current level still offers a 1:1 RR, which, while not optimal, is acceptable under strict trade management and position sizing.
💎That said, there’s a critical invalidation point that must be respected. If the price breaks down and closes a full candle below the support zone, it would invalidate the entire bullish structure. In such a case, the only professional move is to stay out and wait for cleaner confirmation or a better-developed setup. There is no room for hope in trading—only strategy and discipline.
🎖Strive for consistency, not quick profits. Trade smart, Paradisers. This setup could be a gift for the patient and a trap for the impulsive. The key is always the same—discipline, patience, and strategic execution. Stay sharp, stay focused, and keep protecting your capital.
MyCryptoParadise
iFeel the success🌴

$REZ breakout alert!! AMEX:REZ breaking out of a strong downtrend!
After months of consolidation and lower highs, AMEX:REZ just flipped a major descending trendline resistance into support 💥
Now trading above it with strong momentum (+9.6%) and eyes set on the key targets:
📍 First Target: $0.0218
📍 Second Target: $0.0293
📍 Final Target Zone: $0.0405–$0.0407
This move confirms a shift in trend, and opportunities like these don’t come often.
Watch the retest zone closely and manage risk accordingly.
Let the breakout begin!
If you find this analysis helpful, please hit the like button to support my content! Share your thoughts in the comments, and feel free to request any specific chart analysis you’d like to see.
Happy Trading!!

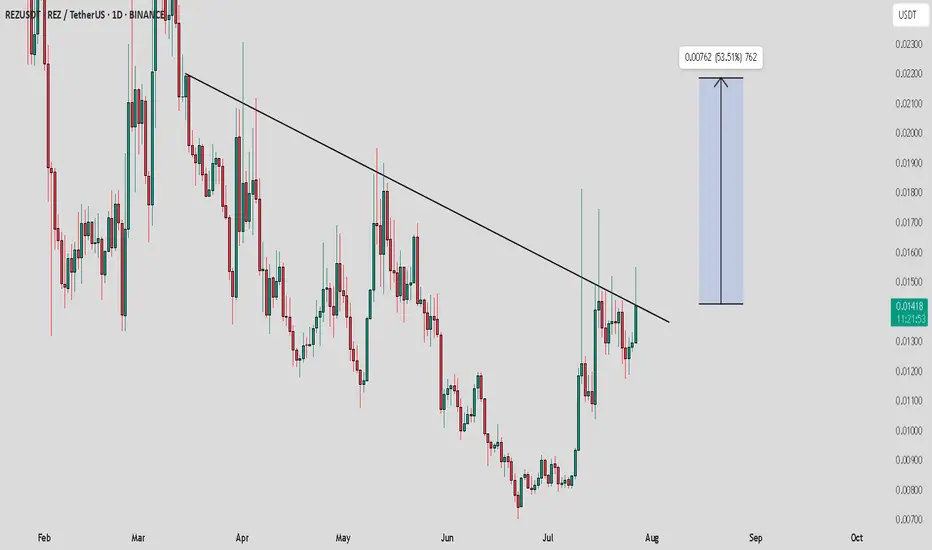
REZUSDT 1D AnalysisREZ ~ 1D Analysis
#REZ Buy after successfully penetrating this resistant line with a short -term target of at least 10%+ from here.

REZUSDTREZ ~ 1D
#REZ If you have Conviction on this coin,. Make a buy after successfully breaking through the resistance line of this descending pattern. with a short term target of at least 15%++

REZUSDT Rectangle Pattern!REZUSDT technical analysis update
REZ has formed a rectangle pattern and has been trading within this range for the last 20 days. The price is now moving towards the resistance of the box for a potential breakout. Once the breakout is confirmed, we can expect a strong bullish move in REZ.
Regards
Hexa
