XRP outlook amidst SEC vs Ripple updatesRipple (XRP) reclaimed a $0.6 level, a three-month high, amid speculations of a settlement between the US Securities and Exchange Commission (SEC) and Ripple.
According to some market observers, a secret meeting between SEC and Ripple scheduled for 18th July could end the long-running legal battle between the two parties.
However, a former SEC lawyer, Marc Fagel, downplayed the SEC-Ripple settlement rumors. He noted that the agency has held several such meetings with Ripple, none of which resulted in a conclusive endgame for the ongoing lawsuit.
Still, some market participants were convinced the massive XRP pump was linked to insider news of a potential settlement or positive news.
The upswing to $0.61 on the price chart marked a +7% daily gain and effectively reversed all losses made in Q2.
On a monthly adjusted basis, XRP was up 30% in July after rallying from $0.38 to above $0.6. This performance eclipsed the rest of the market, including Bitcoin (BTC), which was up only 3% in the first half of July.
If XRP convincingly reclaimed the 38.6% Fib level ($0.61) and eyes the next bullish target at 23.6% Fib ($0.66), an extra 7% gain would be likely.
However, XRP hit a key in a bearish order block, marked in red, which aligned with the 38.6% Fib level. Additionally, the RSI (Relative Strength Index) was in the overheated territory. This meant that buying was strong, but buyer exhaustion couldn’t be ruled out.
If so, a retracement to the 50% Fib level could offer side-lined speculators another market re-entry point to ride the rally to the 23.6% Fib level.
Meanwhile, traders went long on XRP since Monday, with the futures long positions increasing from 47% to 49%. The outcome of the July 18th meeting could determine whether the rally will be sustained or not.
Ripple

XRP Range Looks JuicyFairly low risk buying down here at the bottom of the long term range.
Even a move to the mean would be a 400% play, so the Risk:Reward is screaming BUY.

XRP Rockets 12%: Triangle Pattern and Futures Signal Bullish RunXRP, the native token of Ripple, has defied the recent market stagnation with a stellar 12% surge in the past 24 hours. This jump extends its weekly gains to a remarkable 40%, significantly outperforming other major cryptocurrencies. This unexpected bullish move is fueled by a combination of technical analysis and a surge in futures bets, suggesting a potential continuation of the uptrend in the coming weeks.
Bullish Triangle Hints at Breakout
Technical analysts are pointing to a significant development on XRP's long-term price charts – the formation of a bullish triangle pattern. This pattern typically emerges when the price action gets squeezed between converging trendlines, one acting as resistance and the other as support. As the price fluctuates within this narrowing range, a breakout is often anticipated, with the direction determined by which trendline is breached.
In XRP's case, the triangle pattern hints at a potential upside breakout. This is further bolstered by the recent price surge, which has pushed XRP towards the upper trendline of the triangle. If this resistance level is convincingly broken, analysts predict a significant price increase, with the height of the triangle often serving as a target for the breakout.
Rising Futures Open Interest Fuels Optimism
Adding fuel to the bullish fire is the noteworthy rise in open interest for XRP-tracked futures contracts. Open interest refers to the total number of outstanding futures contracts that have not yet been settled. A significant increase in open interest suggests a growing number of traders are placing bets on XRP's price movement, with a rising number typically indicating anticipation of volatility and potential price increases.
The near doubling of XRP futures open interest within the past week signifies a surge in investor confidence and a potential influx of capital into the XRP market. This aligns with the bullish triangle pattern, suggesting a confluence of technical and market sentiment that could propel XRP further upwards.
Is XRP Back on Track?
XRP's recent performance marks a significant turnaround after a prolonged period of lagging behind the broader market. This sluggishness stemmed partly from the ongoing legal battle between Ripple and the U.S. Securities and Exchange Commission (SEC) regarding the classification of XRP as a security. However, with some positive developments in the case, including a recent partial dismissal of the SEC's claims, investors appear to be regaining confidence in XRP's long-term prospects.
A Note of Caution
While the current momentum is undoubtedly positive for XRP, investors should exercise caution. The cryptocurrency market remains inherently volatile, and unforeseen events can trigger sudden price swings. As always, thorough research into XRP and the broader market environment is crucial before making any investment decisions.
Looking Ahead
The combined forces of the bullish triangle pattern and rising futures open interest paint a promising picture for XRP in the near future. If the anticipated breakout from the triangle materializes, XRP could experience a sustained price increase in the coming weeks. However, close monitoring of market developments and ongoing legal proceedings surrounding XRP remains essential for investors navigating this dynamic market.

XRP hits target of green symmetrical triangle breakout.Target hit!nHopefully now that this target has been hit xrp will still hold support on all the MAs it rose above to hit this target including the weekly 20ma not shown here since this is the 1 day time frame. Nice to see price action send a wick above the top yellow trendline. Once it starts to close a few consecutive daily candles above the top yellow trendline and perhaps 1 to 2 consecutive weekly candles above it then it should really be go time. May take a second to flip it to support though after such a big pump. *not financial advice*

XRP hits target of green symmetrical triangle breakout.Target hit!nHopefully now that this target has been hit xrp will still hold support on all the MAs it rose above to hit this target including the weekly 20ma not shown here since this is the 1 day time frame. Nice to see price action send a wick above the top yellow trendline. Once it starts to close a few consecutive daily candles above the top yellow trendline and perhaps 1 to 2 consecutive weekly candles above it then it should really be go time. May take a second to flip it to support though after such a big pump. *not financial advice*

Ripple - Looking To Buy Pullbacks In The Short TermH4 - Strong bullish momentum
Bullish trend pattern
Until the strong support zone holds I expect the price to move higher further after pullbacks.

XRP IS ALIVE AND SO AM I! ✨ Before I start I just want to give thanks to anyone who's here, I really appreciate it and it means a lot to have you guys here. The past few weeks for me have been a lot to say in the least, been dealing with a lot and I haven't had the opportunity or chance to post thanks to all that unfortunately.
✨ That being said, we're back at it, and I'm hoping I can get back to normal with things, still dealing with a lot of course but I owe it to you guys to get back to being active, even with everything going on so thanks all the more for being here.
✨ It's been a rough month for the market in general, especially crypto as interest rates and inflation have battered us. On top of that we saw Bitcoin fall in a dramatic move which prompted the fall of other crypto's and the market overall before rallying this week back above that $65,000 mark in a sign of resilience however here's where we'll have another challenge. Bitcoin's going to have to keep above $62,000 at the very least to keep bullish and it'll have to break $66,000 in order for traders to be able to target and look to new and all time highs.
✨ Now Bitcoin isn't XRP of course but we are well aware by now that Bitcoin's price can be a lead indicator, a strong indicator at the very least for crypto as it usually drags the market with it thus another reason for why we've seen this dramatic rally in XRP this week as XRP alongside the majority of the market followed Bitcoin up. So now the markets holding it's breath waiting to see what Bitcoin does.
✨ As for another catalyst to this XRP breakout I've added a quick chart below highlighting the intersection and where that breakout started, we can see how we exited the blue wedge and regained the 200 EMA which allowed for us to get this golden cross and that's helped XRP rally.
✨ Next to look to is our ascending channel on the 45 minute chart displayed below which makes it clear that we've got this ascending channel that's helped to further boost XRP's price and rally. I see us getting a big retracement and falling if we end up slipping out and below the ascending channel as we don't have any support points to look to on the local time frame aside from our horizontal levels by which we'd take 0.515 as one support level and presumptively the levels below should also act as supports unless broken.
✨ I'll leave the idea here so we don't make it too long but yeah, keep an eye out for what'll likely be a retracement or some sort of reversal after such a rally. As much as we love seeing prices move up we always have to consider the alternative and be aware that sometimes the market's going to want to relax and cool off a bit, especially after a rally. And if we do end up losing that ascending channel then please look to that 200 EMA for a bearish, bullish confirmation.
✨ I have to go right now but I wanted to get something quick out for you guys, again apologies for the delay, it's just been a rough few weeks but I'll be back and active with it so thanks for the support, especially to those that have been with me for so long, thank you my friends.
~ Rock '

Ripple (XRP) explodes with 10% daily growth: what's next?The crypto markets have overcome the selling pressure generated by Mt. Gox’s BTC transfers and the German government liquidating the seized assets. As a result, the Bitcoin price underwent a nice breakout and surged above the pivotal resistance zone, confirming a rise above the bearish captivity. With this, the traders appear to have jumped into a ‘FOMO’ well, as altcoins like Ripple (XRP) have gained immense attention.
The XRP price attempts to reclaim levels above the multi-year ascending trend line, which could spark a new upswing to $1. The RSI is breaking above the descending resistance after failing to do so several times previously. Furthermore, the MACD is positioned for a bullish crossover. As a result, if the price closes the weekly trade above the trend line, it may find support in the $0.65 to 0.7 range, where bears dominate.
As a result, the next few days could be crucial for the XRP price rally, as reclaiming $1 will be dependent on the weekly close.

Short Scalp XRP- XRP just had a HTF move to the Buyside Liquiditypool
- After a bigger move, we expect a retracement into 50% of the whole move.
- Overall we are bullish -> this is a short scalp

Ripple (XRPUSD): Important Structure Suggests More UpsideXRPUSD has already touched a new high, and we can now count five waves up from 38 cents. This is an important wave structure because it confirms the direction of the bull trend, indicating that more gains should follow. However, after every five-wave move, the market can enter a three-wave correction. Therefore, there may be some interesting support levels to be retested before the market can move even higher. The support for the next ABC drop can be around 48 cents up to 51 cents, which was also the support of the previous fourth wave.
Grega

XRP 16% PUMP To Next Resistance.XRP has broken out of a downtrend which started in March. We manage to close a weekly and daily candle above the POC.
There's a daily level we have failed to close above, over the past 3 days.
Flip that level into support and I would target $0.62 next 16%
Calculate Your Risk/Reward so you don't lose more than 1% of your account per trade.
Every day the charts provide new information. You have to adjust or get REKT.
Love it or hate it, hit that thumbs up and share your thoughts below!
This is not financial advice. This is for educational purposes only.

XRP D1After ~%20 rise in last day, now we're on correctional movement that price should fill some missed price gaps.

Understanding When XRP Will MOON - Part 3 MartyBoots here. I have been trading for 17 years and I am here to share my ideas with you to help the Crypto space. The Bull market is here
Even tho the bull market is here XRP has not mooned yet . The ALTCOIN market has just hit a critical level , when this happens XRP can start its move higher . This needs to be watched carefully.
XRP To The MOON
Please watch the video for more information

XRP is aiming for $10After more than six years of triangle in wave 4, ripple has started to move towards wave 5

XRP - Increase Possible after THIS LEVELXRP - it's possible that the bottom may be near, and we're going to use a technical indicator to look for the bottom.
It should be noted that I am NOT a fan of XRP BUT, I understand tat all coins are tradable despite whether or not I like them.
So let's dive into the SIGNS of the times:
Looking at the RSI below the chart, historically XRP bottoms are close when the RSI hit's the yellow line (34). It could trade lower for a few ore weeks to come, but ultimately this low RSI signals the bottom is either in or close.
It is also worth noting that the M-Pattern should be finished playing out, or close to finished:
Either way, if you MUST trade XRP, buy low and sell high. Bag holders gets burnt!
____________________________
BINANCE:XRPUSDT

XRPUSD BULLISH MONEY HEIST PLANMy Dear Robbers / Traders,
This is our master plan to Heist XRPUSD Market based on Thief Trading style Technical Analysis.. kindly please follow the plan I have mentioned in the chart focus on Long entry. Our target is Red Zone that is High risk Dangerous level, market is overbought / Consolidation / Trend Reversal at the level Bearish Robbers / Traders gain the strength. Be safe and be careful and Be rich.
Note: If you've got a lot of money you can get out right away otherwise you can join with a swing trade robbers and continue the heist plan, Use Trailing SL to protect our money.
Stop Loss : Recent Swing Low using 4h timeframe
Warning : Fundamental Analysis comes against our robbery plan. our plan will be ruined smash the Stop Loss. Don't Enter the market at the news update.
Loot and escape on the target 🎯 Swing Traders Plz Book the partial sum of money and wait for next breakout of dynamic level / Order block, Once it is cleared we can continue our heist plan to next new target.
support our robbery plan we can easily make money & take money 💰💵 Join your hands with US. Loot Everything in this market everyday make money easily with Thief Trading Style.

What comes down, must go upLook to the past for some patterns. It seems like when things get moving, they getting moving and fast. Like really really fast. Out of no where, we'll see a spike in dominance which leads to a pump price. With the Ripple case being speculated on coming to a close, things might just interesting.
Right on time with the charts ;)

XRP Price Surges: Critical Levels for Your Next TradeIn the latest 4-hour trading chart, BINANCE:XRPUSDT has shown a steady upward movement, closing at $0.4639. The 9 EMA and 20 EMA values indicate a bullish trend as they remain below the current price, signaling a potential continuation of upward momentum. Specifically, the 9 EMA has consistently risen from $0.4421 to $0.4517, while the 20 EMA has also increased from $0.4389 to $0.4451. These moving averages suggest that buying pressure is currently dominant in the market.
The Moving Average Convergence Divergence (MACD) further supports this bullish sentiment. MACD histogram values have shown a consistent increase, indicating a strengthening bullish momentum. The MACD line has risen above the signal line, reinforcing the positive trend. Recent MACD readings, with the MACD line at 0.0056 and the signal line at 0.0028, also highlight the growing buying interest.
Relative Strength Index (RSI) values have climbed from 57.13 to 67.29, approaching the overbought territory. This upward movement in the RSI reflects increasing buying pressure and suggests that the XRP price could continue to rise in the short term.
However, traders should remain cautious as XRP approaches significant resistance levels. The first resistance level at $0.4766 is crucial. If the price breaks above this level, the next resistance zones to watch are at $0.4778 and $0.48. These levels could act as potential exit points for long trades, especially if the RSI continues to climb towards overbought levels, indicating a possible price reversal.
On the downside, key support levels are found at $0.4331, $0.4146, and $0.3986. These levels offer potential entry points for long positions if the price retraces. A break below these support levels could signal a shift in momentum, making them critical areas to watch for potential short trades.
In conclusion, the technical indicators suggest a bullish outlook for XRP with potential upward movement towards the resistance levels. However, traders should monitor these key levels and indicators closely to make informed decisions.
Disclaimer: The information presented in this article is for informational and educational purposes only. The article does not constitute financial advice or advice of any kind. Ecoinimist is not responsible for any losses incurred as a result of the utilization of content, products, or services mentioned. Readers are advised to exercise caution before taking any action related to the company.

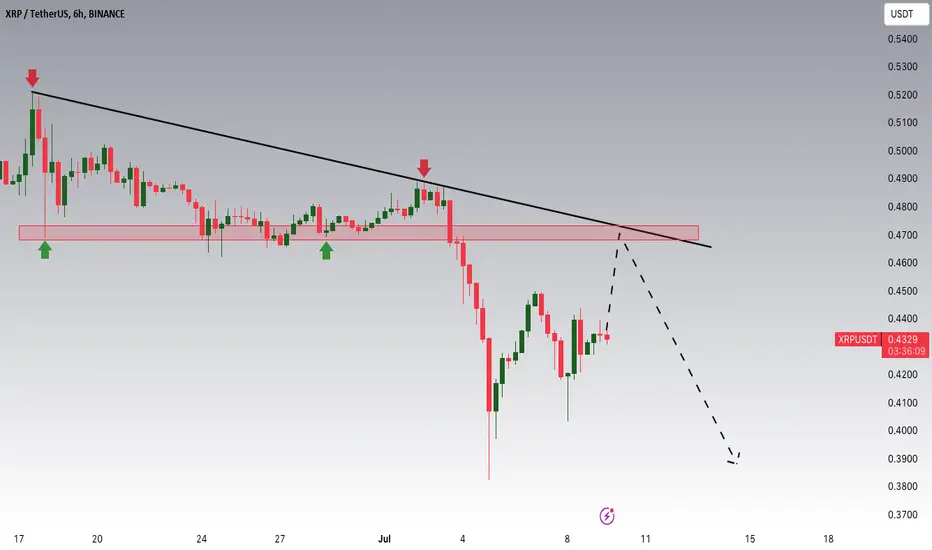
Ripple Is Approaching The Main TrendHey Traders, in today's trading session we are monitoring XRPUSDT for a selling opportunity around 0.47000 zone, Ripple is trading in a downtrend and currently is in a correction phase in which it is approaching the trend at 0.47000 support and resistance area.
Trade safe, Joe.
XRP Price Analysis: Support and Resistance LevelsXRP has recently experienced a significant decline, breaking below crucial support levels, notably $0.4240 and $0.4150. The price reached a low of $0.3826 before beginning a recovery wave. Despite this recovery, the price is still trading below the $0.4250 mark and the 100-hourly Simple Moving Average (SMA).
Key Levels to Watch
Support Levels:
Immediate support at $0.3900
Major support at $0.3850
Potential further support at $0.3620 if the price continues to decline
Resistance Levels:
Immediate resistance at $0.4050
Significant resistance at $0.4150 (aligned with the 50% Fibonacci retracement level and a key bearish trend line)
Additional resistance at $0.4220
Higher resistance at $0.4380 and $0.4450
Technical Indicators
Trend Line: A key bearish trend line is forming with resistance at $0.4150 on the hourly chart.
Fibonacci Retracement: The price faces resistance at the 50% Fib retracement level of the recent decline from $0.4467 to $0.3862.
Analysis
The XRP/USD pair is currently consolidating losses and may struggle to break above the $0.4150 resistance zone. The presence of a bearish trend line and the position of the 100-hourly SMA indicate a bearish sentiment in the market. The immediate recovery above $0.4050 may face strong resistance at $0.4150, beyond which $0.4220 acts as the next significant hurdle.
If the price fails to breach these resistance levels, it might witness another downward movement. Breaking below $0.3850 could lead to further declines, potentially targeting the $0.3620 support level.
Recommendation
Given the current market conditions and technical indicators, the following recommendations are made:
For Current Holders:
Monitor the $0.4050 and $0.4150 resistance levels closely. Consider reducing positions if the price fails to break above these levels and shows signs of further weakness.
Set stop-loss orders below the $0.3850 level to mitigate potential losses in case of a continued decline.
For Potential Investors:
Exercise caution and wait for a clear breakout above the $0.4150 resistance before considering new positions. A sustained move above this level could signal a potential recovery towards $0.4220 and higher.
Alternatively, look for buying opportunities if the price approaches the $0.3620 support level, provided there are signs of stabilization and reversal from that point.
For Short-Term Traders:
Consider shorting positions if the price struggles to break above $0.4150 with a target around $0.3850 and a stop-loss just above the trend line resistance.
Be prepared to switch to long positions if a clear breakout above $0.4150 occurs, targeting the $0.4220 and $0.4380 levels.
Conclusion

XRPUSD - Still BullishI think XRPUSD will break out bullishly of this triangle drawn and form a large W pattern with the previous 3 dollar high
I want to see a rally like the one seen in 2017
Daily chart but better to view this as a longer term buy.

XRP Investment Strategy: Capitalizing on a Bullish TrendXRP is currently experiencing a bullish trend, trading above $0.4720 and the 100-hourly Simple Moving Average. There is a connecting bullish trend line with support at $0.4760, indicating a potential upside break if it can surpass the $0.4840 resistance zone.
If successful, the price may target the $0.4880 and $0.5050 resistance levels, with further potential to reach $0.5120 and beyond. However, if XRP fails to clear the $0.4840 resistance, it might decline towards the $0.4765 and $0.4740 support levels, potentially falling to $0.4640 if these supports fail.
Given the current bullish trend and potential for upside movement, consider the following investment strategy:
Entry Point: Buy XRP if it closes above the $0.4840 resistance level, indicating a potential breakout and continuation of the bullish trend.
Short-Term Targets: Aim for profit-taking at $0.4880 and $0.5050, with a possibility to extend to $0.5120 and $0.5250 if bullish momentum continues.
Stop-Loss: Place a stop-loss order below the $0.4740 support level to mitigate risk in case of a downside break.
Monitoring: Keep an eye on the $0.4840 resistance level. If XRP fails to break this level and shows signs of weakness, consider a more cautious approach or partial exit to protect your investment.
This strategy balances the potential for gains with risk management, ensuring you can capitalize on the bullish trend while minimizing losses in case of a reversal.

SHIBAINU - Starting a new Bullish Move ? (READ THE CAPTION)By examining the #ShibaInu chart on the weekly timeframe (logarithmic), we observe that after an attractive growth, this cryptocurrency has again undergone a correction. We should soon expect the end of this correction and the beginning of the next bullish wave. Keep an eye on these prices: 0.00001542, 0.00001385, and 0.00001248. The new wave will likely start its next move after correcting to 1542. (This analysis will be updated)
Please support me with your likes and comments to motivate me to share more analysis with you and share your opinion about the possible trend of this chart with me !
Best Regards , Arman Shaban
