$XRP All Tie High After Shallow Pullback?CRYPTOCAP:XRP had a fantastic week smashing all resistances. I am looking for a shallow pull back to test the High Volume Node support at $2.7 at the .236 Fibonacci retracement before continuing to challenge the all time high.
Wave (3) of a motif wave appears complete adding confluence to a shallow retracement for wave (4).
Daily RSI is extremely overbought.
Safe trading
Ripple

XRP SHOOTS UP TO $3! 🌠 Wow, we'll, we've done it. We've hit $3 once again. Before I start this idea just want to give my thanks for tuning in, appreciate it.
🌠 This month has been pretty incredible for Ripple to say in the least from the BNY-Mellon Custodian Deal to Trump's Media company filing for a crypto Blue Chip ETF of which included the likes of XRP. With all the news and positive sentiment around XRP and Bitcoin which itself has hit a new All-Time-High hitting $123,000! Below I'll add a Bitcoin chart for reference:
🌠 To say in the least it's been a golden month for Crypto and Digital Assets. And one important thing to note is that as of today the Fedwire Funds Service is set to go live with the ISO 20022 standard starting July 14, 2025. The implementation will replace Fedwire's dated (FAIM) format with the ISO 20022 message format with the change happening over a single day.
🌠 For those that don't know ISO 20022 is a global messaging standard for financial transactions meant to reduce cost and fraud alongside automate transactions and reduce transactional costs. What this means for XRP is that it could become a much bigger player in cross-border payments now through RippleNet as XRP is one of the selected assets for the ISO 20022 standard.
🌠 ISO 20022 and global institutions will start utilizing XRP and it's ability to process transactions seemingly instantly and efficiently while significantly cutting down on cross border and transaction costs making it a considerably solution for banks and financial institutions. After all, if your objective is to make money, and you can make more money while cutting down on costs and making transactions, record keeping much simpler, then why not? Especially in an age where everyday things are continuously advancing and improving nobody want's to be left behind. Especially the big financial players.
🌠 Curious to see if prices can hold and keep pushing but just going off technical, we already know $3 is a tough point. At $3 just over 95% of XRP holders are in profit which makes a good reason for many to sell and take profit but with all the news and ISO now really kicking in we may not see as much selling, especially as holders are more confident and less likely to be swayed in letting go of their XRP. So it'll definitely be interesting to see how things play out.
🌠 Main thing will be Bitcoin, even if XRP holders hold I can't guarantee the same for Bitcoin, especially should it start to reverse, we know how financial institutions play taking advantage of the news. Just be cautious and set some price level alerts whether your trading XRP or Bitcoin.
🌠 In the long run things look very good regardless of what happens in the next week or two so keep that in mind. I'll be watching XRP to see if we can continue and break $3 but in my experience, with these impulse waves we usually see a big move up followed by some retracement as traders look to test support and liquidity so the waters may turn choppy but again like I said, we're here focused on the long term, whatever happens happens. We'll still be here for that but nonetheless the main objective is the longterm. $3 may seem like a lot but it's nothing compared to what XRP has in store.
🌠 This week is also 'Crypto Week' for lawmakers in DC as U.S lawmakers get ready to potentially pass changes in the regulatory setting when could push even more institutional demand further adding to the hype and optimism the crypto space has been running with as of lately.
🌠 Have to run but thanks as always for tuning in, really appreciate it and hope everyone is doing well! thanks as always and all the best till next. Feel free to keep posted and follow for more as always.
Best regards,
~ Rock '

"XRP/USD: Bullish Raid Alert! Ride or Escape Fast!"🚨 XRP/USD HEIST ALERT: Bullish Loot Grab Before the Escape! (Thief Trading Style) 🚨
🌟 Greetings, Market Pirates & Profit Raiders! 🌟
(Hola! Oi! Bonjour! Hallo! Marhaba!)
🔥 Thief Trading Strategy Activated! 🔥
Based on ruthless technical + fundamental analysis, here’s how we SWIPE THE LOOT from XRP/USD (Ripple vs. Dollar). Follow the chart’s Long Entry blueprint—our target is the high-risk YELLOW ATR ZONE (overbought, consolidation, potential reversal). Beware of traps! Bears and cops lurk here, but we strike smart.
🏴☠️ ENTRY:
"Vault’s cracked—bullish loot is FREE GAME!"
Buy Limit Orders preferred (15-30 min timeframe near swing lows/highs).
Aggressive? Swipe instantly—just mind the cops (liquidity traps).
🛑 STOP LOSS (Save Your Loot!):
Swing Thieves: 4H recent wick low ($2.1500).
Risk Tactics: Adjust SL based on your trade size, orders, and guts.
🎯 TARGETS:
Main Take: $2.5400 (or escape earlier if momentum fades).
Scalpers: Longs ONLY! Trail your SL—no greedy holds!
💣 KEY DRIVERS (Why This Heist Works):
Bullish momentum brewing (check fundamentals, COT, on-chain data 👉go ahead to klick 🔗).
NEWS ALERT: Avoid fresh trades during high-impact news—protect open positions with trailing stops!
💥 BOOST THIS HEIST!
Hit 👍 LIKE, 🔔 FOLLOW, and 💬 COMMENT to fuel our next robbery plan. Together, we steal the market’s cash—EVERY. SINGLE. DAY.
📢 Final Warning: Markets shift FAST. Stay sharp, adapt, and CASH OUT BEFORE THE COPS ARRIVE.
🤑 Stay tuned—more heists incoming! 🐱👤🚀

Feeling the waves (Ripple $XRP)Setup
The price has been consolidating since the explosive move from ~50c to $3 last year. There has been a wide $1 price range between $2 and $3. A failed breakdown below a still rising 30-week moving average and new 4-month high suggest underlying bullishness.
Signal
Should there be any follow-through to last week's big up-move, then any pullback to the golden pocket between the 50% and 61.8% Fibonacci retracement levels could trigger a rebound.

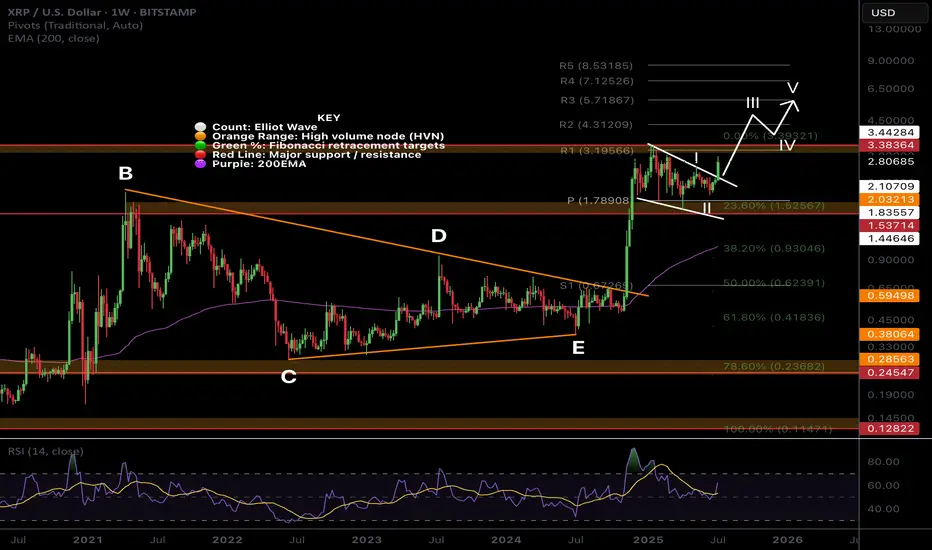
$XRP Macro Tiangle Final Thrust ContinuationCRYPTOCAP:XRP completed a macro triangle pattern last year. Triangles proceed a terminal motif wave which already completed a wave 3.
Wave (3) of (5) is underway with a terminal target around $5.7 after price broke out of the pennant / wedge pattern.
Weekly RSI confirmed bullish divergence.
Safe trading
XRP SKYROCKETS AND BREAKSOUT PRICE RANGE! ⭐️In a pretty crazy twist and turn of events we're seeing XRP absolutely skyrocket and breakout with this morning's announcement on behalf of President Donald Trump with his Truth Social media platform announcing it had filed for a Crypto Blue Chip ETF with the SEC.
⭐️ The Blue Chip ETF proposal includes 70% holdings in Bitcoin, 15% in Ethereum, 8% in Solana alongside 5% in XRP and 2% in CRO which is from Crypto.com. This notably has led to the breakout with XRP that we're currently seeing with the crypto already up 12% since the day started and news broke out. It's still early morning too so we'll see how the market reacts as the day continues and traders wake up to the news.
⭐️The past few weeks have seen XRP stuck within this horizontal channel and constant tug a war between $1.90-$2.30 with this breakout and the last week signaling bullish optimism towards the crypto alongside news of the BNY-Mellon deal with BNY Mellon set to become the Custodian for Ripple's RLUSD Stable coin. And for those that don't know BNY-Mellon is America's oldest bank having been founded in 1784 and with an estimated $45.7 trillion in assets under custody and/or administration. To say in the least this is a big step for Ripple showing more institutional growth.
⭐️To note also is this as I'll show below on Bitcoin's chart:
⭐️ It's crazy to say but we've just seen Bitcoin form a new All-Time High at $118,100 alongside the Crypto Blue Chip announcement, more than likely with investors and institutions flocking to buy in before the ETF get's approved and likely in anticipation of a bullish shift.
⭐️ We've already seen the crypto space weather the storm through the last few weeks and months with everything that's happened from global escalations to all the new bills and changes in the government. Through thick and thin the crypto space has proved resilient and investors are taking note.
⭐️ Have to run for work but wanted to get a quick idea out there, especially since this news just broke out. Some pretty crazy stuff and I'll be watching these levels here to see if things continue or if the news has simply given us a breakout, regardless it's a win-win with all this news only pushing the directive and story towards crypto and digital assets for many. I'll attach a link below to an article on the Blue-Chip ETF for reference as well.
⭐️ Thanks so much as always and all the best till then, feel free to keep posted for more updates and ideas as we continue on this journey we've been riding the last few years already. It's been a lot but it's got much more to go. Let's keep at it and keep our heads up.
⭐️ Reference on Crypto Blue Chip ETF:
apnews.com
Best regards,
~ Rock'

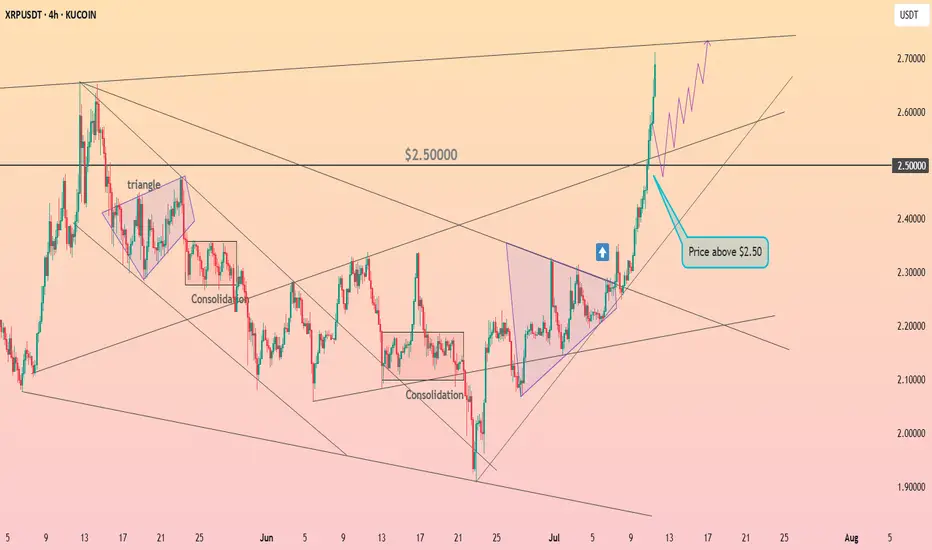
HolderStat┆XRPUSD above the $2.5KUCOIN:XRPUSDT has rallied sharply, breaking above the key $2.50 resistance following multiple consolidation and triangle patterns. Momentum remains strong, and price structure supports continuation toward the $2.75 resistance zone.
ADA/USDT : ADA Rally in Motion – Over 20% Gain and More to Come?By analyzing the Cardano (ADA) chart on the 3-day timeframe, we can see that after revisiting the $0.57 zone, the price once again followed the previous analysis and encountered strong buying pressure—rallying up to $0.61 so far.
The return from the previous entry has now exceeded 8%, and the overall gain from the full move stands above 20%.
The next bullish targets are $0.76, $0.93, $1.05, and $1.33.
(A deeper and more detailed analysis is recommended for long-term investment decisions.)
THE MAIN ANALYSIS :

XRP/USDT Monthly Chart: History Repeating Itself?Hey traders! Let’s dive into this monthly XRP/USDT chart. I’ll be honest — I’m skeptical about this outcome, but let’s break it down because it could actually happen!
The chart screams déjà vu, with XRP’s price action mirroring the 2014-2018 period. Back then, XRP broke out from its 2014 ATH in 2017, leading to a massive rally. Fast forward to now, and we’re seeing a similar setup, but with a twist. XRP is struggling to break through the 2018 ATH resistance zone around $3.31, which reminds me of the Breakout Consolidation phase we saw in 2017. Historically, this consolidation led to a breakout, and the chart hints at a potential repeat!
If XRP breaks out soon, we could see a parabolic move, potentially targeting much higher levels. However, the current resistance is a tough hurdle, and if it fails, we might see a pullback to lower supports.
Key Levels to Watch:
Resistance: $3.31 (2018 ATH)
Support: $1.643 (previous consolidation low)
Breakout Target: To be determined (potentially parabolic)
Breakdown Risk: $0.650
I’m not fully convinced, but the setup is intriguing — could this be XRP’s moment to shine? What do you think? Let’s discuss below!

XRP - Wait For It!Hello TradingView Family / Fellow Traders. This is Richard, also known as theSignalyst.
📈 Is history repeating itself? 🤔
XRP is now back at the $1.75–$2 support zone and forming a fresh inverse head and shoulders pattern.
As long as this support holds, we’ll be on the lookout for new long opportunities. 🟢
For the bulls to take over in the short term, a break above the green neckline is needed.
And for long-term control, a break above the red structure is essential. 🔺
For now, we wait patiently! ⏳
📚 Always follow your trading plan regarding entry, risk management, and trade management.
Good luck!
All Strategies Are Good; If Managed Properly!
~Rich

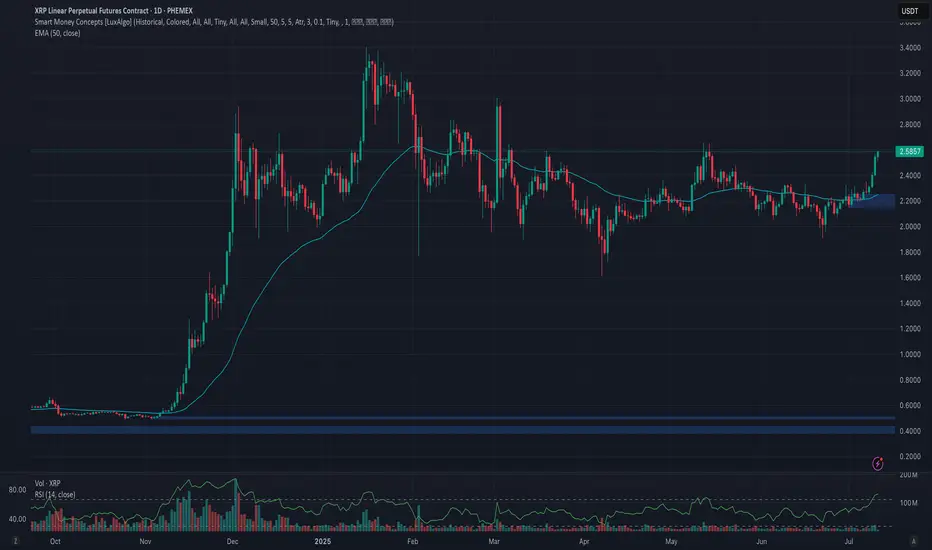
Phemex Analysis #96: Pro Tips for Trading Ripple (XRP)Since our previous analysis on XRP , Ripple’s native token [ PHEMEX:XRPUSDT.P ] successfully broke above the significant $2.45 resistance level, subsequently establishing a higher low around $1.90 on June 22nd. Encouragingly, XRP has surged 10% over the past two days, once again decisively breaking the $2.45 barrier, and is currently trading at around $2.57.
Given XRP’s recent bullish performance and evolving market dynamics, let's explore several potential scenarios that traders should closely monitor.
Possible Scenarios
1. Continued Bullish Momentum (Breakout Scenario)
If XRP maintains its current bullish strength, it’s likely to break above its recent high at $2.65. Such a breakout would signal strong buying interest and may push the price further toward the resistance zones at $2.96 and $3.12.
Pro Tips:
Entry Strategy: Consider entering or scaling positions upon confirmation of a breakout above $2.65, supported by increased trading volume.
Profit-Taking: Strategically take partial profits as XRP approaches the next resistance levels at $2.96 and especially $3.12 to secure gains effectively.
2. Rejected by Strong Resistance Levels (Pullback Scenario)
While the recent rally is promising, broader market conditions currently exhibit limited bullish momentum, indicating caution. XRP may face strong selling pressure at resistance levels like $3.12, leading to a potential price rejection.
In this scenario, XRP could retreat to establish a higher low above the important support at $2.15.
Pro Tips:
Buying Opportunities: Long-term investors might consider gradually accumulating positions if XRP forms a confirmed higher low above the critical support zone around $2.15.
Patience: Wait for clear stabilization signs at support before increasing positions, rather than rushing entries during active retracements.
3. Consolidation within Defined Range (Neutral Scenario)
XRP might enter a period of price consolidation, oscillating between support at $1.91 and resistance at $2.65. This scenario is common when market sentiment is uncertain or awaiting clearer directional cues.
Pro Tips:
Grid Trading Strategy: Utilize grid trading bots to profit systematically from predictable range-bound price movements. Initiate Long Grid bots near support at $1.91 and Short Grid bots near resistance around $2.65.
Stop-Loss: Always set clear stop-losses outside the consolidation range, ensuring protection against unexpected breakouts or breakdowns.
Conclusion
Ripple (XRP) currently offers compelling trade opportunities across different market scenarios. By closely monitoring bullish breakout signals above $2.65, potential pullbacks toward $2.15, and consolidation opportunities within $1.91–$2.65, traders can strategically position themselves to capitalize effectively while managing risks prudently. Always maintain a disciplined approach, pay close attention to broader market trends, and carefully execute trades based on well-defined scenarios.
🔥 Tips:
Armed Your Trading Arsenal with advanced tools like multiple watchlists, basket orders, and real-time strategy adjustments at Phemex. Our USDT-based scaled orders give you precise control over your risk, while iceberg orders provide stealthy execution.
Disclaimer: This is NOT financial or investment advice. Please conduct your own research (DYOR). Phemex is not responsible, directly or indirectly, for any damage or loss incurred or claimed to be caused by or in association with the use of or reliance on any content, goods, or services mentioned in this article.
XRP - Time to buy again! (Update)It seems the price is forming a head and shoulders pattern, which, if correct, suggests a good price increase in the coming days. However, we should wait for the pattern to fully complete.
Best regards CobraVanguard.💚

Congress passes H.R 1 into law. About the new bill.🔵 In what's been an eventful last few weeks congress passed H.R 1 which is essentially Trump's 900 page mega bill Act. Both Democrats and Republicans ultimately united against each other over the bill with Vice President Vance casing the tiebreaking vote giving Senate Republican's the large legislative victory.
🔵 To note is that independent-minded Republican Lisa Murkowski, senator of Alaska had some concerns with the bill before GOP negotiators we're able to acquire her vote for the 50-50 votes. Murkowski's primary issue was with the legislation's changes to Medicaid and federal food assistance funding which she was concerned would hurt her home state understandably. Republican's originally tried to sway her vote by adding language to shield Alaska from the full effect of the legislation's Medicaid and SNAP cuts.
🔵 Parliament opposed that as it violated the Byrd Rule which is there to determine the legislation that can go into a budget reconciliation package as well as passing with only GOP votes. Least to say the amendment was reworked many times in order for the waivers for the SNAP funding cuts to apply more broadly than just Alaska and Hawaii. Parliament rejected the prior amendment and language which targeted just the two states understandably.
🔵 With the rework the new SNAP provisions are planned to reduce food assistance funding more slowly in about 10 states with the number ultimately being decided by a formula and based on the error rate in delivering food assistance benefits in a year. After an arduous process the amendment was passed and Republican's secured the vote with Murkowski saying it was an agonizing process.
🔵 When speaking with reporters afterwards Murkowski noted that the process was stressful with them operating under an artificial timeline in reference to the pressure Trump put on the Senate to pass the bill.
🔵 Her concern was as follows: “Rather than taking the deliberative approach to good legislating, we rushed to get a product out. This is important. I want to make sure that we’re able to keep in place the tax cuts from the 2017 Jobs Act,” said Murkowski when asked about her support for the bill and why it was hard for her to come around to giving her vote.
🔵 “I struggled mightily with the impact on the most vulnerable in this country when you look to the Medicaid and the SNAP provisions,” said Murkowski. This point highlights just how the effort to push the bill through was met with haste and pressure notably.
🔵 The bill itself is projected to add $2.8 trillion to the federal deficit by 2034. Main reason for that would be thanks to a reduction in revenues as well as interest cost which could have the deficit rise by a potential $5 trillion if some temporary provisions become permanent. Interest payments on the national debt are also expected to increase significantly by 2034.
🔵It should be noted that these numbers and estimates are based on a "current law" baseline and are largely thanks to tax cuts in the bill with Economist having differing opinions on the economic impact of the bill. Time will tell us how estimates go but least to say this is a large turnaround from what many we're expecting with even DOGE's Elon Musk opposing the Bill and forming a new party in strong opposition.
🔵 The tax and spending bill will see spending increase and phase in a cut to Medicaid of an estimated $1 trillion over the next decade with the CBO projecting roughly 11.8 million more American's t hat would become uninsured within the next 10 years compared to the current law. This could lead to many losing healthcare services due to medical cost with states as well likely needing to adjust their own programs and having to take on a larger share of the cost whether that means reducing services or even closing some facilities.
🔵 The bill has many key changes but in summary it solidifies many tax breaks from Trump's first term with an estimated $4.5 trillion in tax cuts alongside tax deductions on tips, overtime and auto loans with deductions for adults that make under $75,000 and a boost to the child tax credit from $2,000 to $2,200 though millions of families at lower income levels would still not receive the full credit as one of the credit's, requirements is a minimum earned income of $2,500. In 2022 alone an estimated 18 million children under age 17 (26 of all children) were ineligible for the full child Tax credit because the family income was not high enough as reported by Columbia University's Center on Poverty and Social Policy.
🔵 To say in the least the new bill has many implications for the country and the next few months and years will definitely represent those changes and how the country shifts and adjusts to this with many having differing opinions understandably. I'll definitely keep you guys posted through it all but definitely a lot to see so much happen so quick and only time will tell and show us just how things play out simply put. The market itself is still continuing within this ascending channel, especially since we got that convergence with the 200 EMA and broke that $6,130 resistance. $6,300 is what I'm expecting resistance to hit the strongest so definitely gonna keep an eye there as traders process the news and changes.
🔵 Have to go but grateful as always for the support, definitely a long idea here but wanted to focus on some important points though the bill itself has so many changes it's hard to go over every one but you get the point. This is a big changes and we'll definitely see things shift a lot over the next few months and years and as always we'll keep posted with things. Thanks as always and all the best.
Best regards,
~ Rock'

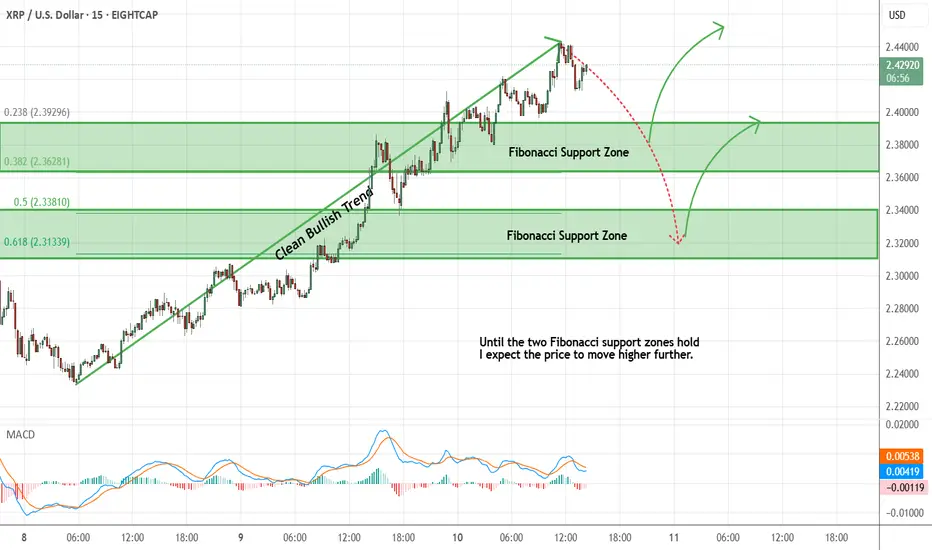
Ripple - Expecting Bullish Continuation In The Short TermH4 - We have a clean bullish trend with the price creating a series of higher highs, higher lows structure.
This strong bullish momentum is followed by a pullback.
No opposite signs.
Until the two Fibonacci support zones hold I expect the price to move higher further.
If you enjoy this idea, don’t forget to LIKE 👍, FOLLOW ✅, SHARE 🙌, and COMMENT ✍! Drop your thoughts and charts below to keep the discussion going. Your support helps keep this content free and reach more people! 🚀
--------------------------------------------------------------------------------------------------------------------
HolderStat┆XRPUSD got out of the consolidation areaBYBIT:XRPUSDT is building strength within a wide consolidation range after multiple triangle breakouts. Price is eyeing the 2.60 level, and structure suggests bulls are preparing for the next push.

BTC / ETH / SOL / XRP / HYPE: Potential Trend StructuresIn this video, I share my current daily and weekly analysis on the trend structures of BTC, ETH, SOL, XRP, and HYPE, highlighting key support and resistance zones to watch in the coming sessions.
Charts featured in the video:
BTC
ETH
SOL
XRP
HYPE
Thank you for your attention and I wish you successful trading decisions!
If you’d like to hear my take on any other coin you’re tracking feel free to ask in the comments (just don’t forget to boost the idea first 😉).

XRPUSDT BINANCE:XRPUSDT Price broke above the downtrend line but faced resistance at 2.2770 dollars and started correcting. Key supports are at 2.1900 and 2.0800 dollars. If it bounces, resistances to watch are 2.2770, 2.3600, and 2.4620 dollars. Price is currently between key levels.
Key Levels:
Support: 2.1900 – 2.0800
Resistance: 2.2770 – 2.3600 – 2.4620
⚠️Contorl Risk management for trades.

$XRP - Falling Wedge Breakout is CookingRipple is forming a simple yet perfect setup
There is a strong horizontal support level of $2.11 that was established back in December of 2024 and has held the price perfectly (with only one breakdown) since then. Moreover, at that time a massive Falling Wedge started forming and is still doing it up to this day.
Talking about resistances, there is a $2.45 one. Not very strong, but solid enough to form a decent horizontal channel within which the price moves.
So, as the result we have the following structure: CRYPTOCAP:XRP has been consolidating above strong support for 6 months already and formed a pattern that suggest upcoming upward movement. The perfect entry spot in LONG will be at the breakout&retest of the both $2.45 resistance and Falling Wedge resistance (they perfectly correlate) .
Target zone of $3.5 - $4 can be reached within the next 3 - 5 months.

TON/USDT : TON at a Key Breakout Level – Will $3 Hold or Break?By analyzing the TON Coin chart on the 3-day timeframe, we can see that after climbing back to the $3 level, this zone has now turned into a key resistance area. The most important condition for further bullish movement is a strong breakout and confirmation above $3. If that scenario plays out, the next potential upside targets are $3.15, $3.63, $4.20, and $4.68.
⚠️ (A deeper and more detailed analysis is recommended for long-term investment considerations.)
Please support me with your likes and comments to motivate me to share more analysis with you and share your opinion about the possible trend of this chart with me !
Best Regards , Arman Shaban

HolderStat┆XRPUSD targeting $2.4BINANCE:XRPUSDT is printing repeated consolidation zones and ascending structures. Price is currently rebounding above 2.20, eyeing a breakout toward 2.40. The bullish momentum persists with higher lows and breakout setups.

XRP: A Trader's Gambit or an Investor's FortuneXRP at the Crossroads: A Trader's Gambit or an Investor's Fortune?
The digital asset XRP currently finds itself in a fascinating and precarious position, presenting a narrative so divided it could belong to two entirely different assets. For the short-term trader, the charts are painting a picture of tension and potential reversal, a technical puzzle where a wrong move could be costly. For the long-term investor, the horizon holds the promise of a revolutionary technology poised to disrupt a trillion-dollar industry, with price targets that seem almost unimaginable from today's standpoint. This analysis delves into this profound dichotomy, exploring the immediate bearish signals that tempt traders to short, while simultaneously mapping out the ambitious, utility-driven path that could lead XRP to astronomical new heights.
The Short-Term Squeeze: A Technical Tightrope Walk
Observing XRP's recent price action is like watching a high-stakes chess match. The token has demonstrated a textbook reaction to a critical trendline, a move that likely ensnared traders who were too quick to bet on a price collapse. By bouncing precisely where technical theory suggested it might, it "trapped" these early sellers, forcing them to reconsider their positions as the price stabilized and began to creep upward.
Following this maneuver, the price has embarked on a cautious ascent from the $2.20 support zone. As of early July, XRP has managed to climb above the $2.2320 mark and is holding its ground above the 100-hourly Simple Moving Average, both of which are constructive short-term signals. The immediate focus has now shifted to a key resistance level at $2.285. A decisive break above this ceiling could signal that the bulls have taken control, potentially triggering a new wave of buying pressure.
However, a significant hurdle lies in wait. On the hourly chart, a short-term contracting triangle has formed, with its upper boundary creating firm resistance at the $2.280 level. Such patterns are known to be harbingers of volatility; they represent a period of consolidation and coiling energy before the price makes a powerful move in one direction. While a breakout to the upside is possible, the bearish case remains equally compelling.
This bearish outlook is centered on a previously marked supply zone that the price is now approaching. A supply zone is an area on the chart where a glut of sell orders is historically clustered. If the price pushes into this zone without first building a stronger foundation of support by drawing in buying interest (grabbing liquidity) from lower levels, it risks hitting a brick wall. The selling pressure could overwhelm the buying momentum, leading to a swift and strong rejection. For traders anticipating this outcome, it presents a prime opportunity to initiate a short position, betting on a significant price decline. The level of $2.28 is therefore not just a resistance point; it's a critical battleground that will likely dictate the next major directional move.
The Long-Term Vision: The $35 Moonshot Fueled by Global Remittances
To truly understand the fervent belief held by long-term XRP holders, one must look beyond the flickering candles of the hourly charts and focus on the asset's fundamental purpose. The most powerful bullish argument for XRP is not based on technical patterns, but on its potential to fundamentally reshape the global remittance market.
The remittance industry—the process of individuals sending money across borders to their families—is a colossal and ever-growing sector of the global economy. Projections indicate that this market will swell from nearly $800 billion to over $1.06 trillion by 2029. For decades, this system has been notoriously inefficient, characterized by exorbitant fees that eat into the funds sent home and settlement times that can stretch for days, leaving families waiting for critical support.
This is the problem that Ripple, the technology company behind XRP, was designed to solve. By utilizing XRP as a neutral bridge asset, Ripple's payment network can facilitate cross-border transactions in a matter of seconds, not days. The cost of these transactions is a tiny fraction of what traditional banking intermediaries charge. This value proposition of speed and savings is not merely theoretical; Ripple has been actively forging partnerships to implement this technology in key remittance corridors, including those connecting to Mexico, the Philippines, Brazil, and nations in the Middle East.
The audacious price prediction of $35 per XRP stems from a model that quantifies this potential. The logic unfolds as follows: if XRP were to successfully capture a significant portion, say 25%, of the projected $1.06 trillion remittance market by 2029, the network's intrinsic value would be immense. Applying a valuation multiple similar to those of established payment processing giants, the network could be valued at over $500 billion. With a circulating supply of approximately 60 billion tokens, a simple calculation yields a fundamental value of around $8.90 per XRP.
However, the cryptocurrency market is driven by more than just underlying utility; it is heavily influenced by demand, speculation, and investor sentiment. The model accounts for this by applying a "demand premium." If widespread adoption and recognition of XRP's role create a surge in demand, this could act as a multiplier on its fundamental value. A 4x demand premium, a figure not uncommon during crypto bull markets, applied to the $8.90 base valuation, is what brings the target to an eye-watering $35.56. This forecast, while undeniably ambitious, is anchored in the tangible prospect of solving a multi-trillion-dollar real-world problem.
Bridging the Gap: Catalysts for a New Era
The journey from a price of around $2.22 to a potential $35 is long, and its success hinges on several critical factors. A major cloud that long hung over XRP was its legal battle in the United States, which created uncertainty and stifled institutional adoption. However, significant legal victories have provided much-needed regulatory clarity, affirming that XRP itself is not inherently a security. This has been a pivotal de-risking event, opening the doors for financial institutions to begin integrating and utilizing the asset with newfound confidence.
The next major potential catalyst on the horizon is the approval of a spot XRP Exchange-Traded Fund (ETF). Following the successful launch of ETFs for other major cryptocurrencies, many in the industry see an XRP ETF as a logical next step. Such a product would be a game-changer, providing a regulated and easily accessible bridge for a vast pool of capital from traditional finance to flow into the XRP market. It would allow pension funds, asset managers, and retail investors to gain exposure to XRP through their standard brokerage accounts, potentially triggering a massive wave of demand.
Of course, the path is not without its challenges. XRP operates in a competitive environment, with other blockchain projects and even modernizing traditional systems like SWIFT vying for a piece of the cross-border payments pie. Continued innovation, network growth, and the expansion of strategic partnerships will be paramount to securing its market position.
Conclusion: A Dichotomy of Destiny
In its current state, XRP embodies the dual nature of the cryptocurrency market. It is at once a playground for nimble traders, who see the immediate risks and rewards in its tight price consolidation, and a beacon for long-term visionaries, who see the blueprint for a future global financial standard. The bearish case for a short-term rejection from the $2.28 supply zone is technically sound and warrants caution. A failure to break through this level could easily send the price back down to retest lower supports.
Simultaneously, the long-term bullish thesis is one of the most compelling in the entire digital asset space. It is not built on hype alone, but on a clear and demonstrable utility aimed at a vast and inefficient market. The prospect of a $35 XRP is a testament to this potential.
Ultimately, the decision of whether to view XRP as a short-term trade or a long-term investment is a reflection of one's own timeline, risk tolerance, and belief in its underlying technology. XRP is at a critical inflection point, and whether it succumbs to short-term pressures or breaks free to pursue its grander ambitions will be a defining story in the continuing evolution of finance.

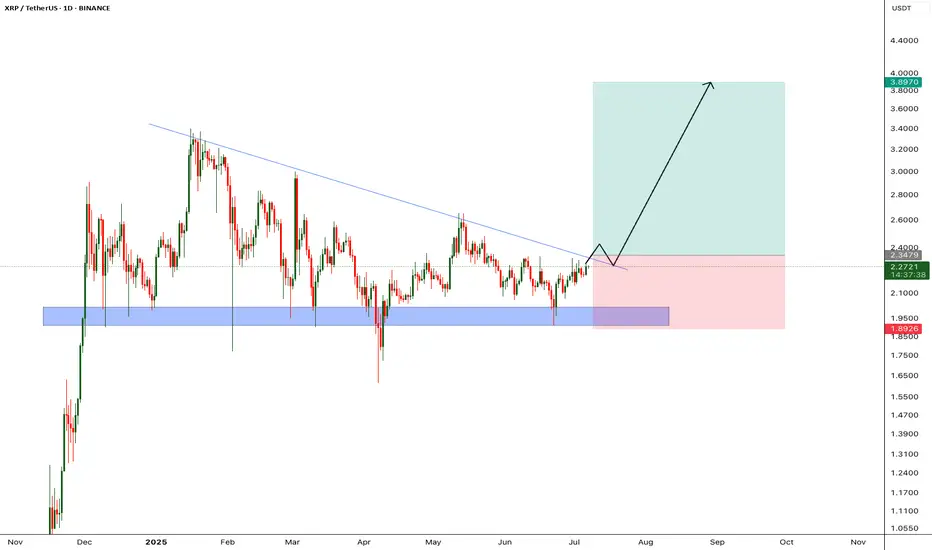
XRP - Huge breakout incomingXRP price is retesting it's descending trendline, in the past price got rejected from this trendline multple times, however im expecting price to breakout from this trendline since we almost at the last 2 quarters of bull run.
We will enter the trade after candle closes above the trendline
Entry Price: 2.34
StopLoss: 1.89
TP1: 2.5981
TP2: 2.8543
TP3: 3.2796
TP4: 3.8676
Like and follow.
Cheers
GreenCrypto
Will Ripple "leave a dent in the universe"?They called us crazy, when we bought xrp at the bottom, in the midst of court cases. What they don't see is that, many TODAY major companies that changed the world (e.g. Apple, Amazon, MSFT etc.) had long term court cases with the SEC before "leaving a dent in the universe". In our opinion, Ripple is next in line.
#xrp #crypto #bitcoin #ripple #banking #blockchain #finance #money #stablecoin #financialsystem
