XRP - Will 0,25$ holdMajor support/ will it hold or we just get out and enjoy Christmas?
ps. Do not forget how Tesla price dropped after SEC issues...what happened later on could be repeated here. I believe that now Ripple is a brand, here to stay.
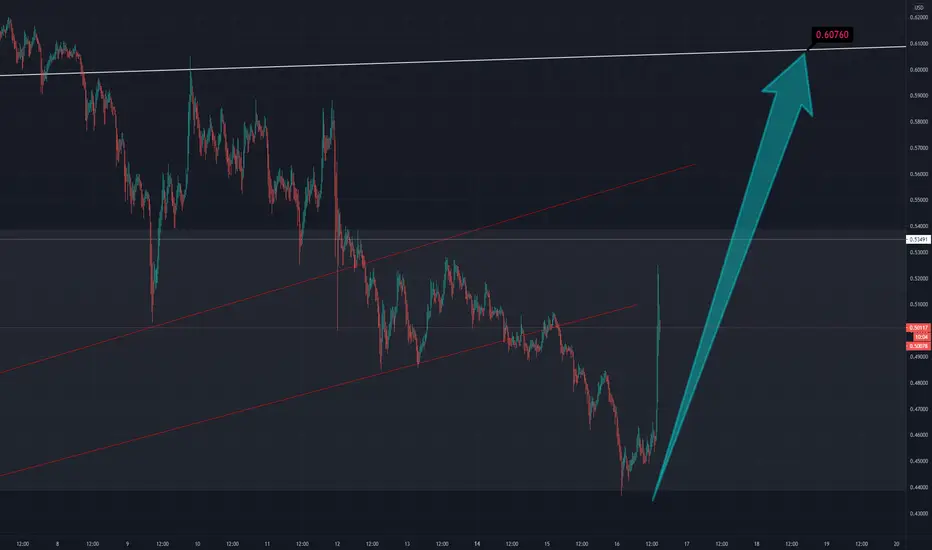
Ripplebreakout

Waiting for buy at DIP 0.35-0.38$ For NEXT BULL ROUND TOwards 1$Market Panic about a lawsuit FROM SEC? YES but this issue Running since 2-3 year and still not official news or official decision.
Opportunity to buying on DIP 0.35 TO 0.36$? Yes long term #dyor
👍 Before we start, please support this idea with your likes and comments, it is the best way to keep it relevant and support me.
Ripple’s XRP broke through early this month major resistance levels to visit $0.4450 and 0.50$ Also hit 0.7740 for the first time since 10th June 2018. Currently, XRP DROP due to USA SEC LAWSUIT AGAINST RIPPLE, This news send Ripple panic mode and drop so far 23$ last 48 hours.
All coin looking bullish as altcoin season running compares to XLM, ADA. Currently, Ripple Chart showing the bullish moment on daily to weekly base from support level 0.40, If price break 0.50$ we could see next resistance level 0.58$ and more hard pump towards 0.90$ alternative BTC must hold stable price above 20,00$ to keep altcoin season bullish If BTC drop support level 20,00$ then we could see altcoin follow up the downside.
Midterm Ripple expecting To touch 0.74$ Resistance End of 2020 and long term price expecting to back 2017 Resistance 3.2$ ( 1-2 Year)
Looking at the short to mid-term Technical Indicators:
Major Support Level: $0.32
Major Resistance Level: $0.65
✅23.6% FIB Retracement Level: $0.36
✅38.2% FIB Retracement Level: $0.48
✅62% FIB Retracement Level: $0.74
Please like, share, comments and follow me to get daily base analysis.
Thank you for your support, I appreciate it.

XRP -Professor to the rescueI said it would be the last post but times like these separate good traders from the rest.
Here is how I acted on the Ripple news (Ripple faces a SEC lawsuit for breaking investor-protection laws when selling XRP)

XRP (RIPPLE) simple analysisXRP / USDT
1- Bullish flag
price after breaking out from major descending channel
Now price is forming flag pattern which is bullish
For this pattern to be successed local support (red color 0.55$-0.56$)should hold and we can see nice impulse toward 0.66$-0.74$ area
2- If this local support failed :
Price will go down to test channel upper trendline
And also 200 EMA (dynamic support in same area)
If price dropped there we can expect a nice bounce
Good luck and happy trading for you all 🌹

XRPUSD a good long opportunityOn the small time period 1 hour chart , the price action of XRP is completing final leg of bullish BAT and soon it will be reached in potential reversal zone.
Buying And Sell Targets:
The buying and sell targets as per Fibonacci sequence of BAT pattern should be as below:
Potential reversal or buying zone: $0.5619 to $0.5584
Fibonacci projection or sell zone: $0.5701 to $0.5701
Stop Loss:
The potential reversal zone area that is up to $0.2906 can be used as stop loss in case of complete candlestick closes below this level.
Possible profit and loss ratio:
As per above targets this trade has a profit possibility of 2.09% and as per the above-mentioned stop loss, the loss possibility is 0.63%.
Note: Above idea is for educational purpose only. It is advised to diversify and strictly follow the stop loss, and don't get stuck with trade.

XRP(Ripple) try to breakout !XRP / USDT
Ripple finally try to breakout now from descending channel pattern
If Breakout happened ..we can buy with small stoploss
Good luck

XRP not quite got the strength of the mighty BTCWe made brilliant move out the right angled triangle on XRP as BTC more brilliantly pumped into new territory earlier
XRP not quite got the strength of BTC where I mean BTC is in price discovery and XRP is still in the shadow of its previous high - 0.8 but...
I think this brake back into an uptrend means we should move to 0.80 minimum, it is just going to take time
Intial TP regions here at the 50 EMA, 0.61 and 0.8 as major resistance levels, then depending on the size of your bag hold for higher heights
As BTC hopefully can accumulate just above and around 20K, we can hopefully see altcoins push on nicely
This will be when XRP and the likes of EOS, NEO etc. should get some proper volume pumped into them!

XRP - We bought again at a PERFECT time 😙Yes, we did it AGAIN!
We went back on Buying Ripple at the PERFECT time guys . It was worth getting up at 4:00, we don't mind doing that every night if the profits are that good.
Thank you Ripple ❤️
XRP - The charts never lie, time to start buyingChart is self-explanatory, the unchecked 0.42 level needed to be checked and this is now very closing to happening. At the same time Bitcoin has been rising slowly and steadily.
About the Professor: I have been knocked down by a flu, spent almost all day and night in bed yesterday. 💊😵
It is 04:00am here and the only reason i got up and check the charts is that 2 alarms went off within 15 minutes - Ripple positions took profit at 0.458 and 0,440
Time to start buying Ripple now and hoping to repeat this again but I know from now that it will probably start bouncing up soon slowly and steadily this time.

XRP - Keeps dropping against Bitcoin but for how longSo yeas Ripple drops against the bitcoin, as well as against the dollar.
Soon there will be an opportunity for Ripple to rebound and that will be the moment to consider a reversal (start buying Ripple again).
How do we trade this now? Well we hedge, we buy Bitcoin and we sell some Ripple. This can change in the next 16 to 48 hours (4 to 12 4h candlesticks)
Keep in touch.

XRP- Who likes sideways? 😴For XRP the 49.99 is Bad news
Sorry again my Ripple fanatics; I speak what I see and my output is more on the negative side at this point in time.
The price is under the 0.50 psychological support and I foresee that it can likely drop more.
Why ?
Well first, the AirDROP effect is finished but the price did not rise back up.
Secondly because there is NO volatility (going sideways in a boring way now isn't it?🥱😴 plus we pay swaps and overnight fees on our positions, brokers love that shit)
Thirdly because it all smells fishy right now:
It's kind of like the 'Xmas Special' of the financial markets:
''Ladies and Gents,
This Xmas buy RIPPLE XRP,
the new Bitcoin is here,
banks love it,
come get rich with cryptocurrencies,
don't miss out like you missed on Bitcoin (you can't buy that one no more it's too expensive for skinny ass)
but you still can get the XRP
NOW FOR THE PRICE OF 49.99
(usually items that are sold like that on Xmas season end up being on sale for 20% less after-Xmas sales)
PS. No news is BAD NEWS in this case. What can save Ripple short-term Longs now is only NEWS!
Good Financial Headline News, from banks and institutions, about how Ripple is good and how their bank will use Ripple and how Christine Lagarde and Chucjk Norris are investing in it. Ripple is out of fuel and the fuel in this industry is NEWS..
So, NO NEWS is BAD NEWS in this case.

XRP will drop at least 13% against BTC XRPBTC chart shows that there will be a drop of 13% in the price of the Ripple in Bitcoins to reach critical support.
To make things worse for my Ripple friends, this drop can reach even +51%; if the support is broken.
This means that if both cryptos drop, Ripple will drop faster than BTC (which was the case last week).
It also means that BTC can rise faster than Ripple for a while until it rebounds.
This is the prognosis for the next few days/weeks but this can change dramatically at any point in time if Ripple storms up again.
For the moment, the chart demands this: Buy more BTC than Ripple for the next period. Or buy some BTC and sell some Ripple to hedge your positions.
I know that some of you are big Ripple fans and you guys hate me saying Ripple isn't going to 50 dollars this years, or even 2 dollars. It might happen next years boys and girls.

RIPPLE - Attempting a Short Not a good day for my Ripple trades and stuck with some shorts.
I am keeping a Bearish approach for the next few hours/days and the price can prove me wrong (my stop loss) at over 61.00 where i might consider to buy again.

XRP- is the airDROP🩸 over? (72% yes✔️)They even told us it was an air-DROP🤧 and we listened carefully 😼 ..but is it over now?
Good news bad news:
Good news is that BTC is rising and broke over the resistance , on it's way to 21k
More good news is that we played our charts📊 (not cards🎰) right and it payed off .
Bad news is that Ripple still faces the danger of 0.415 but the chances are now lower (My new estimate is a 28% chance of that happening)
WHAT DO WE DO NOW?
Well we are increasing our BUYs and reducing our SELLs.
Why? Because it will most probably rise (78% chances now) but we can not cross out the 0,41 level, where we need to be prepared to buy again. That would be our Xmas present , if it happens 🎄.

XRP- Third attempt will be DECISIVE (70%🌄 / 30% 🚽 )XRP- 3rd attempt to break under the 3rd support is crucial 3️⃣3️⃣
We are coming closer to the third (3rd) attempt to break the 0,485 level.
It came close but no touch/check , which is a bullish sign. This gives Buy positions an statistical advantage now.
Third attempts are the ones with the highest probability of succeeding- in this case to break under. (then 6th and 9ths)
Now is a good time to start buying but IF it breaks under the support (0.489) you need to be aware because the 0.40 level will be a magnet pulling the price towards it's level 🧲

XRP - Prognostics Updated 🎅🏿0.40 is closer than 0.60 at the moment.
At 0.40 sing to XRP: 'all I want for Xmas is you' ( ask Santa to buy you some Ripple 🎅🏿 at 0.40)

XRP- What's most probably happening next Find attached my updated chart.
The dip is approaching the 0.485 support, with a 60% chance of a rebound but a 'not to be ignored' 40% of dropping further.
If the price goes to 0.40 it will be time for us to BUY BIG

XRP (RIPPLE) Airdrop and descending channelXRP/USDT
Hello guys
-The Airdrop news (SPARK token) dumped the price hard last few hours ..this drop short term is expected ( buy the rumors sell the news )
Its normal market behavior no thing to
worry about in long term until now
Now we can see in chart :
-Descending channel is detected clearly
Which is Bullish pattern
-The price rested the upper trendline 5x times
-Price between 50 EMA (dynamic resistance)
And 200 EMA (dynamic support)
-RSI is bullish and show bullish divergence
the most safest approach is to buy only after clear breakout of channel and EMA 50 ...if that ONLY happen according to our strategy we can set a nice buy orders with potential targets 0.7$ short term and more
Good luck and thanks for support ✅😊

Ripple XRP Price Action Not going to state my case but Ripple is currently shaking out all fo the weak hands and bouncing off the upper channel support line and going right to the stratosphere. Get in now or regret not getting in later. .49-53 is your last buy zone.
PS: Don't be an idiot and listen to overly confident trolls online, do you own research and protect your own capital.

xrpusd forming bullish BAT for upto 13.8% moveThe previous short term idea executed successfully:
Now again on short-term 4-hour chart, the price action of XRP is completing final leg of bullish BAT and soon it will be reached in potential reversal zone.
Buying And Sell Targets:
The buying and sell targets as per Fibonacci sequence of BAT pattern should be as below:
Potential reversal or buying zone: $0.5249 to $0.5147
Sell or Fibonacci projection zone: $0.5493 to $0.5861
Stop Loss:
The potential reversal zone area that is up to $0.5147 can be used as stop loss in case of complete candlestick closes below this level.
Possible profit and loss ratio:
As per above targets this trade has a profit possibility of 13.8% and as per the above-mentioned stop loss, the loss possibility is 2%.
Note: Above idea is for educational purpose only. It is advised to diversify and strictly follow the stop loss, and don't get stuck with trade.

XRP - Possible scenarios for investors and punters alikeYou guys drive me NUTS with Ripple. I hope that's not all you guys trade...
I also trade it guys but with a certain % of my funds- and it has been going REALLY WELL for me so far so I want to keep it that way.
Take a look at other ideas too, Copper is a fresh new trade to get on for example . Don't go 'Ripple-nuts', go 'Ripple Carefully' please.
Anyways, you keep asking for it so here we go: 4 SUPPORT LEVELS and the % we calculated (don't ask how, our system took me 11 years to develop and is for sale for 1,000,000$), for each and every scenario.
This time we will take a 'Wild Guess' and dare to make an Out of the Box 'How the Market Will try and Fool Us' prediction of exactly what we think will happen, exclusively for our clients at fxprofessor.
ps. Once and IF the price breaks the 0.79 mark then it's off to 1.41

XRP - Short term (we remain 65% Bullish)If you are a buyer buy now, if you are a seller sell a bit later

XRP- Volatility alert (Volatility creates risk and opportunity)XRP has offered us tremendous opportunities to buy and sell and buy with amazing profits. One thing in common is we always study the chart and the first thing we need to identify is VOLATILITY.
After yesterday dip (which we bought nicely and had profits) we are now coming closer to a new round of expected volatility, thus find our updated new chart and beware:
THE 0.40 is as far away as the unchecked 0.40!
We still remain Bullyish and we keep currently a 62% buy 38% sell probability (and positions).
We have cashed profits again yesterday and took profits from 0.50 (we try to keep our best position(s) open and take profit on the second, third, fourth and so one. Yesterday alone we compounded and took profit on 18 positions in total but now is time to go back to keeping our balance and our sell positions are back to create the right equilibrium in our margin, exposure, risk management.
So be aware because there will be opportunities again, to buy or to sell nobody knows but most likely we think it will be a dip and then a time to buy again.
