Ripplebreakout

XRP - Our take profit levels (potential rise to monthly highs)Our take profit levels:
remember: we like to take profit gradually and now that the positions are in the money our stop loss is at entry so we risk only our profits!

XRP - Yes we did it AGAIN!😱 😜🤑🤑🤑Thank to those who came closer and got our strategy for trading this.
We love you guys all and we LOVE trading 🙌👨💻 😍🤟

XRP -Big chartXRP has stopped right on our calculated first support, a rebound is now possible but the possibility for the price to break down to the second or third levels is also valid.
We have been using a special strategy that we teach and are now closing some sell positions.
Contact us for more info.
Havign a chart is one thing, knowing how to trade it is a different matter.

XRP - Chart is good, how do you trade it though?XRP has stopped right on our calculated first support, a rebound is now possible but the possibility for the price to break down to the second or third levels is also valid.
We have been using a special strategy that we teach and are now closing some sell positions.
Contact us for more info

What a dumpster fire and a cluster fuck this is XRP (Ripple)Its been looking like shit and it keeps looking like shit. I am in at $.56 but so many fucking ceilings to punch through. More like a 1:5 chance it goes up but most likely will end up taking a blood bath. If it walks like shit, if it looks like shit, if it smells like shit - must be a unicorn in a candy wrapper.

XRP - Time to try another BUY here tooBuying this small dip. Keep in mind our previous charts for details

XRP Next Legeverything mostly in Graph. as you can see with VP, we are in a good demand Zone. we bounced 1 time on EMA50, 1 more time on EMA100.
i used H4 TF for more visibility.
3 options :
1. We break this descending Triangle now, we could have a resistance around 0.7$, we could push 0.85ish and max 1$
2. We don't break the triangle now, we could retrace to 0.55$ (EMA100) and bounce again for a break to go to option 1 (but lower high).
3. We don't break the triangle now, we retrace to EMA100 0.55% and dip to to EMA200 0.45$.
imo the situation is bullish for now so i mostly like Option 1 and 2. Watch the King first and alts will do their way.
No matter where u take your positions but avoid to trade near triangle borders.. patience is a vertue.
Happy Tr4Ding !

Ripple awaits the ultimate breakout to $1
Ripple is looking forward to a breakout to $1 as long as the price closes the day above the 50 SMA.
The breakout to $1 is likely to encounter delays around $0.7 to $0.75 (supply range).
Ripple is still trading above $0.6 after a motionless weekend session. The cross-border cryptocurrency appears to have settled for consolidation just like Bitcoin as discussed earlier in the day. Meanwhile, a breakout is expected to come into the picture as consolidation is likely to hit a tipping point in the near term.
At the time of writing, XRP is doddering at $0.61 while battling an uphill task at the 50 Simple Moving Average on the 4-hour chart. Ripple will have to settle above the moving average level to first sustain the uptrend before confirming a breakout towards the next hurdle at $0.65. The rest of the journey to $1 will depend on the bulls’ ability to overcome the supply at $0.7 to $0.75.
The Relative Strength Index in the same 4-hour timeframe shows that sellers have the upper hand at the moment. If the negative gradient continues under the midline, a considerable breakdown would come into the picture.
On the downside, it is essential that XRP/USD holds above the middle boundary of the Bollinger Bands, to avert losses that might refresh 100 SMA support at $0.57. It is worth noting that a breakdown can occur following the Bollinger bands constriction, risking the progress made since the fall to $0.45. The 200 SMA is in line to absorb some of the selling pressure, and perhaps prevent Ripple from plunging sharply.
Ripple intraday levels
Spot rate: $0.61
Relative change: -0.008
Percentage change: -1.1%
Trend: short-term bearish
Volatility: Extremely low

XRP - Big Chart for EOY prognosisOur prognosis for Ripple remains positive :
We estimate that the price has 65% chance (2/3) to reach the resistance at 0.77 before it tests the support of 0.545 for the third time.
1. Support 4 at 0.25 has been untested, since the price flew on Nov 20- Nov 23rd.
2. Supports 2 and 3 have both been tested and checked.
Rejection at the 0.77 level on Nov 24th was strong, but given the price had risen for over 100% in 40 days (0.30 to 0.70 from Nov 20 to Nov 24) it makes sens .
IN THE SAME MANNER THE RISE FROM 0.78 TO NEXT LEVEL OF 1. 40 CAN BE AGAIN EXPLOSIVE!! But first the 0.78 level must be breached.

RIPPLE - Intraday Update - 12/06/20 (Short-term)RIPPLE - Intraday Update - 12/06/20 (Short-term)
Bottom Line: Subdividing higher within wave iii of (iii)
Breaking above $0.7941 is the next upside objective for the bulls.
Outlook: A fifth wave rally is in its early stages.
Note: Prices can vary between exchanges, and consequently there may be differences in our chart prices due to different data sets.

WRP - WE DID AGAIN! JUMPED UP RIGHT ON OUR CALCULATED SUPPORTwe calculated EXACTLY where the price would rebound
Previously:
How we bought the last dip and cashed profit PERFECTLY
Stick around for more updates 🧐

XRP - Support levels analytics (super zoomed in)Hope it helps and good luck to all.
You all know how difficult trading is, well i will tell you something:
This might as well be the most volatile bitch asset around right now- trade with care, trade ripple with small amounts and buy the dips with no fear because that's the only way to make huge returns
Because if you ARE trading Ripple that's exactly what you have in mind: EXTRA HIGH RISK (and reward)
Everything i post is my personal opinion and i do actually tarde it with my own money but what i say and what you decide to do does not matter because the only one responsible for your account is YOU
I am just trying to help and doing my best to post what i think is good, to get followers likes recognition and clients for my signals/courses etc
Good luck everyone

XRP - Support levels analytics (zoomed in)I usually share these kind of analysis with my clients only but here you go guys:
For sure many of you have been buying or trading Ripple and i try my best to help by sharing my ideas with you, a little bit more intensively on Ripple nowadays.
On this chart you will find 3 levels that they all have a big chance to make the price jump back up.
I told you, volatility was on on a simple chart
I even called when this volatility would start after a period that it was going sideways as i had prognosed
I also shared with you my prognosis for 0,77 0,97 and 1,5
I also posted on time when to buy the last dip and when to cash profit PERFECTLY
and i honestly hope i am right this time too.

XRP - Support levels analyticsI usually share these kind of analysis with my clients only but here you go guys:
For sure many of you have been buying or trading Ripple and i try my best to help by sharing my ideas with you, a little bit more intensively on Ripple nowadays.
On this chart you will find 3 levels that they all have a big chance to make the price jump back up.
I told you, volatility was on on a simple chart
I even called when this volatility would start after a period that it was going sideways as i had prognosed
I also shared with you my prognosis for 0,77 0,97 and 1,5
I also posted on time when to buy the last dip and when to cash profit PERFECTLY
and i honestly hope i am right this time too.

XRPUSD - Volatility alert, time to Buy?Triangle is runnign out of space, price will need to get moving, most likely going NORTH
I am starting to Buy again and making sure i have enough margin i can sustain a drop to 52 and able to buy any dip.
Ready for action!

XRP - Out of Ripple for now (unlike BTCUSD - it looks better)Unlike BTCUSD, which i am keeping, I am out of my Ripple trades (keeping 1 buy position form 6 that i have in total) for now.
The asset appears to be moving sideways in a channel that could equal go to 55 or 50 before it hits 68 and 75.
I prefer to focus on BTCUSD at this stage.


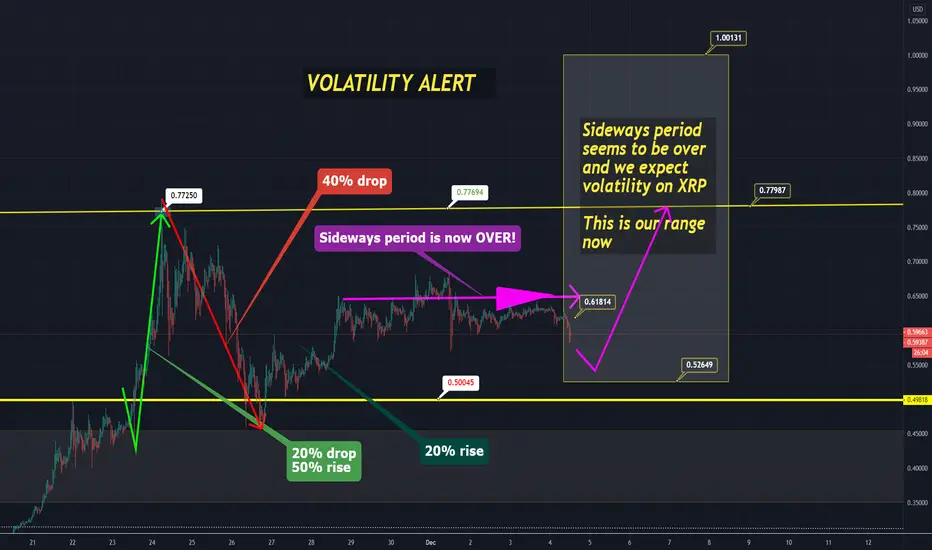
XRP- Volatility inbound 35% ⏬-65%⏫⏫ (ask us for our strategy)It's kind of 'exciting' when one of our famous 'Triangles' is almost out of space.
Volatility is inbound and there are 3 factors dictating the next move:
- big traders (whales) with big orders
- Bitcoin (the price of Ripple is correlated with the performance of BTC)
- News (fundamentals are hard to predict but Ripple tends to get good news from bank and central-bank related comments on this asset)
Our updated chart comes with prognostics and key price levels.
We have a specific strategy to trade this asset and we teach it at WWW.FXPROFESSOR.COM

XRP - 3rd attempt to break the 0.57 level could be crucialOur updated chart and a new look at how to Buy Ripple.
The price has flirted with breaking over the 0.57 level twice. the third (or sixth or 9th) attempt has icreased chances of doing so.


XRP - Get back on it carefully We bought the dip early, so if it drops we have a stop loss 'in the green'.. a profit is guaranteed
If you didn't buy yet:
The market dropped, maybe it's waiting for Buyers to go in, drop again and smash them, so BE CAREFUL!
Chances are it will rise but look at the chart and see our key price levels
