XRPETH has an inverted H&S + volumeSurge In this recent sell off down to 10K s2r1 Has caused a circus jungle cluster fuck to say the least in terms of the altcoin market cap. Post sell off is always my favorite time to go “hunting” That is looking for obscure pairings that yield more ROI (in some cases in one hour) than your typical entry.
But you know the saying— easy come, easy go.
Do not get greedy and do not FOMO/FUD!
If you have already collected more than 35% + markup on a single entry and you’re an ema forex trader, then Quit while you’re ahead and move onto the next one!
Some other tokens to watch: $MCO $LINK $LTC $IOTA $TRX $ADA
I would not suggest pending against anything other than USD— So if all your TA is pointing towards what looks like an objective entry as mine has in the case of XRP/ETH — then by all means Carpe diem.
Do you know What differentiates a fomo/fud vs. an objective, analytical method?? Research. If all the indicators are present in your head & your thinking a particular entry == ready for a green light then if ur head is telling you to go for it, go for it. DO NOT Change your mind just because some douche with 1 million followers tells you otherwise.
Ultimately it’s your money and they like to pretend they know everything but In this game we are all weathermen and they don’t know anymore than you do—Assuming you know the fundamentals of forex.
With that being said here is my own technical analysis on XRP/ETH (short)
TP1: 0.00146195
TP2: 0.00148855
Stop @ 0.00142248
Disclaimer:
Not financial advise. Pairings against other coins/tokens are not encouraged and I would steer away from them unless you really know what you’re doing. We are already dealing with the most volatile & valuable global marketcap/asset (that’s BTC alone!) that never closes— This whole game is high risk high reward so don’t take any more unnecessary risks.
Set a stop loss and be prepared to shortsell.
-@a1mTarabichi
Ripplebreakout

Opportunity of Grabbing a Succeeded of XRPa forming pattern could signal a new bull run for xrp, but more confirmation must be flop before we can be certain of this prolly new bottom. cause if this whole pattern shows up it is still a short consolidation for a new bull run to confirm. but yeah we shall monitor this and decide soon whether to go in or not.

BUY XRP/INR FOR TARGET 200Go Long for XRP/INR. Current Trading price is INR 20. Expecting 10X return in next 2 years. XRP is 5th Highest in Market Capitalization. Fundamentally Strong compared with other crypto Currencies. Only buy it if you want to Hold for 5-6 years for 20X return.

XRPUSD formed bullish shark | Upto 77% profit potential tradeThe priceline of XRP /U.S DOLLAR has formed a bullish shark pattern and entered in potential reversal zone.
From here it can hit the sell targets soon insha Allah.
The MACD is also turned bullish.
I have defined the targets using Fibonacci sequence as below:
Buy between: 0.30493 to 0.25690
Sell between: 0.35358 to 0.45584
Regards,
Atif Akbar(moon333)

ripple forecasthere is our ripple bank level i will put my buy limit orders in the blue zone and wait to our targets hit

XRP USD has completed bullish shark | A good long opportunityThe priceline of XRP / US DOLLAR completed a bullish shark and now entered in potential reversal zone.
From here it can move up any time to hit the sell targets soon insha Allah.
I have defined targets using Fibonacci sequence as below:
Buy between: 0.30169 to 0.29559
Sell between: 0.30948 to 0.32418
Regards,
Atif Akbar (moon333)

Atleast we cant go blow 0 satsxrp is over, ripple keeps dumbing their trash xrp we have had enough good news to let it do something with the price, and it did nothing. RIP my money & F Ripple.


XRP: This is what will happen should BTC hit new ATHs this yearI had previously drawn scenarios where BTC would take the "normal" route that we all know, where we'd see the All time high, sometime after the bitcoin halving.
But because this time BTC is half a year faster in the cycle than back in 2015/16, we would see the ATH already by late 2020, or early 2021.
However, as I posted previously, if BTC decides to do the gold fractal, and just continues pumping, this of course would mean in turn that XRP and the other altcoins would
also start pumping earlier.
BTC might reach the top BEFORE the halving in 2020, and it might become a "sell the news" event, where unexpectedly we'll see a price decline afterwards.
Should this happen, then BTC will break out at some point later this year.
According to the previous XRPBTC structure, we will see a new ATH in XRPBTC this time, which would be logical, since every new altcoin season, the alts gain more
versus BTC. BTC will see new dominance lows in the next altcoin rally.
Therefore a top of 0.0004 is likely for XRP. Now, if BTC goes to 100k ATH, it would translate to an XRP price of 40 USD.
We'll just have to wait and see how fast BTC is, to estimate the possible top. For BTC to reach 100k, it must not be faster than mid 2020 to reach the ATH, around the time of halving.
Should it be much faster, then the peak will also be lower.
We can experiment around with a few scenarios and come to the conclusion that the XRPUSD top will be anywhere from 15-20 USD for BTC ATH around 50-60k, up tp 30-40 USD for BTC ATH around 100k.
Let's see what BTC will do, and XRP will follow. The altcoins do not have a life of their own, please never forget that BTC IS KING. The alts are little sheep that only follow BTC. Therefore, we must keep a
close watch on BTCUSD and XRPBTC in order to determine the XRPUSD top.

Ripple LongPrice had broken that downtrend line in the 4hr timeframe with a retest of that breakout, now we should see a rise on ripple.

Ripple will do an intermediate move soonXRPBTC is falling as I predicted here:
Now, many are waiting for the big ripple breakout.
When will XRP finally start to follow BTC?
Well, if we look at the volume profile and the big falling (bullish) wedge,
we see that there are basically two very important support zones.
The 1st one is reight now at this very level, at 2900 sats.
If we don't get a strong bounce here, I think XRPBTC will further decline to the next very strong support are, which is historic support.
The falling wedge would thus end in early 2020 at around 1000-1300 sats, which is very strong support.
I think that then we will finally see XRP rallying. The likelihood for a strong rally now is quite low imho, but not impossible.
We might get a smaller intermediate rallly up the the resistance of the falling wedge though. But breaking through that resistance: Not too likely imho.
But longterm, 2020, XRP will be pretty awesome.
W bottom — XRPUSDencrypted-tbn0.gstatic.com
W bottom spotted on XRPUSD clearly a great opportunity for a short to mid position now would be the time to make an entry.
Please read the disclaimer from previous post.
Target TP 1 & 2 (SHORT/MID) && STOP lines on chart.
Trade safe all! Cheers. Peace.
@a1mtarabichi

RIPPLE IS READY TO THE PARTYLET'S SEE WHAT RIPPLE WILL DO, IT'S AT VERY GOOD SUPPORT LEVEL BTC DOM. LOOKS LIKE GO DOWN WEN HOPE THAT THE CASH DON'T GO OUT OF THE MARKET AND GO TO THE ALTS

Not till 2020 We are clrealy not in a bullmarket for alts, xrp has a pattern it had before, just going up and down in a .20-.50 range. 2020 for xrp president.

Ripple XRP wedge updateContrary to some uber ripple shills, I personally don't really like ripple. It's centralized, and stands for everything which I basically don't like.
However, I can't deny the brutal pumping potential behind this coin. In the past, it always was one of the best performing coins.
However, I am pretty convinved that it will NOT pump in 2019.
2019 is accumulation year, and many are disappointed the ripple didn't grow much, now that BTC went from 3k to 13k. Ripple in that same time barely moved.
Why?
Well, if we look into the past, it did EXACTLY the same in 2016-2017.
While BTC was already rising like crazy, it didn't move a lot. Instead, it was building a wedge from which it then would launch, over a full year after BTC had already started rising.
I think it will do the same again. Doing a wedge, like the one I drew, and then when most people are frustrated, and sold their XRP because it just won't rise, then BAAMMMM, it will start in
early 2020 to do a brutal rally.
Now, how high will it go?
If the 2017-18 rally was to repeat exactly like that, we'd see a 200 USD ripple. Now, before you brutally flame me as an XRP shill, let me say: I believe this to be unrealistic.
It will entirely depend on how high BTC will go.
If BTC goes to 100k, I think Ripple realistically would go to 30 USD, with luck 50.
If however BTC goes higher than we all thought, say 300k-500k, then indeed we could see 100-200 USD ripple.
But again, this is an ultra optimistic best case scenario, and we should not trade according to best cases, but more according to optimistic estimations.
I've bought quite a lot of ripple in the last months and I will add more, now that BTC might dip a little, XRP could hit 30 cents again. I will add to my longterm position when that happens and hodl XRP for 1+ year.
Because as Vespasian said: Money doesn't stink :)


$XRPUSD sees dbl bottom and parabolic upswing$XRPUSD is long overdue for a correction and we are seeing bullish divergence making an entry for a quick short position looking better with volume confirmation to follow. Trade set at neutral as it is too soon to tell for a long position could unfold. Time will tell.
Stop loss is present. Trade carefully. Will update with more info later.
Disclaimer
This is not financial advise nor should be regarded as such. Always invest carefully and make your own decisions with your own money. Have a great weekend.

XRP Bull Run is ComingXRP is looking good at the daily chart. RSI is in oversold zone and will make a double bottom before the parabolic move starts.
The immediate support, for now, is 3500 sats and 3000 sats. Possible targets are 5000-6500-8000-10000-13000-16000 sats. Bitcoin another pump or dump will weaken the BTC pairs of alts surely. Alts season will come soon

Ripple longterm bullish, but XRPBTC will first fall before riseWell here is a different picture on Ripple.
I am a longterm ripple bull, and believe we'll see quite insane XRP prices in USD in late 2020 and early 2021.
As high as 30 USD, probably higher.
But in relation to BTC,
I think XRP will first continue to decline.
Therefore the USD price will not pump much before 2020.
I don't see XRP going much above 1 USD in 2019. I could be wrong of course,
but XRPBTC seems to be in a giant megaphone structure!
The strong VPVR support is as low as 1k sats.
And we can see that every time, since late 2013 ( I drew the first peak from coinmarketcap data), XRPBTC has been doing the same pattern:
Two tops, followed by a long decline, going back almost as low as the lowest low before.
So from 10k satoshis, to a few hundred.
Then in the 2015-2017 rally, we see that it went from only a few hundred sats to 20k sats.
And now a very similar structure.
So it could indeed go as low as 1k sats before the big pump in 2020/21.
If we stay in the megaphone, it could maximally go as high as 40k sats (upper limit), but might of course be again "only" to 20k sats.

Does it happen again?About 17 percents lower than the current POLONIEX:XRPBTC price, there is a major long-term trendline with a magnificent up-rise each time it is met. whether the COINBASE:BTCUSD rises and we have a sideway market in COINBASE:XRPUSD market, or any other scenario, we can anticipate the price meeting the old trend line.
If similar reactions to the trend line happen again, we can see at least more than 250% increase in POLONIEX:XRPBTC .


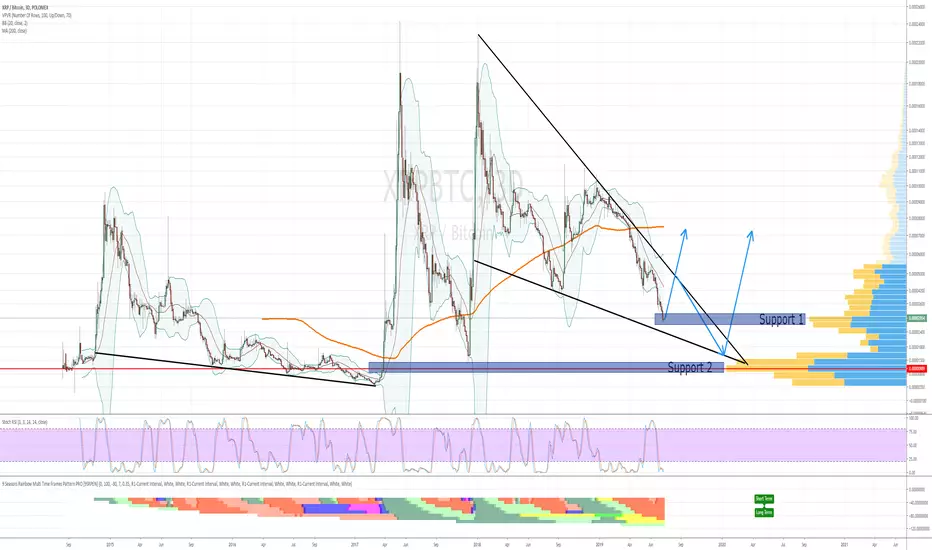
XRP/BTC: Pure DistributionIt can be seen that ripple has had a double top, which is noted in the chart in light blue. This form of double top is known as an Adam and Eve double top with a V top for the first one and a massive rounded top for the second one. The rounded tops or bottoms are some of the strongest most reliable patterns because they indicate a long duration of either distribution or accumulatio (with this case being distribution). The price objective which can be seen as the light blue arrow is a conservative one with a minimum price objective of around 2000 satoshis, (it can be noted that I did not accurately measure this to create an even more conservative price objective).
In addition, I indicated the current support and resistance as the green and red box, respectively, it is important to note how weak ripple is right now because it was unable to reach the breakout price of the double top which was about 6100 satoshis.
