Short-term view on XRPWhat's up beloved crypto family. XRP is.
After a 20% charge from 0.46 up to 0.56. My sentiment on Ripple (XRP) is largely bullish. Currently the price is in, what could be, a bullish pennant. Look for a trend continuation.
Other wise, if the price is to break below the current triangle forming - look for a long position around point A.
Full disclosure - I am holding a large bag of Ripple - so you can be certain there will be a degree of bias in my current and future analyses.
Once again - hit me with a follow if you agree with this idea :)
Ripplebreakout

XRP Short Term Cup & Handle: LongI don't call patterns such as the cup & handle on such small time-frames!
- But look how beautiful this chart looks (M15)
- Definitely worth noting!
- Lets see if their is another strong upward motion before we go back down...
Why do i see people saying ripple is going to $10.00...
I have TIGHT STOPS labels:
- This is a M15 chart and a SCALP play!
- Lots of selling atm too
STOP 1: Super Tight
- Stop @ ~ 0.000081245
STOP 2: Wider (Higher Risk) - Wait to get in to this position...
- Stop @ ~ 0.000080515
This is a short term SCALP!
- Watch the areas of support / resistance and see how the market reacts!
PRICE TARGET: 0.000084466+
Be careful and watch volatility and price movement!
- Don't FOMO in...
- Lastly be like water! If support breaks we go back down just as fast as we went up...

XRP respecting support zone! XRP continues to oscillate but respected that demand OB perfectly to the tick as we bounced straight out and just recently tested resistance on that sharp move from Bitcoin.
EMAs remain flat but if price could get higher here, we could see them start to curl up, which could help a lot with the bearish sentiment going around.
But we remain in this range so nothing to get excited about just yet but a break of resistance could cause people to FOMO back into XRP for those face melting rallies.
Thanks guys!

XRP could not break $0.46 POC!XRP continued to have trouble getting above the $0.46 POC level and as Bitcoin fell this morning it dragged Ripple and the rest of the market down with it as we had mentioned in previous posts.
We have however bounced right at the bottom of this demand block and moved back above. A close above here on the daily would be very good for bulls but at the end of the day, we NEED to break this $0.46-$0.48 resistance zone.
The EMAs are starting to curl lower and a bearish crossover wouldn't be too heartwarming for bulls. As long as we remain support here at this order block, we are still good.
Thanks guys!

XRP/USD Bearish coming. Trend found.We may see an uptrend channel with Ripple until the end of the year.
2018 has been a hard year for cryptos in general.
Stay tuned for next movements. Ripple is actually in the middle of a parallel channel.

XRP to the Moon or Dumpster?!?! Let's Find OutNo hype. Only facts here. We have a pennant forming on the 4HR Chart. This whole year has been a more bearish then Leo Dicaprio getting mauled in "The Revenant." Until the weekly downtrend gets broken (with a close) I'm still bearish on XRP. I'm curios to see what direction we break too. I would love to see the down side because I do slightly favor it, especially if you go on the 4hr chart. We just had a double top for and broke to a newer low (with a close below) The massive spike about a day ago was a 61% retest of the swing high to low fib on the 4hr chart.
If this breaks to the downside I'm looking for a close around 45 cents, to consider it strong enough. For a breakout I'm looking for it to close at or bout 50 cents to enter.
I need to see a big volume surge on either break for confirmation.
I will update more once appropriate,
Let's see what price tells us.
Always open to hearing your thoughts!
I gotta upgrade my damn memebership so I can show multiple charts lol
(Looking for a head and shoulders completion to upside..there is one hidden in the pennant)

XRP cannot pass $0.47 resistance! XRP yet again has gotten smacked down from resistance around the $0.47 mark. We did see it break down from the trendline support but rebounded strongly yesterday as it spiked all the way to the midline of the supply zone and seems to be coming right back down now.
As long as we remain capped below this area, XRP could continue to trend lower.
Thanks guys

XRP possible break back up to highs?XRP has bounced making a higher low after hitting the previous swing high (dotted line) and is now attempting to break above resistance.
The EMAs have crossed bullish and continue their uptrend BUT the fast-moving EMA is giving hints of stalling up here. We initially tapped the 50% FIB in the supply zone and are curerntly having trouble getting back above. A close above this zone will be bullish and put us back in the range before the break down. A failure to push higher here could results in a move back down to the trendline support.
If we do break down from the trendline, we can clearly see where the POC area is for the next bounce spot around $0.33.
Thanks guys!

#Ripple | $XRP - Is is Up or Down from here?!? #WeBettingUp#Ripple | $XRP - Is is Up or Down from here?!? #WeBettingUp

XRP has bounced but could still see $0.33!XRP has bounced after falling to $0.37 but it is having lots of trouble getting through this supply level, which is embedded in a FIB level as well. We have tried a few times and got rejected every time but the fast-moving EMA seems to be leveling off while the other still tries to catch up to price lower. A possible trade can be taken on a break below the EMA + rejection of this resistance level with stop being the high of the first attempt through the supply block.
Always wait for confirmation and how Bitcoin is reacting but this trade could play out on another move lower with R:R setting up nicely.
Thanks guys!

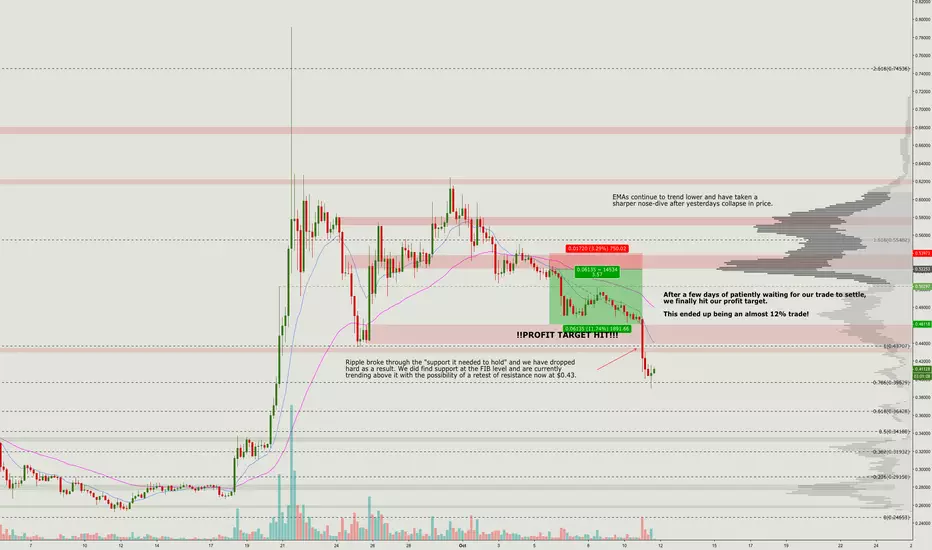
Ripple TARGET HIT!!!Ripple finally broke below the support zone it needed to hold. Profit target was hit and 12% was made on this trade. We have bounced on the FIB level so far and we could possibly expect a move back up to resistance before continuing lower again unless buyers step in here and push us back above the supply zone!
However, BTC will dictate the market with its price movement so we must keep an eye on that!
Thanks guys
Daily Top Coin Analysis #XRP #XRPBTC (07-10)This is not a call, just for analyzing
Follow me for more signals daily
XRP continues to look weak and could revisit breakout zone! Ripple continues to look weak and after breaking below the supply zone and finding resistance at the trendline , XRP might want to revisit the demand zone below! This, of course, can be negated if we get higher and close above the trendline but more importantly the resistance zone.
Check chart for annotations!
Thanks guys

XRP trying to resume its run if it can breakout here! Ripple continues to remain pegged down by this supply zone and the EMAs as it tries to break out from that descending trendline. The lower trendline has been adjusted and we can see that it has tested near it multiple times and is now attempting to break past resistance and make its way back to the FIB level or the supply zone above.
MACD seems to be signaling bull action as both signal line and histo are trending bullish as of now while RSI found support after breaking resistance and continues to trend upwards. We are also still sitting at a major POC area so until we break out of this, we will continue to bounce around.
If Bitcoin does break higher here, we can see relief for altcoins including Ripple so keep an eye on that!
Thanks guys
XRP NEEDS to hold this support zone! XRP has broken down from the triangle and cut through the demand zone where it now finds to be resistance. EMAs have now started to turn over and are about to crossover bearish.
MACD continues to trend lower but the histo is creeping up a little while RSI did break above the resistance line but seems to be losing steam and might return back under and proceed lower. The safer trade here would be to wait for a break lower of this supply zone and take a trade on the retest having targets set at the FIB level, which is near 0.43.
Thanks guys

Ripple / Bitcoin Long term Analysis**Double click the price line to show the chart since its on log scale.
XRP made an impulsive move in the beginning of 2017. The arrow shows the impulsive leg since then it has been a big monthly correction.
First drop from the high of may 17 was the A wave of the correction. Currently we are in wave B which is looking like it will form some type of flat structure.
I'm using the regular flat for my forecast but depending upon the where the C wave goes it can either be a regular flat where it come to retest the high of a or it can fall short form a contraction flat with truncated wave. This possibility shouldn't be ignored while trading even though its not as probable as the regular flat.
From here, I expect xrp to do a big corrective structure and then take off once more to retest those highs of jan 18 to complete the final leg of flat structure forming the B wave of larger degree.
Following which we should get another impulsive leg down to test the lows of nov dec 2017 and break them before this correction can be considered complete and XRP can start a new impulse up.

XRP - Stuck in a range! XRP has been bouncing around this range tagging both sides numerous times without finding any interest of breaking out. We have currently tagged the upper trendline and lower trendline multiple times as we continue to expand as we move forward, which is called a megaphone pattern. If this pattern continues to play out, volatility will continue to increase as we move along.
MACD continues to slide lower here as the signal line will soon join the histo in negative territory while the RSI continues to get rejected at resistance after failing to break higher!
We currently remain in a no-trade zone as we await some type of volatility.
Thanks guys!

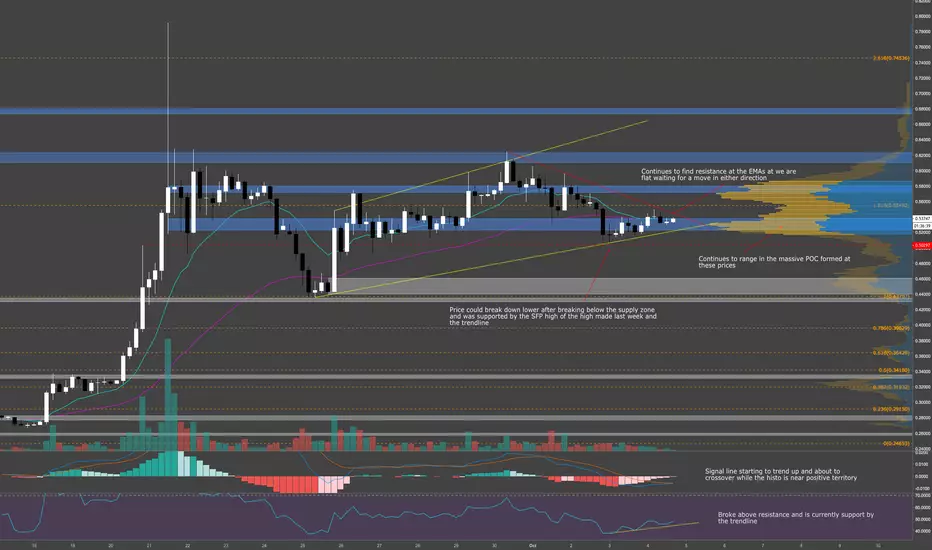
XRP - Last HOORAH?!Ripple broke past resistance this weekend testing areas of supply before getting rejected at previous SFP highs and moving back down into once a resistance zone. There wasn't much volume on that move up but the rejection volume down into the support level did garner a rise in volume but held for now. This zone is key for any XRP move upwards as a break from this zone would cause a retest of the lower demand areas near $0.46. Break of the $0.437 areas could cause the price to make a full retreat back down to $0.39 however, we don't see that happening unless Bitcoin wets the bed.
Both metrics for the MACD are hinting bearish so far and the RSI sees to be trending sideways and hasn't given a clear indication of direction yet. Price is currently finding hard to remain above the 1.618%FIB level and a close below here could spell a revisit of the demand zone below.
Possible safe short scalp would be a break and retest of this demand zone all the way down to the FIB zone test on the last move down. Any longs would only be considered if we could get back above the $0.58 area.
Thanks guys!

Is XRP about to moon?!XRP has been on a rally since 9/18 and has formed a bullish pennant on a daily chart. This could be a great investment opportunity provided that it continues to break out. Volume has been off the charts in September and if it keeps up with the momentum we can probably expect around 50% return, flag pole length can sometimes reveal next stop and in this case it can be around $0.92. Time will tell, in the meantime RSI is lingering in the overbought territory and MACD appears to be very positive.
P.S. I am not a financial adviser so please do your own research before making an investment.

Ripple (XRP) Let this coin move up, then short it. Buy and sell.Ripple will have a developers conference on the 30th this month, creating hype for another pump to 8000 levels.
However, I have been trading the king of hype coins, Tron, for over 5 months and I know that these rallies take place before the event, and after the event price drops very hard.
Therefore, we may set up another low risk short for XRP. You may wonder why I short only for XRP. That is because the risk is much lower if you get a very good entry, and it is very hard to predict the pumps due to it being a bear market.
This coin has been moving up on high momentum, so one last rally may be possible.
Therefore, long now
Long:
7813 (Current price)
I am using 100% of my capital with a very tight stop as this is a no brainer long.
Take profit:
Undetermined. Wait for a topping pattern or consolidation to form.
Short:
8300+
(Ideal entry is 8400, but it the top may happen above or below, so start scaling in.)
Stop Loss:
8700 sats
Alternatively, if we break 8700, that may mean another rally upwards, but that will almost certainly not happen.
Thanks for viewing!

XRP/USDT CUP AND HANDLE PATTERNXRP/USDT Cup and Handle Pattern forming!
Followed by the event of Ripple Swell on October 1-3 2018.
Watch for breakout!
"Bullish"
Target for around 0.65 usd.

Ripple - Bullish Motive Wave?What's exciting is that with Ripple for the first time since a 3/4 year, one of the top 5 has developed contrary to the bitcoin price trend. Could the trend reversal in the crypto area be slowly ushered in or is this still premature wishful thinking?
In any case, Ripple has hit the possible turning point with a starting impulse due to the brilliant chart technical breakout and thus the ripple could already be in wave 4 of the 1. The breakout to 0.7644 dollars would have been the wave 3 of the wave 1. After a quick correction to the range of 0.40 in wave 4, in wave 5 it should go up to area 0.80. Depending on how dynamically the next few days develop, there will be a better prognosis ability for the further goals after completion of the pattern.
Best regards
Stefan Bode

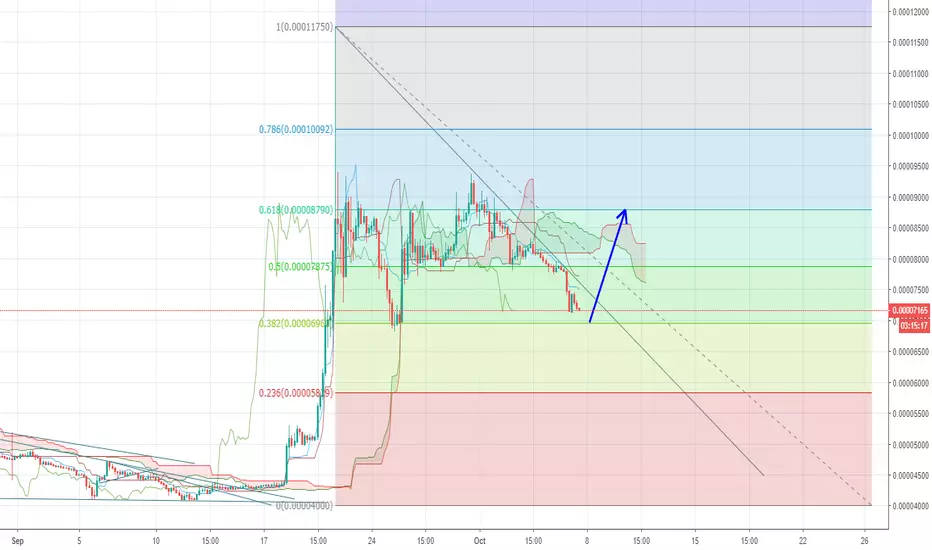
Ripple (XRP) Rally looks to be done. Good short entry. XRP has not displayed a topping pattern yet, and due to the three rising methods, we have a 70% chance of breaking up. However, taking into account that we need to manage our risk, going short is the better option.
Using basic market theory, when all the buyers have longed, price drops. So far we have realized that there is still support for XRP at this level, but I have noticed big take profit market sells, so most the buyers have left. We also failed to break the 0.236 level, confirming my theory.
However, notice how each XRP rally goes to 0.5, then 0.236, before continuing down. So if we cannot break 0.236, that is our short signal.
Short:
8937
Stop Loss:
9420
If we do break 0.236 for real, you may enter long with a stop loss close to your entry. You must have a stop loss either way as this trade could make or break your trading account if you use a good amount of capital.
I am already in this short trade since 9150. My stop is 9420.
