XRP/BTC this one is going to outperform BTC really well!Short and medium targets the army will enjoy this.
Ripplebtc

Xrp Usdt short term analysis (Ripple Tetherus)There is a bull pennant pattern formed since approximately 0.23 lower resistance. I think it will breathe at 0.295. this is not investment advice. just my amateur work. good luck for everyone.

XRP/BTCXRP touched the support line of a downtrend.
Formed a double bottom
RSI - oversold
Best regards EXCAVO

XRP RIPPLE - Close to an important level XRPBTC XRPUSDT XRPUSDCIDEA TO TRADE XRP RIPPLE - Close to an important level XRPBTC XRPUSDT XRPUSDC XRPUSD
Trade towards breakout level , Safe and Happy Trading..!!!

Xrp/usdt 2 months consolidation what next ?Hi friends
Xrp/usdt
Quick overview analysis
From early September until now ..
xrp price show consolidation
between 0.23$- 0.26$
And we all know after long time of consolidations big move is coming
So hey xrp army be ready for the next
As long as xrp hold above 0.23$ there is high chance we can see a big pump to 0.30 at least
However daily close below 0.22 will be bearish
Xrp/usdt price in last 2 months never closed by daily candel above 0.26$
This mean any daily candel closing above will be extremely bullish
You can see here
So if you are holder.. be fine and no problem as long as xrp hold 0.23 support zone
Good luck
Please support us by like & subscribe (follow)
And show your opinion in comments section below

XRP-time has come!By the end of the year or a little later, BTC will cost 20,000, then a 30%-40% drawdown and the long-awaited launch of XRP with a new ATH is inevitable!
Happy trading everyone!
BASIS: The opinion of the author may not coincide with you!
Click Like.

Ripple - XRP - The best time to buy is now! Go beyond!!!WAVE 5 is done! The best time to buy is now!
#XRPBTC: I'm LONG / BULLISH position up in (GREY BOX) . I expect that $XRPUSD will rise up.
This would mean that RIPPLE will gain more 500 - 1000% of its current value against BTC before it can down.
What is the right way? Looking for relevant timeframes, with patience and planning, NO DESPERATION.
No one goes into the market thinking they should buy at the high and sell at the low. The problem is that at the moment when faced with the ups and downs of the market, it’s hard to resist the urge to do those things.
Trading is all about spotting emotional excesses either to the downside or the upside. You want to be on the right side of those emotional reactions and not the wrong.
If you want to win in this market, you need to be COLD and CALCULIST .
To the moon is too close, go beyond
Well, keep you updated as this timely issue evolves.
Good luck!
#CRYPTO $XRPUSD #XRPBTC #XRP #RIPPLE #ALTSEASON2020
$BTC $BCH $BNB $XLM $EOS $ETH $ADA $LTC $TRX $XRP $IOTA $LINK $XTZ $BTT $XMR $NEO $BTT $MATIC $XMR $MRK $XEM $ONT $DASH $BAT $ZRX $LSK $NANO $REP
#altcoins #bitcointrading #BuyTheFear #BuyTheDip
#CRYPTO #XRP #XRPUSD #XRPBTC #RIPPLE

Xrp/usdt almost like ltc before the breakout !!Xrp/usdt
Possible inverse H&S
Looks like ltc before break out
Check here my idea about ltc before breakout :
I expect xrp do the same
Buy only if break and close 4h candel above 0.26050$
Must close above !!
Targets in the chart
And stoploss if the price close below again that level by 4h or daily candel

This Is How The Ripple (XRP) Gives Profit OpportunitiesHey friends, hope you are well and welcome to the new update on XRP.
In my previous post, I showed that the price action of XRP has formed a bullish butterfly and finally the priceline took bullish divergence from the potential reversal zone of Butterfly pattern and produced a more than 47% rally.
Previous idea:
On the weekly chart the price action of XRP formed a bearish BAT pattern and after the completion dropped upto 0.50 Fib level.
On the same weekly chart the priceline of Ripple has also formed an uptrend line. This uptrend line is working as a strong support for the candlesticks. This time the price action is again likely to bounce from this support.
The XRP has also formed an up channel on daily chart. And reached the support of this channel.
In Bitcoin market the priceline of XRP has also completed the bullish BAT pattern and entered in potential reversal zone.
Conclusion:
As the priceline is at the support of channel on daily chart and at the support of an uptrendline support on weekly chart. At the same time the price action has completed a harmonic bullish BAT move. Therefore we can expect a rally to the upside from here. But the PRZ level of this harmonic BAT should be used as potential reversal zone to minimize the risk factor.

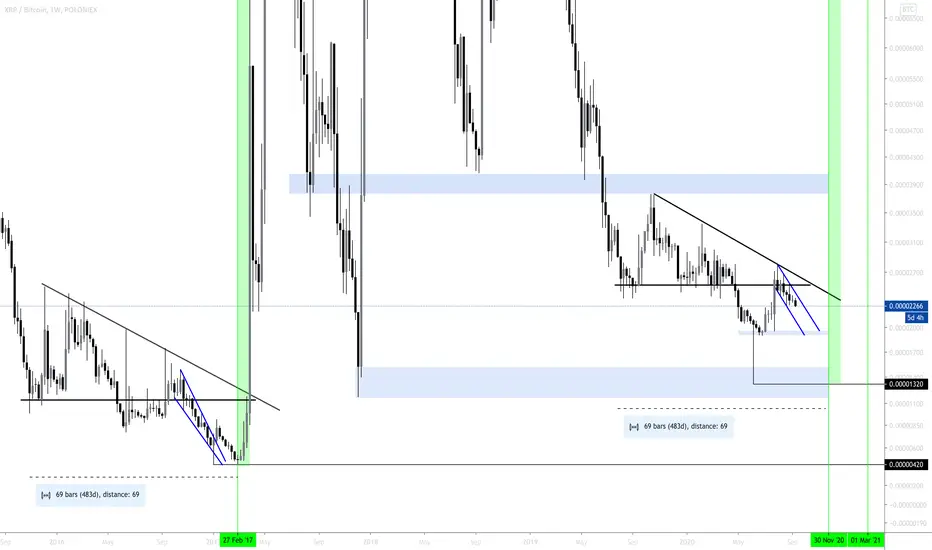
XRPBTC 3D. Looking forward to strong growth!Our first XRPBTC idea.
But we plan to do a whole series as situation changes , so subscribe to us and like to keep abreast of ideas updates.
It is one of the first coins , which in 2017 gave us X's almost every day, especially in a pair to Bitcoin. One of the nicest crypto trading memories).
We don't know if the history of 2017 will repeat itself, most likely not. But XRP's price has almost sunk to the bottom . There will be a good rebound sooner or later!
Now the price is in the middle of the falling channel and in the coming days it will be decided where to move next.
If it fixes below 0.00002060, then the way of movement to 0.00001650 will open.
If it pushes upward from 0.00002060 now, it will move to the zone 0.00002400-0.00002530.
Price fixing in the circled zone , we will consider as a significant signal before the start of a strong upward rally.
P.S. Below are our thoughts on the XRPUSDT pair:

XRPUSD Bullish ConsolidationAfter 5 wave impulse since the March 2020 low, we went into an ABC correction and consolidation within an ascending triangle.
Time cycles also show that a breakout to the upside is expected in the short term (1 to 3 weeks IMO).
Not financial advice

XRP/BTCAlright Ripple... I think its time to show BTC a little muscle here... I’d love to see a jump to .28 in the short term, but why stop there? Let’s take this thing back up to ATH’s! Good luck!

Xrp/btc looking bullish after break trendline and multiple emaXrp/ btc just broke trendline and ema 10-25-75
Looking bullish
best Buy area 2280-2240
Stop 4h candel or daily close below 2193
Target
2395
2540

XRP Wedge breakout XRP breaks the falling wedge. Buy it on pull back to the trend line. Targets mentioned on the chart.

XRP Falling wedge
The falling wedge signals a bullish reversal pattern in price. It holds three common characteristics that traders should look for: First, it has converging trendlines. Next, a pattern has declining volume as the trendline progress. Finally, it’ll be preceded by a breakout through the upper trendline. What all these things come together, you have a falling wedge pattern, and a breakout to the upside should be anticipated.
The falling wedge pattern, as well as rising wedge patterns, converge to the smaller price channel. This means that the distance between where a trader would enter the trade and the price where they would open a stop loss order is relatively tight. Here it can be relatively easy to get kicked out of the trade for minimum loss, but if the stock moves to the trader’s benefit, it can result in an excellent return.
Attributes
Pattern type: Reversal and continuation pattern
Indication: Bullish
Breakout confirmation: The confirmation for this pattern is a close above the upper trendline drawn across the highs with above-average volume.
Measuring: the project target price for the falling wedge pattern is the highest high at the beginning of the formation.
Volume: The volume tends to decline during the formation and increase on the breakout.
Best regards EXCAVO


XRP/BTC: Bullish Breakout Technical AnalysisIf you like this analysis, please make sure to like the post, and follow for more quality content!
I would also appreciate it if you could leave a comment below with some original insight.
In this post, we'll be taking a technical approach in analyzing the notorious cryptocurrency: XRP
Analysis
- XRP has been consolidating within a bullish descending wedge on the daily chart
- It broke out of the wedge formation, and is undergoing a phase of pullback
- Prices are currently trading below the 20 Simple Moving Average (SMA)
- We are also seeing resistance near the 0.236 Fibonacci retracement resistance, where it converges with the trend line resistance
- However, the Relative Strength Index (RSI) shows signs of bullishness, as it has broken out of the long term descending trend line resistance
- What's worth noting for XRP's daily chart is the Moving Average Convergence Divergence (MACD)
- The price history demonstrates that there has been big breakouts after the formation of a golden cross of the MACD
- As such, we could anticipate a bullish breakout to take place once again
- On the shorter time frame, the 4 hour chart demonstrates a bull flag pattern, with prices looking to break out imminently
Don't predict the market. The future is all about preparation, not prediction. Take it by levels, and play by probabilities.
-Michael Wang-

XRPBTC completing final leg of bullish BATThe priceline of XRPBTC is completing the final leg of bullish BAT, the targets as per the Fibonacci sequence of BAT are:
Potential reversal or buying zone: 0.00002098 to 0.00002006 btc (this should be used as stop loss as well)
Fibonacci projection or sell zone: 0.00002316 to 0.00002646 btc
Regards,
Atif Akbar (moon333)

The Secrets Of Ichimoku + XRP (Ripple Will Be Violent)Learn to trade with high accuracy and professionalism - just shoot me a message, the place I learned all this is only $149 a month (no shitty $2000 course rubbish). Selling pressure built over the last few years might mean an EXPLOSIVE uptrend over the new few weeks or months. Hold on to your hats!


XRP same pattern as previous bullrun. DOWN WE GOXRP is going back to 1950 sats if we follow the same setup as 2017.
I believe this cycle is exactly the same as the previous one.
Potential bottom after Reaccumulation phaseAfter two big pumps TKY's price is in a potential 4th wave elliot cycle.
An Inverse Head and Shoulders Pattern could signal the bottom of this accumulation period.
Volume is thin

XRPUSD Ripple | SWING - 13. Sep. 2020Hello my friend | Welcome Back.
Please support this idea with LIKE if you find it useful.
***
It may head to the downside if it does not break the 0.23141 support, it may head to the upside and break the downtrend to almost the upside. The target will be at 0.30000.
***
Here is the full analysis for this pair, let me know in the comment section below if you have any questions, the entry will be taken only if all rules of the strategies will be satisfied. I suggest you keep this pair on your watchlist and see if the rules of your strategy are satisfied.
Remember this analysis is not 100% accurate No single analysis is To make a decision follow your own thoughts.
***
The information given is not a Financial Advice.
BTCUSD Apple GBPUSD EURUSD XAUUSD AUDUSD
