XRPUSD Bullish MomentumXRP has seen some recent gains, this could be extended further as momentum continues. Price is currently supported by ichimoku cloud, also supported by a strong Linear regression uptrend of 0.91. Included a possible fib extension if price breaks out.
Ripplebtc

$XRP, Reached ~3300 sats w/ increasing volume after a R/S flip $XRP
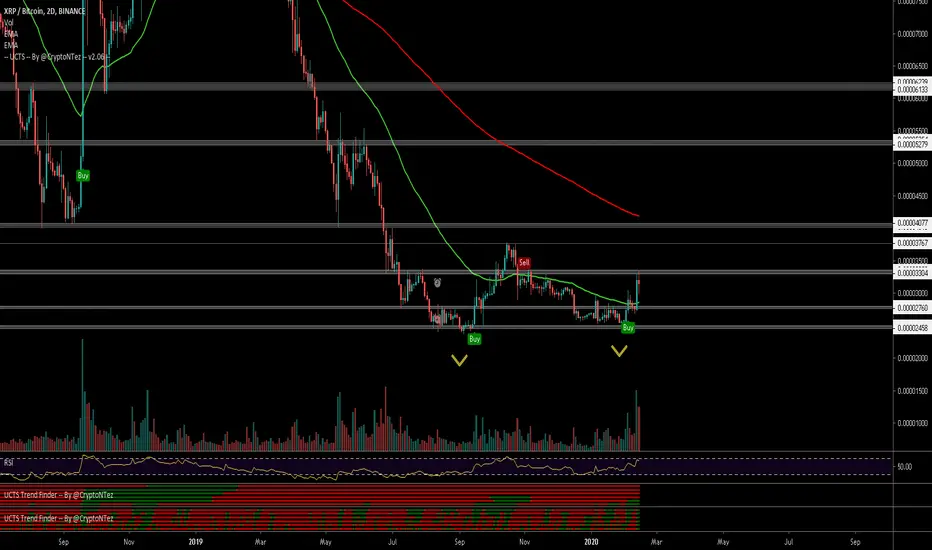
Next UCTS signal on the 2D and I'm longing/shorting no matter what... 😏
Reached ~3300 sats w/ increasing volume after a R/S flip at ~2700 sats
UCTS Buy signal on the 1/2D charts..
Looking for a breakout or R/S flip as continuation/entry for a new target at ~4k
Weekly looking like a double bottom aswell..
#XRP
XRP/BTC IdeaXRP finally breaking out of major descending triangle that has been forming since 2018. First major resistance area is 0.00004000 and do expect to test that area

Ripple: Buying Trade Setup.Ripple: Buying Trade Setup.
Note: This is only for Educational purposes; this is not investment advice.

So I Heard You Like Head and ShouldersCool multiple smaller inverse head and shoulder patterns within a possible larger head and shoulders pattern. Also it looks kinda like a smiley face :P

XRP/RIPPLE - LIFE CHANGING PATTERN 2 ***MUST WATCH VIDEO***Hi I am MartyBoots and I've been trading the markets for 13+ years
This is a followup to my first XRP video explaining exactly why we are going to moon on XRP/RIPPLE
In this video I want to show you the exact pattern to watch over the medium term
Then over the next few days I will make a video explaining the near term analysis and what exactly to look for .
XRP has formed a beautiful bottoming pattern , these opportunities don't happen often to get in on the lows of stocks or coins that have serious potential to move into a bull market . We need to grab these opportunities with both hands .
Do not miss this video because if this pattern plays out then this is the low on XRP before bull market moon time .
The price action and the moving averages are setting up beautifully. On top of that the indicators are also setting up .
DO NOT BE LEFT BEHIND WHEN THE XRP TRAIN LEAVES THE STATION
Please dont forget to like my content as it helps my work
Thank you
Of course none of this is investment advice , I am just telling you what I am doing .

XRP/BTC LONGSignal
XRPBTC
LONG
Open 2683;
SL 2635;
TP 2995;
Risk/Reward: 1/6.5;
Leverage:5x
The downtrend line is broken, price fixed higher. High volume. The first target is 3000 satoshi.

Ripple may be on the foot of the breakoutRipple forming head & shoulders patter. Volume is right neckline is descending. We wait for the formation of right shoulder to confirm reversal.

XRP/ RIPPLE - LIFE CHANGING PATTERN - *****MUST WATCH VIDEO*****Hi I am MartyBoots and i've been trading the markets for 13+ years
XRP has formed a beautiful bottoming pattern , these opportunities dont happen often to get in on the lows of stocks or coins that have serious potential to move into a bull market . We need to grab these opportunities with both hands .
Do not miss this video because if this pattern plays out then this is the low on XRP before bull market moon time .
The price action and the moving averages are setting up beautifully. On top of that the indicators are also setting up .
DO NOT BE LEFT BEHIND WHEN THE XRP TRAIN LEAVES THE STATION
Of course none of this is investment advice , I am just telling you what I am doing .


XRP Accumulation zoneXRP is currently in its previous accumulation / breakout zone. However this buy is not supported by a strong regression downtrend of 0.78. Ichimoku shows a thinning area where a bounce off the middle of the downtrend is likely. Best to buy and hold at this level if waiting for a breakout.

XRP/BTC - Bullish div., heels dip in support zone, long?Couple of signals pointing to a bullish reversal and indicating long position:
1. Bullish div on daily Price vs RSI
2. Stoch RSI oversold about to cross on daily
3. We are in support zone so you can place some buys
3 options:
1. Go long now (~ 2500 sats) before immediate blue falling resistance is overtaken - Risky
2. Go long after a close of daily and probable test above blue resistance (~2700 sats) - Less Risky
3. Wait out the next moves to confirm direction. If afraid of bull traps, enter on retest of flipped resistance at ~2970 sats level.
Lets see:

Ripple In December, we caught ripple in the zone 0.180-0.186
and after that we can see an interesting reversal formation with confirmed volumes that you can see on the chart
After we reached the price of 0.253 we went down to the 50% level of fibonacci. formed a falling wedge pattern and it is likely that we will come to the price of 0.237 in the next week
In the 4th quarter of 2019, Ripple's XRP sales fell 80% compared to the previous reporting period and amounted to only $ 13 million
Best regards EXCAVO

XRP:BTC on the Edge of Strong Upside MovementHello All,
In my previous analysis about XRP:BTC I mentioned that this appears to be accumulation. Well, presented in my chart, we can clearly see the double bottom outlined in purple and the current downtrend is actually a descending channel (light blue) which is bullish. It can be seen that price action has tested the upper trendline of this channel and so far the channel has held strong, however price has not broken the critical support denoted by the neon green horizontal line (this line corresponds with an inverted hammer on the weekly). Given the time frame that a person is trading there are strong opportunities to make significant gains on low risk.
In addition, I would like to mention that there is a strong trendline happening on the RSI in this timeframe which is a great sign of accumulation in this region. I suspect an upwards movement to test the price points of 2800 and possibly 3000. Since this is close to the support on the 4hr RSI it is possible that this is a buy opportunity, but a tight stop would need to be in place.
If the price breaks out of the descending channel, the price objective is approximately 3050
Best of Luck and Stay Technical!
Previous analysis:

January Ripple (XRP) Price PredictionPrimeXBT will now be offering a technical and fundamental analysis overview of Ripple (XRP) .
Fundamental Analysis and News:
Ripple's potential status as security has been a subject of debate for years.
XRP token has a strong connection to the fintech company Ripple, who has long been arguing that the XRP token is merely an open-source technology and that they have no control or influence over its price. They have also gone on record stating that they have not manipulated the price of the token in any way.
It is important to note that the American Exchange Commission appears to regard XRP as a security.
So, is XRP security? The answer still remains unclear, and will likely remain this way for many more months.
Technical Analysis:
XRPUSD broke through the major resistance level of the falling wedge we previously pointed out, with an upside target around $0.278 per token.
In the near term, the Relative Strength Index on the XRPUSD chart is flashing some bearish signs, and some decline is expected from the resistance line of the ascending channel with the possible aim of $0.225. Once the price reaches this level, a strong bounce could cause a surge to the next target of $0.2668.
XRPBTC is facing hurdles near the resistance line of the falling wedge. If bulls can put forth more effort and push the digital asset towards its next major resistance level, then the price may hit its target zone.
Local Support Level: $0.23.2
Major Support Level: $0.22
Resistance Level (BTC): 0.00002965
Target Zone: $0.26 - 0.295
Target Zone (BTC): 0.00003380 - 3770
Market Cap: $10 269 175 412 USD
Volume (24h): $2 798 572 169 USD
Circulating Supply: 43 653 776 034 XRP
Please, let us know what you think about Ripple in the comment section below.
The best way to get consistent quality analysis is to follow us.

No manipulationsHello everyone, this is our view on xrpbtc (s-c-a-m), enjoy!
Analysis:
This will be a good coin to hodl during next altseason, but now we're supposed to see a strategy of ours as well. So now let me explain: price going down a bigger bull flag, we're now approaching lower line and we'll bounce from there. Then a falling wedge could take place as far as the parabolic move we've seen completes. Very interesting volumes as well. The W gartley you see is fractal based and fibo levels are attendible, so we believe that we're going further more down. Marked a lower low and a lower high, that will be a streak! Smallertimeframes ma already formed death crosses while higher lenghts are not able to recover. No ema below the price, so no dynamic supports. First target of a long trend will be 200ma. Now trying to breakdown wma10, if broken could lead the price to next lower low. Near to the lower bollinger band and they're very stretched. Very big ichimoku cloud above the price, that's the wrong way. No fisher. Many laggings (chaikin, moneyflow, stochastic) are forming bull divergences, while rsi and uo formed bear divergence instead. Golden cross for stoch smooth 50. Bearish momentum marked by ao and also by macd. After a huge G accumulation now trying to recover some F in order to pump the price again on greed & fear.
Strategy:
We believe this is a very good *scam* project, so we have many possibilities for the bulls.
Entry: 2457-2364
Target (mid-term): 2536-2604
Sell (hodl): 2708-3093-3300+
Stoploss: 2303
Moderate risk for good gains.
Trade safe. Anlvis.

XRP is drawing same pattern as 2017! 320X gain? can you see how identical its drawing the pattern?!
Kindly share your idea...
thanks


XRP ANALYSIS! (BEARISH FALL BACK INTO WEDGE)XRP ANALYSIS:
XRP broke out of the falling wedge with a massive 15% rise, only to be rejected at the 50 MA. The rejection retrace ALL the way BACK into the wedge. This is not a good sign. If XRP is not able to jump back out and bounce off the 2675 temporary support, then I expect a further fall down to the low end support at 2400 sats. This would be a major double bottom and big buying point for the XRP community. I wouldn’t push an entry at the moment, until we see another break out of the wedge, or until bottom hanging support at 2400 is hit! 50 is below 100 and 200 MA and following a bearish pattern. For those holding an XRP existing position, remain in & keep your patience. Long term 3000+ sats will come, this is only short term bearish play.
Possible Entries: 2400-2450 sats

The Ripple Drop: Predictions for 2020PrimeXBT calls your attention to a technical analysis overview of XRP/USD .
Fundamental Analysis and News:
Ripple's Predictions for the Industry in 2020 and Beyond:
As we stand on the doorstep of a new year and a new decade, Ripple's executive team shared their predictions of what’s in store for the industry.
“I think you’re going to continue to see consolidation, you don’t need 3000 plus cryptocurrencies out there,” said Brad Garlinghouse, the CEO and Founder of Ripple. “I think the utility will bear out where you will see a migration to quality if you will. Technologies and cryptocurrencies that can scale with market demand with real use cases.”
Technical Analysis:
Ripple's price is still struggling to move above the $0.2000 level and all its recent attempts to rally have so far failed. The price is now approaching a key support area.
If XRP manages to surge above $0.2000 , it may visit its resistance levels at $0.2140 and $0.2300 .
On the downside, a decisive break below the $0.1850 level is needed for the bears to gain strength. The next major support zone is seen near $0.1800 - 0.1795.
In the near term, the Relative Strength Index on the XRPUSD chart may flash some bullish signs if XRPUSD declines to this support zone.
Local Support Level: $0.1900
Local Resistance Level: $0.1957
Support Zone: $0.1850
Resistance Zone: $0.1990 - 0.2025
Market Cap: $8 175 776 491 USD
Volume (24h): $1 103 740 007 USD
Circulating Supply: 43 337 903 409 XRP
The best way to get consistent quality analysis is to follow us. We’ll ensure that you don’t miss a thing!
We appreciate the continued support that PrimeXBT has received from readers and traders like you, and hope you have great success with all your future trades!

#RIPPLE He Faces Strong Resistance Please share your opinion in the comments box and do not forget to press the like button

#RIPPLE Wolfe Waves ! This is just an idea, not a recommendation
RSI : We are close to oversold
#BTCUSD : Wolf Waves

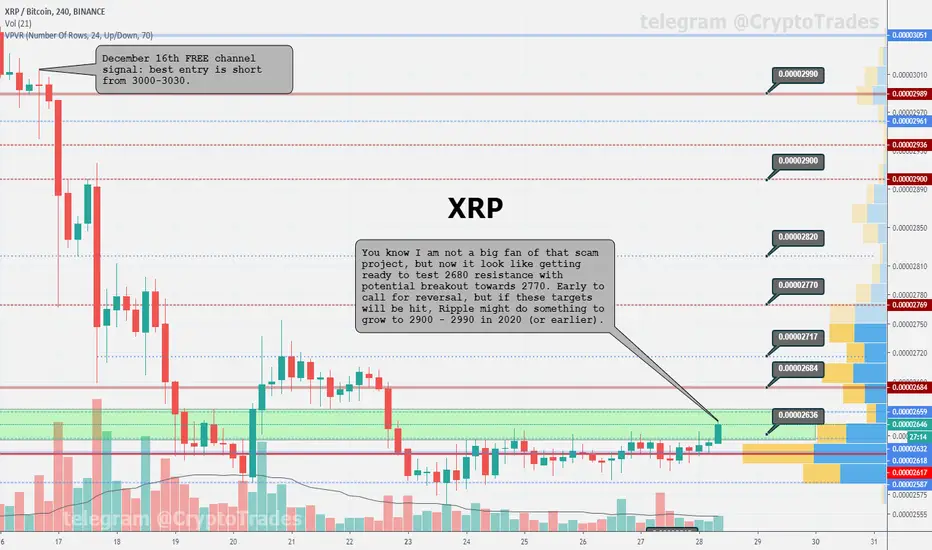
XRP bottomed?You know I am not a big fan of that scam project, but now it look like getting ready to test 2680 resistance with potential breakout towards 2770. Early to call for reversal, but if these targets will be hit, Ripple might do something to grow to 2900 - 2990 in 2020 (or earlier).