There is a possibility for the beginning of an uptrend in XRPBTCTechnical analysis:
. Ripple/Ethereum is in a range bound and the beginning of uptrend is expected.
. The price is below the 21-Day WEMA which acts as a dynamic resistance.
. The RSI is at 43.
. While the price downtrend in the daily chart is not broken, bearish wave in price would continue.
. The RSI downtrend is broken, so the probability of the Beginning of an uptrend is increased.
Trading suggestion:
. There is a possibility of temporary retracement to suggested support zone (0.00004900 to 0.00004100). if so, traders can set orders based on Price Action and expect to reach short-term targets.
Beginning of entry zone (0.00004900)
Ending of entry zone (0.00004100)
Entry signal:
Signal to enter the market occurs when the price comes to " Buy zone " then forms one of the reversal patterns, whether " Bullish Engulfing ", " Hammer " or " Valley " in other words,
NO entry signal when the price comes to the zone BUT after any of the reversal patterns is formed in the zone.
To learn more about " Entry signal " and the special version of our " Price Action " strategy FOLLOW our lessons:
Take Profits:
TP1= @ 0.00005800
TP2= @ 0.00006650
TP3= @ 0.00007900
TP4= @ 0.00008600
TP5= @ 0.00010250
TP6= @ 0.00012145
TP7= @ 0.00014050
TP8= Free
Ripplebtc

Ripple/Bitcoin (12 May) #XRP $XRP #BTC $BTCXRP is going down to zone 4010 and there is a high chance that there will be a quick turn to the 5000 zone. However, you should sell it here because I believe that in order to really reverse trend, XRP must re-test 4010 zone once again
4010 is still a good buyzone to hold long-term with targets : 6000-8000 as shown
Stoploss whenever XRP is lower than 4000


Ripple (XRPBTC) Broke the Symmetrical Triangle Ripple has broked the symmetrical triangle and continue in the downtrend.
Bitcoin dominance is killing all alts and altcoin market is tanked out.
The major support for XRP is 4000-4300 sats.
We may see a bounce back from these levels if Bitcoin goes sideways.


XRP ThoughtsXRP
Reached our inital target of 5.3K and flipped it to resistance. Next area of support is the EQ of this OB at green.


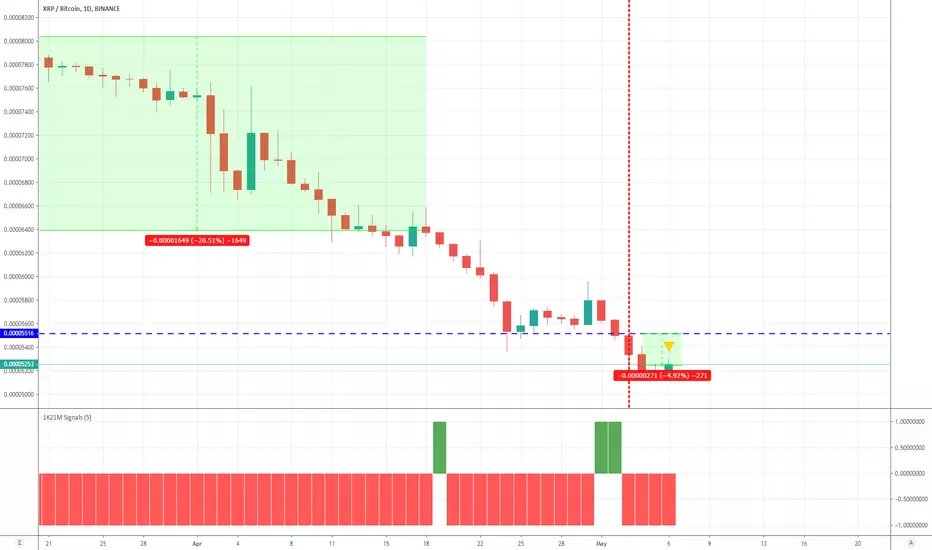
There is a possibility for the beginning of an uptrend in XRPBTCTechnical analysis:
. Ripple/Bitcoin is in a range bound and the beginning of uptrend is expected.
.The price is below the 21-Day WEMA which acts as a dynamic resistance.
. The RSI is at 29.
Trading suggestion:
. There is a possibility of temporary retracement to suggested support zone (0.0000515 to 0.00004500). if so, traders can set orders based on Price Action and expect to reach short-term targets.
Beginning of entry zone (0.0000515)
Ending of entry zone (0.00004500)
Entry signal:
Signal to enter the market occurs when the price comes to "Buy zone" then forms one of the reversal patterns, whether "Bullish Engulfing" , "Hammer" or "Valley" in other words,
NO entry signal when the price comes to the zone BUT after any of the reversal patterns is formed in the zone.
To learn more about "Entry signal" and the special version of our "Price Action" strategy FOLLOW our lessons:
Take Profits:
TP1= @ 0.00006100
TP2= @ 0.00006960
TP3= @ 0.00007900
TP4= @ 0.00008600
TP5= @ 0.00010250
TP6= @ 0.00012145
TP7= @ 0.00014050
TP8= Free

The Short of Ripple against Bitcoin continues...I think as bitcoin fades this week Ripple will suffer another blow. Our indicator indicates another drop in XRP - we saw a 20% drop in ripple against bitcon in the last month - while the 5% already accumulated may seem small - don't let looks deceive you.
Best regards,
Grey FX Empire
XRP / BTC - TURNING BULLISH AND HERE'S WHY - CryptoManiac101XRP / BTC TA
Here we're looking at several different indicators and fractals. Right from the start we can see that there are 3 distinct patterns that repeat. Let's go over them...
1. RSI - RSI is currently at 25 levels which has NEVER EVER been seen before on a weekly chart. Lowest we've seen was around 27 levels. With that said we still see similar RSI drops for Jan, Feb, Dec 2017 and Sep 2018 - ALL of which have been followed by a massive pump from 178% to 5,000% in a matter of weeks.
2. MACD - just like seen in November 2017 and December 2018 we're at downward channel for MACD with possible bull crossover in next few weeks.
3. MMAR - MMAR just like RSI and MACD show us nearly identical movement as before with MMAR 's turning bear red color just before an immense breakout was seen.
To this we can also add the trend line which comes in at roughly 4400 sats . We also have liquidity zone with double bottom in between 4200 - 5200 ranges.
What does all that mean?
If we just look at the patterns and indicators we're presented with, we'd say that a breakout should be expected within minimum of couple days to maximum of few weeks.
This is not a financial advice, just a simple observation of XRP / BTC
PRIOR XRP / USD / BTC TA

IF PATTERN IS TO REPEAT - TARGET 5000 SATS FOR XRP / BTCXRP has been performing horribly last few month. We've seen pumps which all have been sold into - not expecting anything MAJOR to happen this week. Perhaps next week we might see a sun rising but no clear signs as of today.

QUICK LOOK AT XRP / BTC - 5200 SATS OR BOUNCE OFF 5600?XRP on BTC pair is looking horrid as always. Seems like utility and flood of positive news has little to no impact on price. We are currently following similar pattern from April 22 which means that if 5600 support breaks, we will be one step closer to picking this one up around 5200 sats or lower with main liquidity grab located around 4000 sats.

XRP / BTC - SAME PATTERN - JUST ANOTHER DAYXRP looks good for entry on firm breakout from downward channel - even an entry when it will be close to the channel wall looks as solid entry
If you're not playing with leverage, manage risk depending on your situation

XRPBTC (2D): Be watchful at Ripple. The development at Ripple has been quite boring lately.
Many have hoped that the trend reversal is coming soon. However, technical analysis still advises caution.
There are still not enough positive indicators. Ripple broke the long term support down. And also the long-term Fibo 0.236.
The next support could be the short-term Fibo (0.236) at 0.00005814. Even if this does not hold, only the two long-term support lines at 0.00005110 and 0.00003166 are interesting again.
Let's see what happens. Happy trading. :-)

XRP - LAST ATTEMPT TO HOLD BEFORE 4000 SATS - CryptoManiac101XRP / BTC TA
It's very clear what's happening in the market a this time. It's either this support in form of trend line will hold and we see strong bounce within next 7 - 12 days or we inevitably crash towards our next demand zone of 4000 sats.


Ripple Hello to all traders, investors and other crypto enthusiasts.
Today I am publishing an analysis of the ripple/dollar. From the Polonex exchange because here we can see a long history of the movement of the coin.
If we talk about the chart, we can see a repeating yellow triangle that will be broken by a huge green candlestick up.
First fibonacci level at the price of 97cents
Target until the end of summer at least 1 dollar. Therefore, while we are in the triangle, this A good opportunity to add a coin to your portfolio.
The cross of two MA100 and MA50 movings in D1 chart is also a signal to buy
Stochastic RSI turned around and most likely will grow
There is a lot of news for the flight of the coin right now, but as you remember from history in most cases the pump happens without some big news.
So the best strategy right now is position trading SWING Trading and now is a good entry point
For example, I want to show the story you can see on the real chart.

XRP-BTC fuel filled for launch at Support - Massive upsideBullish Reasons
Chart self explanatory
Entry based on Boll/RSI/MACD or personal entry strategy to maximise gains.
Recommended SL - Below 0% Fib level or based on personal Risk Management Strategy
-----------------------------------------------------------------------------------------------------------------------------------------------------------------------------
If you like this idea, give me a thumbs up. Also have a look at my scripts
AI Lite indicator which populates BUY/SELL signals on chart based on a high probability system
Levels Generator with Fibs script that plots automatic support resistance levels for any timeframe with option to plot manual Fibonacci levels
Levels Generator with Fibs


So, its now or never 4 xrpee imo. All the bad stuff that couldve happened 2 xrpee, has maxed out imo.
Were seeing constant butchering of sat value.
The only way xrpiss is maintaining its value is thanks to the rise of bitcoin, thats elevating the $ value of this asset(liability),
So My call is - Long now, its now or never for Schwarz.
My Average entry is higher than the market price.
Gluk 2 us all and may the fsm take care of us.
