xrp price analysis (falling wedge soon breakout ripple)hey guys I can see falling wedge pattern in xrp 4hr chart but we needs to wait for breakout from wedge perfect and strong support level is around 8600_8900 sats xrp can dip to this level so buy at this price
if ripple breakout from falling wedge its price will shout up and bitcoin is also doing well so xrp will do even more well once its done breakout from wedge we need xrp to breakout with good volume so need cmf histogram to form upside of the chart, we can easily expect 200% profit from ripple once its start its another bull run
Good Luck,
stay bless.
Ripplebtc

Expecting an XRP/Ripple rise after hitting 9100We can see that when the price hits the rising trend line, it bounces up. I expect the same pattern will play out around 9100.


Ripple TrendsLooking at the daily chart for Ripple and trying to establish some possible macro trend lines.

Death cat bounceXRP will never reach 2 dollars again. Has not value and banks don't want to use it.
I'm selling to a loss. Good luck.

!XRP – Perfect wave analysis confirmed - Learnings/what's nextDisclosure: this is a repost of my Feb 10 Tradingview idea. It received over 2500 views but was taken down by admin because it contained some external links. Until today, I always included links to i) my website, ii) interesting other sources. Unfortunately, my ideas that contained links have now been hidden (it's against policy). Given that I found the post a very instructive & educational example, I decided to repost it - albeit 6 days later than the original post. See below for the (almost) full original ;-).
Post of Feb 10:
"Hi guys, this one is a crucial one! I really recommend you read this post until the end. Because… you will learn a hell of a bunc h on technical analysis! In my opinion that’s what we’re here for, & I want all of you – including myself – to become better traders & investors.
Let’s get the party started ;-) -->
In our initial post of Jan 22 , we called the last correction leg (leg “C”) in our Elliot wave analysis. We slightly adjusted our target on Jan 30 , & today we can see the perfect confirmation : a new impulse wave has started upward, ending leg C, beginning a new wave 1.
So in short: we ended the “correction" wave as we predicted and are now in wave 1 of a bullish “impulse" wave. (Feb 10 on the graph above)
The conclusion of our post on Jan 22 was simple:
--> "It is best to sit back some more while leg C is developing, & jump back into XRP when indicators such as MACD & the start of a new first wave leg confirm a bullish reversal."
In our post of Jan 30, I stated in the title " (!) XRP almost at crucial bullish reversal (>+100% potential) "
--> ... and we weren’t lying!
NOW --> Just have a look at our latest graph here above and you’ll see both the ending of leg C ànd a bullish confirmation in the MACD by a “golden cross” (blue line crossing red line with blue coming on top, and this just below zero) on the daily!
————
Let’s recap what we have been seeing right up until now:
1. Jan 22
Applying Elliot Wave Theory ("EWT") to the Ripple (XRP) graph clearly shows us that a C-correction leg is forming, after which a new upward impulse wave can start. You can find the full explanation (incl. ElliotWT) in detail by clicking on the chart:
--> You can also clearly see the movement of the five subwaves in the upward impulse wave, followed by that ABC correction.
2. Jan 30 - "(!) XRP almost at crucial bullish reversal (>+100% potential)" (post was hidden due to external links)
--> Closing in on the end of leg C & a bullish confirmation in MACD to confirm! (imagine graph below but without wave "5" in leg C)
3. NOW / TODAY (Feb 10)
—> The bullish cross in the MACD can’t be more obvious !
—> The downward trend channel is broken ! This is the channel that connects the top in (5) on Jan 4 with the end of leg C on Feb 9.
—> We are on the bottom of the Bollinger bands , meaning there is most likely only one other way to go: up! ( Boll. bands = the green "swingery" bands with a red line in the middle)
—> We see the bullish CCI trending upward
4. What’s next:
—> We’ll see more upward movement soon, but remember that also the upward impulse wave has its “red” correction legs.
—> We see the closing of the last candle here is at the 50% Fibonacci line. This one we will have to overcome before we can push through to the next target on the Fibonacci 38,2% (on the daily)."

XRP/BTC No Thank You, Not Yet...Good coin for the banks and instiutions; good coins for traders like you and me. However, now is not the time. Trading is about ideal entries with the lowest probable risk. Jump the gun and lose, or lets watch the market decide. I will be swing trading and posting more in-depth updates.
--longmoney

Possible Inverted head and shoulder forming in 15 mins chartPossible inverted head and shoulder forming in 15 mins chart but only confirmation with high volume. Trade with care and risk management

Ripple 15 Dollar soonPossible Idea for ripple
could reach 15 $ area
could be longer time than what i proposed
let's see what's gonna happen


Ripple (XRP) Showing bearish signals on the 30 minute chartHistogram showing bearish signals together with the macd crossing the signal line. RSI tried to break to the upper side but bounced off the 50 multiple times showing not enough strength. Short term the 8, 13, 21 are all below the ma 55 showing a downtrend at the moment. This makes me conclude that XRP is currently bearish.

Ripple breaking upwardsAs was expected the XRPBTC pair gained volumes in the support zone and moved upwards, staying above the 200 days EMA, 61.8% Fibo and 0.0001 psychological level.
Now the pair is testing the 0.0012 resistance (also 50% Fibonacci level), and regarding the high volumes and upward momentum seems to be breaking it.
In case of breakthrough - next resistance would be around the 0.00015 level, which coincides with the 38.2% Fibonacci retracement of the global uptrend. Minor resistance is on the 0.00013 (last peak).


XRPBTC. New upside coming?Xrp, a new small uptrend.
My vision is the one shown in the graph.
In order to see an upward movement, it must exceed the level of fibo 0.236

Is Ripple preparing for launch?Ripple is already known as safe heaven of cryptocurrency market. In last couple of weeks this corelation (Bitcoin down, Ripple up) fade out. Probably because whole market plunged.
But if You look closer on XRPBTC, You might see a crawling bull market ahead. Pair has created a huge triangle which is already breaking from the top. Looking on the orderbooks on Bittrex and Binance we can clearly spot a growing demand near the 9000 satoshi.
Going long right now might be quite risky but XRPUSD is definitely an asset which should be observed in next couple of days.

Ripple , Great Long-Term Hunting Opportunity in #XRPBTCTechnical analysis:
RIPPLE is in Range bound but Resumption of uptrend is expected.
The price touched the strong downtrend line in Daily Chart . It is below the 21-Day WEMA which acts as a dynamic resistance.
The RSI is at 37.
Trading suggestion:
There is possibility of temporary retracement to suggested support zone (0.0000869 to 0.0000582), if so, traders can set orders based on Daily-Trading-Opportunities and expect to reach short-term targets.
.Beginning of entry zone (0.0000869)
.Ending of entry zone (0.0000582)
Entry signal:
Signal to enter the market occurs when the price comes to "Buy zone" then forms one of the reversal patterns, whether "Hammer" or "Trough" , in other words,
NO entry signal when the price comes to the zone BUT after any of reversal patterns is formed in the zone.
To learn more about "Entry signal" and special version of our "Price Action" strategy FOLLOW our lessons:
(We have started to prepare these lessons in TradingView. If you want us to continue, give us feedbacks!)
Take profits:
TP1= @ 0.000128 (First Target)
TP2= @ 0.000146 (second Target)
TP3= @ 0.000178 (Third Target)
TP4= @ 0.000229 (Fourth Target)
TP5= @ Free

Ripple-Bitcoin - the Correction continuesHi, friends. We're still in correction. There is nothing worrying about that. This is a normal market situation. Good buy area it's a rectangle

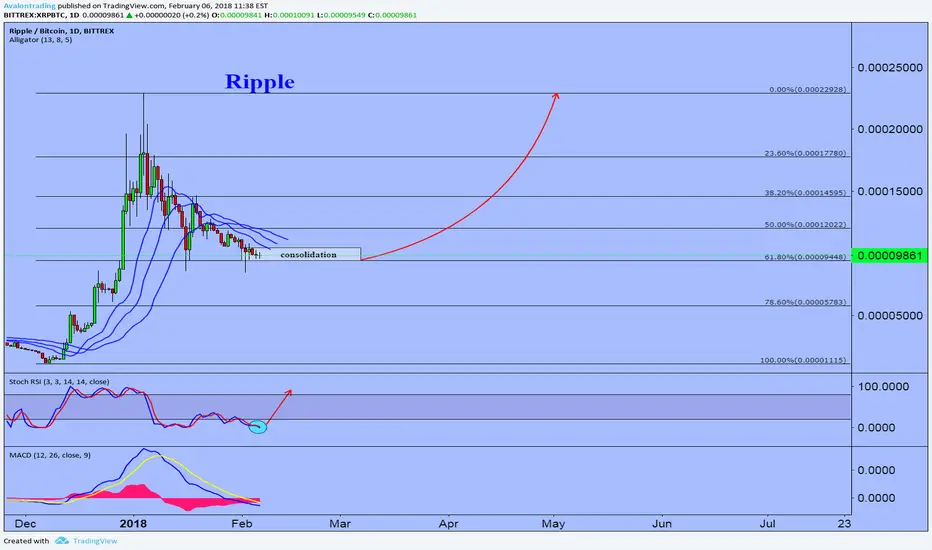
XRR - RIPPLE Short Term Profit ForecastRIPPLE XRP needs to hold the 61.8% fibo support area to change trend and stay on the upside.
As long as it holds that support level we can definitely see the price going towards the 38.2% fibo resistance
area for short term profits. There will be some testing done when it approaches the 50% resistance level
and buying volume will play a big role here to push the price upwards to reach the 38.2% Fibonacci, But until and unless
the over all trend and sentiment changes about the crypto currency it will stay range bound till that time.

ABCD Pattern on XRPUSDWe will know within the next week or so how likely this setup is... either way, if it falls below that risk level, get out! If it continues falling it will most likely only fall shortly until the RSI hits 30. I'll keep this post updated.

Ripple - All indicators are bearish, bullish cycle is over.Hello,
So It seems like the bullish cycle is over. The daily MACD is bearish, the coral trend indicator is bearish and volume is decreasing.
This cycle looks exactly like the previous bearish cycle and based on that we can tell that a downtrend for the next couple of month is a really high possibility.
Here is my previous ripple analysis.
Good luck,
DCFreak


XRPBTC RIPPLE GO UPas you can see trendline upwards. it will continue and we will see the green pipes as wel.
we support at
Target : 0,00013875
Success on profit
