📈 RIPPLE GO LONG UP! 😍My personal analysis and opinion about the ripple rise is positive. XRP had created a double bottom in 1h time frame and it may reach "1.8" resistance and break it. In total, breaking out or not the resistance of 48,200 bitcoins can also be effective. 👌❤️
Ripplebtc

XRPBTC Inflection PointThe point of inflection can be identified where price separates and is a change of convex to concave
Essentially at the point of the fib circle (1) where a change in direction of curvature occurs
This has previously proven how price acted bullishly after this
Now it has happened again within a stronger fib trend
Bullish results?
MOON XRP

XRP TO 2 USDT HELLO COMMUNITY
we are near of the breakout of the 0.8 major resistance
if it's broken a big probability to see xrp in 2 usdt
thank you

XRP MACD Bullish Cross!!! Win!Hello IWealth Here, I have been Trading and Teaching for 7 years. and im happy to share my idea that could help you in the crypto space.
------------------------------------------------------------------------------------------------------------------------------------------------------------------------
XRP is looking great because on the 2 day chart we have a bulling cross on the MACD, the momentum looks to be shifting to the upside now since it been oversold and low for a while. I expect a bullish month for august for xrp!

AXIE INFINITY THE NEW ETH? :) I have proof AXS is grwing fast and its gonna be bigger. around $22! $65 i garrantee in sept! But it will reach over $100! i buyed 18424 AXS when it cost around $3 so its 204% profitt and groving! For more only 20 bucks for life.
This one is for free and paypal accounts needs! :)

Xrp Bullish Trend 1.29$ is valid.This is the season for rocking trends aka bear trends collecting. It is collected here and sold in the hills. TP is taken while going up.
Since it is below, those who buy at $2 will not sink for free. Let's say they sold them, I will buy them myself.

Ripple - what's next? A big wave down? 😵😵The Ripple chart shows a strong support level of $0.587. XRP is starting to push towards that level, which signals that the move downward may continue.
If the price breaks this level and tests as resistance, it would be a good opportunity to sell.
The target for this move is low at $0.5, there might be enough liquidity for buying, if there is a strong volume increase in this variant, you can try to go long.
Write in the comments all your questions and instruments analysis of which you want to see.
Friends, push the like button, write a comment, and share with your mates - that would be the best THANK YOU.
P.S. I personally will open entry if the price will show it according to my strategy.
Always make your analysis before a trade

XRP - You can try to open a trade after a squeeze and retest 🚀XRP, like bitcoin, has not seen significant movement on the chart for several days. The price is currently trading near the bottom of the triangle. It is likely that BTC will go up and altcoins will also go up.
If XRP comes to the upper boundary of the triangle and starts consolidating near it, that would be a good buying opportunity, even better if the price breaks through it and tests the triangle as support. If all these factors materialize, Ripple could quickly reach the above targets!
Write in the comments all your questions and instruments analysis of which you want to see.
Friends, push the like button, write a comment, and share with your mates - that would be the best THANK YOU.
P.S. I personally will open entry if the price will show it according to my strategy.
Always make your analysis before a trade

XRP About to BLAST offXRP has been staying flat above the major support at 0.60$. This is a bullish sign since we are above the major support and we believe we will se 0.80 then $1 sometime this month!

XRPBTC Steps toward a massive breakoutComparable point in green circle
Using this point we can draw conclusions about possible next price movements
using 1,2,3 for reference we may be able to exit the 1.618 fib circle, leading to a further breakout larger than the green bars pattern
HODL XRP!!

XRP Divergence and Trend AnalysisXRPBTC is showing a bullish divergence
While XRPUSD is struggling to hold above 0.5 Fibonacci retracement level
I believe this level will hold and XRP is headed a lot higher, it just may take some time. The bullish divergence on the BTC pair is evidence for this assumption.

Ripple going back to the 60 to 40 cents range. XRPUSDT is currently in a strong downtrend as show by the red line of the hull suit indicator.
We have a very bearish kumo twist right ahead in the ichimoku cloud, further signalling a continuation of the downtrend.
Also, there seems to be a bear flag pattern forming in the last few days.
Considering all this, and XRPUSDT past performance, I'm betting for a short-term DUMP that will put us in the 0.6 to 0.3 range for a while.

XRPBTC RSI Vs PRICEPrice looks bullish with a potential bullflag
RSI suggests a downward move with a head and shoulders structure
Regardless XRP is very cheap at these levels and can be seen better on the USD pair of XRP, i will link below

XRP looks like it will run on top the next really! Look at XRP today. We are currently crossing our MA resistance and pumping our way higher to the next fibo resistance.
So xrp has in the lást months a lot of problems with sec. It looks like we will see some news in the near future regarding the lawsuit.
A good conclusion would instantly push the price to new highs. So keep in mind. we are up already 10%. Maybe cost average would be a good way to get the risk away.
As always have a nice day and leave a follow for daily news

XRP slides beneath $1, but bulls lock eyes on $1.2Ripple remarkably cleared the path to $1 after the nerve-shattering breakdown to $0.65. Moreover, the price lifted to $1.07 before losing momentum. On Wednesday, the primary battle was to keep XRP afloat at $1, although bulls lost the bid.
A correction came into the picture, forcing Ripple to explore the area under $1 again. The previous support at $0.9 played an essential role in preventing declines from extending further. Meanwhile, XRP trades at $0.95 amid, as bulls plan another takeover.
Ripple eyes another liftoff past $1
XRP bulls might have lost the fight above $1 but remain relentless in the mission to hit higher levels at $1.2 and $1.4. The technical picture currently sends mixed messages, especially with the Moving Average Convergence Divergence (MACD) stuck under in the negative region.
This technical indicator identifies positions to buy the dip and sell the top. For instance, a buy signal occurred following the bounce from last week’s support at $0.65. The call manifests by the MACD line (blue) crossing above the signal line.
Note that the trend would have tuned massively bullish if the indicator cracked into the positive region.
With the MACD line likelihood of sliding under the signal line, the bearish grip will become stronger.
A break above $1, a resistance highlighted by the 50 Simple Moving Average (SMA), would call more buyers into the market. A surge in the tailwind force is bound to bolster Ripple past the critical $1.2 level and perhaps resume the uptrend heading to $1.4.
Ripple intraday levels
Spot rate: $0.95
Trend: Bearish biased
Volatility: Low
Support: $0.9, $0.8 and $0.65
Resistance: $the 50 SMA, $1.2 and $1.4

Possible dip in xrp0.00001576 is an important line, it's yet possible for btc to retrace to 18_25
So dip in xrpusdt in my personal point of view is at 0.28_0.4 for spot, for future it's 0.32,
Reply to this idea if and only if you have similar idea,
Otherwise this idea means nothing and it's not financial advice at all

RIPPLE: BEARISH CHANNEL - WAITING REVERSAL - LONG SETUP 🔔Welcome back Traders, Investors, and Community!
Check the Links on BIO and If you LIKE this analysis, Please support our page by hitting the LIKE 👍 button
Traders, if you like this idea or have your own opinion about it, please write your own in the comment box . We will be glad for this.
Feel free to request any pair/instrument analysis or ask any questions in the comment section below.
Have a Good Day Trading !

UPDADE: RIPPLE SETTLEMENT FEASIBLE IN NEXT TWO WEEKS!SEC V. RIPPLE SETTLEMENT FEASIBLE IN NEXT TWO WEEKS, SAID TOP LAYWER
“My prediction is that if Gary Gensler is going to pull back from this lawsuit and instead work for more regulatory clarity – it will happen in the next 2 weeks.”
new-york-city
Attorney Jeremy Hogan, a lawyer who has been covering the SEC v. Ripple lawsuit from the beginning, has predicted that if the new SEC Chair, Gary Gensler, chooses to settle with Ripple, that should happen within the next two weeks.
FinanceFeeds covered Mr. Hogan’s remarks in March, when he raised attention to two bombshells dropped by the Judge, consenting on XRP’s currency and utility value. With currencies and securities being two different things, the SEC’s argument that Ripple is security may lose its credibility.
This time, Attorney Jeremy Hogan commented on the most recent legal round, in which Ripple put the SEC to shame for making deliberate omissions and misquoting the Judge.
Ripple’s Memorandum of Law in opposition to the SEC’s motion to strike Ripple’s lack of due process and fair notice affirmative defense was a “Mona Lisa, a piece of art”, the attorney said.
The affirmative defense is important because if the Court finds Ripple lacked Fair Notice, the case is over even if the Court thinks XPR is a security, he explained.
At the end of the video, Attorney Hogan shared his prediction regarding the timeline of the lawsuit, depending on the SEC’s new Chair Gary Gensler strategy for the regulator: to pursue further regulatory clarity or go full steam ahead.
“My prediction is that if Gary Gensler is going to pull back from this lawsuit and instead work for more regulatory clarity – it will happen in the next 2 weeks.
“If we go into June with no settlement then this lawsuit has been adopted and supported by Chairman Gensler for better or worse. If that is the case I predict no settlement until September at the earliest”, he continued.
“If there is no settlement and we go to summary judgment or trial I predict…well, heck I don’t know – do I look like a mind reader?”
SEC’s new Chair, Gary Gensler, is described as “one of the leading reformers after the financial crisis” as he led the CFTC in implementing the Dodd-Frank Act of 2010 and rein in abuses in the swap derivatives market.
Then, he pledged to work to “urgently close the gaps in our laws to bring much-needed transparency and regulation to the over-the-counter derivatives market to lower risks, strengthen market integrity and protect investors.”
Regarding regulatory clarity, the CFTC is watching the lawsuit as it will help to establish the scope of the SEC’s authority in the digital assets space”, said Commissioner Stump.
Also in the context of the SEC’s lack of clarity, XRP holders’ lawyer John E. Deaton said it “doesn’t take an expert to see that plenty is very wrong, very corrupt and very outrageous about the SEC’s lawsuit against Ripple”.
Ripple CEO Brad Garlinghouse has recently said the lack of clarity in U.S. regulation of cryptocurrencies is “frustrating.”

XRPUSD:200 weekly MA is line in the sand. follow it.200 weekly MA is line in the sand. follow it for good trades. watch & see

Ripple price back to the drawing board, recovery to $1.6 begins Ripple seemed to hold above $1.2 amid the trading on Wednesday. Ripple had shown resilience for a few days as it controlled the correction from $0.71. Several tentative anchor zones had been established, including the confluence formed at $1.4 by the 50 Simple Moving Average (SMA), the 100 SMA on the four-hour chart.
The flash drop continued under $1.2 and $1 before finding support at $0.85. Note that the declines in April were halted at this level, allowing the bulls to take control, bolstering the cross-border transfer token into a trajectory to $0.76.
Ripple exhibits signs of recovery
The international money remittance token has bounced off support at $0.85 and currently trades at $1.07. Holding above $1 is key to nurturing a recovery mission. Moreover, bulls must step above $1.2 to validate the uptrend and revitalize speculation for gains back to $1.6.
According to the Relative Strength Index (RSI), recovery is expected to come into play. The trend strength indicator also identifies oversold and overbought conditions. With the RSI recoiling from levels slightly under 30, the bullish grip is getting tighter. Consequently, the movement toward the midline and the overbought area will suggest that bulls have the upper hand.
It is worth mentioning that the Moving Average Convergence Divergence (MACD) still has a bearish outlook. This indicator tracks the trend direction and measures its momentum. The MACD is helpful when identifying positions to buy the dip and sell the top.
For now, the signal is still bearish and calls for caution among investors. However, as soon as the MACD line (blue) begins to cross above the signal line, the recovery will be confirmed.
Ripple intraday levels
Spot rate: $1.1
Trend: Bullish
Volatility: High
Support: $1 and $0.85
Resistance: $1.2 and $1.4

XRP reaching resistanceThe 1.618 FIB coincides almost perfectly with the level of resistance that stopped Ripple's move up last November.
We can also see a bearish divergence on the RSI. Thus indicating we might see a pullback here. Where I'll be targeting the 3100 sats level as support and a valid entry point. With a SL placed just below the previous high and the 2.618 as a target zone.
What are your thoughts on XRP?

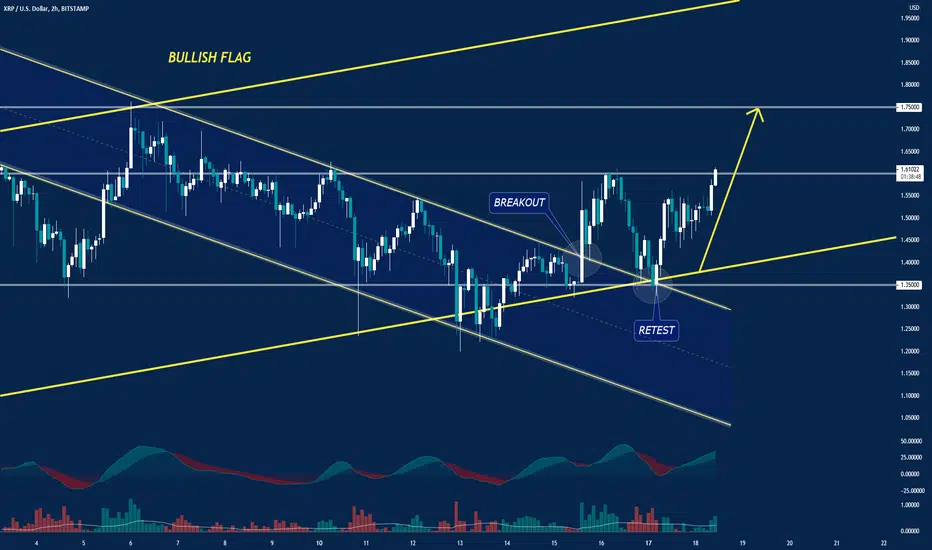
RIPPLE:BREAKOUT AND RETEST BULLISH FLAG - LONG SETUP UPDATE 🔥🔥Welcome back Traders, Investors, and Community!
Check the Links on BIO and If you LIKE this analysis, Please support our page by hitting the LIKE👍 button
Traders, if you like this idea or have your own opinion about it, please write your own in the comment box . We will be glad for this.
Feel free to request any pair/instrument analysis or ask any questions in the comment section below.
Have a Good trading day!
XRP lethargic trading draws closer to 130% liftoffRipple’s consolidation between $1.2 and $1.6 is still underway. The massive weekend losses in the cryptocurrency market affected Bitcoin and Ethereum the most as XRP embraced support at $1.3. However, the bearish wave sabotaged the intended upswing to $1.6; thus, a correction kicked off on hitting the resistance at $1.6.
Ripple prepares for colossal price action to $3.5
The cross-border token exchanges hands at $1.52 after stability returned to the market. More importantly, XRP trades at the apex of a symmetrical triangle. This pattern has both a bearish and a bullish impulse.
Two trend lines form the symmetrical triangle, connecting sequential peaks and troughs. As the trend lines converge, the asset tends to consolidate. A breakout comes into the picture when the price strikes above the upper trend line. It is validated by an uptick in trading volume and has an exact target measured from the triangle’s highest to lowest points.
For instance, if Ripple breaks above the triangle’s upper trend on the four-hour chart, it could swing 130% north to trade a new all-time high of $3.5. Meanwhile, the Relative Strength Index (RSI) validates the gradual upward price action by extending its movement above the midline while closing the gap to the overbought region.
The Moving Average Convergence Divergence (MACD) shines a light on sideways trading, suggesting that it would last longer. The uptrend toward $2 will become apparent as soon as the price settles beyond the seller congestion zone at $1.6.
Ripple intraday levels
Spot rate: $1.52
Trend: Bullish
Volatility: Low
Support: $1.3 and $1.
Resistance: $1.6 and $2
