Ripple Machine Learning 3-Day Crypto SignalThe rolling three-day signal for Ripple (XRP) is "Don't Own". This is day ONE of the three-day signal. The signal will be updated and shared again on Sunday. For further details or discussion, feel free to leave any questions or check out signature/profile.
Rippleforecast
Ripple Machine Learning 3-Day Crypto SignalThe rolling three-day signal for Bitcoin (BTC) is "Buy". This is day two of the three-day signal. The signal will be updated and shared again on Thursday. For further details or discussion, feel free to leave any questions or check out signature/profile.

Ripple You Are Cleared For TakeoffAfter what can only be described as a dismal three months for Ripple investors who bought into the hype in December - January, there may finally be a light at the end of the tunnel. Looking at the chart, you can see that Ripple finally and clearly broke through the downtrend channel that plagued the cryptocurrency for months. Further, like most of the other cryptocurrencies, Rippple is showing an ABC correction pattern. Unless Ripple takes a major nose dive in the next 2 weeks, it looks like the majority of pain is over and we should see a slow and steady uptrend from here.

XRPUSD (RIPPLE) poised for a bull move? 4hr tf analysisRipple's (XRPUSD) sell off terminated at ~$0.53 which is within the Weekly and Daily support area that I mentioned in this post:
Price close at ~$0.53 has been determined to be a possible termination point of a minor wave C. Target area for the current upswing is shown here as between $0.77 and $0.82. Failure to move above this resistance could see price return to the support area between $0.57 and $0.41. If price closes and holds above $0.82 (upper range of the target area), XRPUSD could possibly reach ~$1.20


RIPPLE XRP 220% Profit Possibility without Downward Break - (M)This is a Medium Risk trade mainly because of Bitcoin's instability. Unfortunately Ripple has been dependent of Bitcoin's health more then some other coins we hold.
Will keep my followers updated on this trade.
Do not invest what you can't afford to lose. We are not your financial advisors.

RIPPLE XRP/USD - BIG MOVE COMING! Wave 5 on the HorizonEveryone should look at the Ripple/USD chart in Log scale dating back 1 year to see whats really going on.
Its EXTREMELY Technical and is following the trend to perfection.
Say what you want about Ripple but you cant deny the BIG Moves it makes when its all gas'd up.
To me, its just a money making opportunity. I get in and get out.
We are in a descending wedge from the last correction and its about to break up. It wouldnt make sense for it to break down below the trend line that its followed for the past year when we're not at the end of it yet.
It would have to be squeezed out of it at the top which if you follow my trendline to the top this should happen around may which is when we will see the real correction take place. This last one was peanuts IMO
Also, this pattern lines up perfectly with the FIB so if my TA is correct im seeing a top around $8-$10 as hard is that is to believe but i cant see it play out any other way being its so technical.
***NOT FINANCIAL ADVISE... This is just my humble opinion. Ive been wrong many times, and i may be again, but this one is hard to ignor.
Id love to get the opinions from others if you see what im seeing
Happy Trading Ya'll!

XRPUSD not in the clear yet: Short tf (4hr) analysisXRPUSD's correction after making a high of ~$3.16 on Jan. 4, 2018 (Ripple) can be described as a double zigzag Elliott wave structure (A-B-C-X-A-B-C). Price action is currently in a minor wave C position (last leg of the correction that is not yet complete).
The implication of the above is that XRPUSD should continue to sell off. Weekly and Daily tf (not shown on this chart) support are present at ~ between $0.57 and $0.41 so perhaps a great probability that XRPUSD will target this support region.
Support as drawn on this 4hr tf chart is present between $0.66 and $0.75 which should be broken as part of the process of completing minor wave C position before any bullish move can be sustained.
This analysis will be subject to revision should XRPUSD close first above $0.98 (POI) before reaching the target area ($0.57 and $0.41).
POI = Point of invalidation at which this analysis will be reviewed.

Quantamize Machine Learning Crypto Signal Ripple Update 3/9Quantamize proprietary Machine Learning algorithms have generated a 3-day "Buy" signal for Ripple as of 3/9.
We will be updating and producing more signals today and posting performance as well - stay tuned!
Quantamize's machine learning algorithms produce signals on over 25+ cryptocurrencies with accuracy rates above 60%.
Any updates to this 3-Day forecast will be shared, as signals are re-run daily.
We will be rolling out this product for 25+ cryptocurrencies as well as 4+ crypto portfolios in the coming weeks. Our website is in the signature below or check out our profile (or simply Google 1.44% us). We are collecting emails to update users when we release our suite of cryptocurrency products - - sign up to receive an alert when the cryptocurrency products are released.

Start Accumulating Ripple around Yellow ZoneXRPUSD is trending downwards with overall Market. Its especially weak against major cryptos.
Expect consolidation around Yellow Zone. Confirm uptrend only after the break of Red Line / Zone.
Profit Targets Green Line & Green Zones.
Further continuation looks unlikely for now.

Ripple before Strong Impulse!Hello Traders!
Accurately predict, that correction phase soon should be over. Present time we see the end part of corrective B wave formation.
Suppose, we near the powerful bulls impulse! Ripple wake up & live!
Powerful Traders decisively take a long position for 2.60000$;
"Short term target": 1.60000$.
"Middle term targets": 2.00000$;
"Long term targets": 3.00000 - 3.40000$.
Subscribe to "Powerful Traders"!
Everyday, nine Tengri's traders, creates professional analysis, specializing on Elliotte wave theory, Technichal analysis,
Volume Spread analysis, Market Profile, Depth of Market, Order flow & Footprint.
We trade in all financial markets, there are no boundaries or limitations.
Join us!
«« «« «« «« «« Hold Like! »» »» »» »» »»
(If you have questions, comments, write, reply thoroughly!)
You're welcome!!!
Best regards, the team Traders "Powerful Traders".


Ripple - a wee whitecap or surging swell?!? (what's to come)Good Morning! Lets take a look at BINANCE:XRPBTC !
Looking at the chart above I have identified triangle patterns all the way back to early December 2017. We can also see triangle patterns inside of triangle patterns (coincidence... no, it's beautiful geometry and fractals, haha) Looing at the large descending triangle we can see that we are forthcoming on the fringe of the point! And the very last candle just barely broke through the top of the triangle!
Is this just a small whitecap or will this become a surging swell?
The RSI is turning up (and producing higher lows), the ROC is about to cross the support line (also producing higher lows), AND the MACD just touched and is turning up. ALL are very positive signs and could show us a potential bullish run is about to occur.
We could still see BINANCE:XRPBTC touch the support line again soon but when price is falling and the MACD is rising that is a positive sign as well. SO, If you wanted to take the chance now would be a good time to buy with setting a stop loss just below the support line. If we fall below the major support line we could drop significantly, however, all signs are positive and if we bounce we could see a nice bull run begin to form and see a ripple create a new wave.
Any and all comments are welcome!
Happy Trading :)
BINANCE:XRPBTC
Much Love
DustyPH
***This information is not a recommendation to buy or sell***
*Please leave a comment and let me know what you think!

Bitcoin bulls over Ripple...A short story!BITTREX:XRPBTC
A descending triangle breakout is likely and this will trigger a downtrend..
A bullish ABCD in the 4-hr chart also enhances this theory with CD leg in the process of completion
The potential reversal zone is market which can trigger a small up movement , but the ultimate downward longer term target is 0.886 level..!

XRPUSD (Ripple) short tf (4hr) analysis: Bullish biasThe downtrend in Ripple (XRP) that started on Jan. 4 2017 at a price high of $3.31 to $0.59 on Feb 6 2017 can be described as a 3 wave (WXY) Elliott wave pattern. This implies that a move back up from the end of wave x (in red color) will either be a 3 wave move back up or the start of an impulsive move (pointing to an uptrend).
Either way, both scenarios argue for a bullish bias for Ripple (XRP). The green arrows between a and b (both labelled in blue) on the chart show a 3 wave corrective move against the uptrend which started from $0.59.........this also argues for the fact that prices should move up higher in Ripple as a correction implies that the main trend (in this case, uptrend) is not yet complete.
Target area 1 (between $1.71 and $1.77) and Target area 2 (between $2.07 and $2.20) are the likely points I have indicated for termination of the bullish move.
The red line on the chart shows my IDEAL price entry point at ~$1.06.
POI = Point at which I would consider the trade invalid = Price close below $0.88.
If price fails to move to move back down to $1.06, I would look to get into the trade if price breaks out above $1.23.
Entry above $1.23 would make my POI = $1.06 (i.e. risk on the trade would then be $1.23 - $1.06 = $0.17) and I will look for price to exit my trade at Target 2 to give me a risk to reward ratio of ~5:1
If price quickly deeps to the $1.06, then $0.88 will be used as my POI and either target 1 or target 2 will sufficiently produce a risk/reward ratio of > 3:1 with target 2 being more profitable than target 1.

XPRUSD - Formation of Uptrend. Hello Traders!
Suppose, that correction phase is over. Present time we see the formation of 1 subwave of "C".
Powerful Traders decisively take a long position for 2.60000$;
"Short term target": 1.60000$.
"Middle term targets": 2.00000$;
"Long term targets": 3.00000 - 3.40000$.
Subscribe to "Powerful Traders"!
Everyday, nine Tengri's traders, creates professional analysis, specializing on Elliotte wave theory, Technichal analysis,
Volume Spread analysis, Market Profile, Depth of Market, Order flow & Footprint.
We trade in all financial markets, there are no boundaries or limitations.
Join us!
«« «« «« «« «« Hold Like! »» »» »» »» »»
(If you have questions, comments, write, reply thoroughly!)
You're welcome!!!
Best regards, the team Traders "Powerful Traders".

Ripple/USD Great long-Term Trading Opportunity. don't miss itTrading suggestion:
Price is in the support zone (1.8500 to 1.3900), traders can set orders based on Daily-Trading-Opportunities (Price Action) and expect to reach short-term targets.
.Beginning of entry zone (1.85)
.Ending of entry zone (1.39)
Take Profit:
TP1= @ 2.24
TP2= @ 2.73
TP3= @ 3.00
TP4= @ 3.51
TP5= @ Free
Technical analysis:
.Price is below WEMA21, if price drops more, this line can act as dynamic support against more losses.
. Relative strength index ( RSI ) is 57.
.Current short-term is range bound, but resumption of uptrend is expected.

XPRUSD - BUYERS enter the Market!?Hello Traders!
Suppose, that current correction should soon be over.
Powerful Traders decisively take a long position for 2.60000$;
"Short term target": 1.60000$.
"Middle term targets": 2.00000$;
"Long term targets": 3.00000 - 3.40000$.
Subscribe to "Powerful Traders"!
Everyday, nine Tengri's traders, creates professional analysis, specializing on Elliotte wave theory, Technichal analysis,
Volume Spread analysis, Market Profile, Depth of Market, Order flow & Footprint.
We trade in all financial markets, there are no boundaries or limitations.
Join us!
«« «« «« «« «« Hold Like! »» »» »» »» »»
(If you have questions, comments, write, reply thoroughly!)
You're welcome!!!
Best regards, the team Traders "Powerful Traders".

Ripple short then up we go Hi guys my analysis on ripple is the following
Trend: Short
Projections: stated by the orange line
If then statements: if the markets hits the following projection the following reaction could occur
ps remember money management and stop losses are the key in markets
any questions let me know

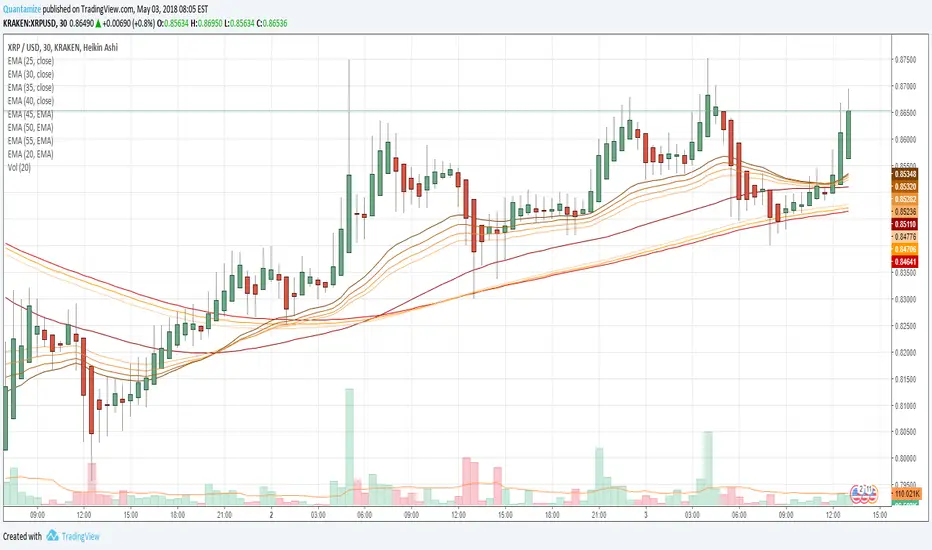
Ripple - Uptrend in "3-d" or "C" waves!?Hello Traders!
We accurately predict the end of supposed 2-nd subwave. Obviously the Correction phase, is over!? )))
Near time, if the price do not breakthrough the invalidation level 0.87357, we should see the start of strong Uptrend in 3-d or C wave!
Subscribe to "Powerful Traders"!
PT's will try to take long position for 2.60000$;
"Short term target": 1.60000$.
"Middle term targets": 2.00000$;
"Long term targets": 3.00000 - 3.40000$.
Subscribe to "Powerful Traders"!
Everyday, nine Tengri's traders, creates professional analysis, specializing on Elliotte wave theory, Technichal analysis,
Volume Spread analysis, Market Profile, Depth of Market, Order flow & Footprint.
We trade in all financial markets, there are no boundaries or limitations.
Join us!
«« «« «« «« «« Hold Like! »» »» »» »» »»
(If you have questions, comments, write, reply thoroughly!)
You're welcome!!!
Best regards, the team Traders "Powerful Traders".

Ripple XRP Start of an upward trend - H&SAs I posted earlier in my previous chart which came true. The H&S formation had completed with high volume buyers at approx. $1.
The current trend formed an inverted head and shoulder signaling an potential start of an uptrend. Kindly follow for more updates.

XRP downtrend.Seems like XRP breakdown the symetrical triangle in a very solid movement. It failed to reverse the downtrend and now is going down.
Next step, 1.13
