XRP - Urgent update 😯😯Yesterday the picture looked strongly bullish and that kept me busy, in the end, it was another trap, bitcoin and all altcoins broke their local trend lines , and then we saw a market correction.
At the moment it is hard to predict the market trend, most likely the price will go to update its local lows, so I am following the market and sharing my analysis of possible market moves.
On the Ripple chart, we can see that the price fell 5%, consolidated, and once again updated the lows of the same fall. Now XRP could come back, gather liquidity higher, and go even lower!
Write in the comments all your questions and instruments analysis of which you want to see.
Friends, push the like button, write a comment, and share with your mates - that would be the best THANK YOU.
P.S. I personally will open entry if the price will show it according to my strategy.
Always make your analysis before a trade
Rippleforecast

XRP - You can try to open a trade after a squeeze and retest 🚀XRP, like bitcoin, has not seen significant movement on the chart for several days. The price is currently trading near the bottom of the triangle. It is likely that BTC will go up and altcoins will also go up.
If XRP comes to the upper boundary of the triangle and starts consolidating near it, that would be a good buying opportunity, even better if the price breaks through it and tests the triangle as support. If all these factors materialize, Ripple could quickly reach the above targets!
Write in the comments all your questions and instruments analysis of which you want to see.
Friends, push the like button, write a comment, and share with your mates - that would be the best THANK YOU.
P.S. I personally will open entry if the price will show it according to my strategy.
Always make your analysis before a trade

Bitcoin ❤ Lovers have two scenarios for Bulls Honeymoon 🚀⚡😍Yes, you guess it right there are two illustrated Honeymoon plans on the chart with your 'Honey' Crypto.
As you see the chart from the recent All-Time High from 64000 to the Last Swing High 18992 in December 2017 before Big Monster Bull Run started after the breakout in October 2020, now we have already retraced 78.6% at 28815 during this recent 'Fatal Crash' that means this is the Golden chance that Bulls can take the control of the Crypto party. How? Let's see below Scenario 1
Scenario 1: 78.6% is the last resort for the retracement before the upcoming new Bull Run, possibilities are very high that if they break the upper range of 41K mentioned in the chart that will be the final confirmation for Scenario 1 Bulls Mission Successful.
In any situation this recent crash low 28815 gets broken in the near term future before closing above 41k to 42K in the Big Timeframe then doors are open for Scenario 2 shown in the chart.
Scenario 2: In this we have used the Fibonacci Range from Bitcoin Inception to the All-Time High 64000 and we got two important numbers plotted in the chart at
61.8% is at 24925
78.6% is at 14059 respectively.
Now, BITSTAMP:BTCUSD will take a U-Turn from these above two Fibonacci Level, there is no doubt unless there is no such bad news/development in Cryptos Space in the future during that period.
Stay tuned as always for the latest updates. Give a Thumbs Up 👍 and Do Follow us.
Why?
1. A Professional Group of Smart and Sniper Investors, Traders, and Venture Capitalists over 11 Years in the Markets.
2. Successfully Anticipated in various Bulls and Bears Cycles for Cryptos, US, European and Asian Markets since 2010.
3. Update of the latest important news and our point of view on it.
Some Important Trade Management Tips
1. Always enforce strict Risk Management.
2. Compulsory Strict Stop loss in the system and Capital Protection are the topmost priorities and always take a planned, informed and calculated risk, not a blind risk.
3. Only trade which has a favorable Risk Reward Ratio.
Happy Investing and Trading,
Comment below your point of view/feedback.
Team 10xBulls ⚡

Ripple is pressing supportAfter the recent drop to 0.5, Ripple corrected to 0.75, but has started to fall again, making lower highs and the recent price action is resembling a descending triangle.
0.6 is the base of this triangle and a drop under looks imminent.
Short therm traders can target 0.5 support

Ripple- my target remains 0.4After a short visit to 0.5, Ripple has started to rise and is trading at 0.67 at the time of writing.
The rise is clearly corrective in nature and I still expect a drop to 0.4
0.8 is strong resistance at this point and rallies towards that zone should be sold

XRP - pay attention, there may be a better entry point here!😯The cryptocurrency market is now full of uncertainty. Ripple corrected by 7% after the recent growth, now on the chart locally you can see the wedge pattern, at the moment the price is near its lower border, if the price continues to trade near this border, it could be a signal that xrp will break it and go lower!
Probably the best entry point is when the price breaks through and tests the bottom of the wedge as resistance!
Write in the comments all your questions and instrument analysis of which you want to see.
Friends, push the like button, write a comment, and share with your mates - that would be the best THANK YOU.
P.S. I personally will open entry if the price will show it according to my strategy.
Always make your analysis before a trade

XRP rejected from $0.72 amid multiple sell signals
Ripple price gained ground to settle briefly above $0.7 but hit a barrier under $0.72.
Losing support at $0.7 opened the Pandora box as a correction to $0.64 becomes apparent.
Ripple price was able to break the resistance at $0.7 on Tuesday. This move allowed bulls to stretch the up leg to $0.72. However, the seller congestion at the 200 Simple Moving Average (SMA) on the two-hour chart stopped the bullish action.
In the meantime, XRP trades at $0.68 after losing support at $0.7. If the ground above $0.7 is not reclaimed soon, losses will likely extend toward $0.64. At the moment, the path with the slightest hurdles seems downward, as observed from the short-term technical picture.
Why could Ripple price declines soar in the near term?
Ripple’s short-term technical picture is flipping massively bullish, according to the two-hour chart. Applied technical tools such as the Moving Average Convergence Divergence (MACD) are about to send a bearish signal. The indicator follows the trend of an asset and measures its momentum.
When the MACD line (blue) crosses below the signal line, it is a call to sell, as observed on Ripple’s chart. Moreover, traders watch out for the MACD crossing under the zero line into the negative territory to validate the downtrend.
As the bearish momentum gains power, the Relative Strength Index (RSI) shows that bearish aggression intensifies. Unlike the MACD, the RSI follows the trend of an asset and calculates its strength. A sharp drop from the oversold area suggests that sellers are entirely in control. Breaking below the midline and toward the oversold region would cement the bears’ influence in the market before the bulls turn the trend around.
On the other hand, a golden cross pattern has occurred with the 50 SMA crossing above the 100 SMA. The pattern infers that the uptrend is still intact despite the correction, and Ripple price will likely secure higher support, leading to its resumption.
Ripple intraday levels
Spot rate: $0.68
Trend: Bearish
Volatility: High
Support: $0.64 and $0.58
Resistance: The 200 SMA

XRP, Ripple - 2 local entry points for coin.Take a look at whereI see two options for trading:
1. We have a local low at 0.5691. If we touch it several times and start trading near it, the chance of breaking down is very high. The entry point after the breakout and retest of the support line.
2 . We have a local resistance line. I'll consider it for a breakthrough in case of a squeeze to the level. If it happens, I'll enter after the breakout and retesting accordingly.
Write in the comments all your questions and instrument analysis of which you want to see.
Friends, push the like button, write a comment, and share with your mates - that would be the best THANK YOU.
P.S. I personally will open entry if the price will show it according to my strategy.
Always make your analysis before a trade

Ripple- Next target 0.4?As expected, XrpUsd has broken 0.8 support and now is trading at 0.75
My outlook for the crypto market remains grossly bearish and I expect Ripple to reach 0.4 in the next wave of selling
0.8 is now resistance and rallies to that zone should be sold
Only Ripple above 1usd would put a pause on this outlook

Thursday: Ripple - Week 24Check related ideas.
I will update my idea as the trade progresses if any changes occur and my analysis is wrong, or need to be adapted to the new development of price-action.
Thanks for the support!
-----------------------------------------------------------------------------------------------------------------------
-----------------------------------------------------------------------------------------------------------------------
SMASH that follow button! 👍
💡 Leave a comment and/or message me on how I can improve and provide better content, I'm open to suggestions to create a better experience for you!
RISK DISCLAIMER: Please be advised that I am not telling anyone how to spend or invest their money. Take all of my videos as my own opinion, as entertainment, and at your own risk. I assume no responsibility or liability for any errors or omissions in the content of this channel. This content is for educational purposes only and is not tax, legal, financial, or professional advice. Any action you take on the information in this video is strictly at your own risk. We, therefore, recommend that you contact a personal financial advisor before carrying out specific transactions and investments. There is a very high degree of risk involved in trading. Past results are not indicative of future returns. Inotfancy.com and all individuals affiliated with this channel assume no responsibility for your trading and investment results.

XRP, Ripple - I don't open buy position now. I'm waiting for...Like a lot of top coins, XRP broke the resistance line. I don't like this breakout because we didn't have a big volume for it. Now isn't a good time to do something. The best way, to wait for retesting to key level 0.8437 and open buy position with a small stop-loss after it.

XRP to 6$ and beyondHello XRP Friends,
this is my first public XRP chart so if you find this useful, show some love.
I believe XRP is headed to 6 / 7 $ ( short term ).
If everything highlighted in the chart aligns - end of August should be the right date for target to be reached.
Considering PoW crackdown and green agenda being pushed everywhere:
Long term i'm looking at $100+ / XRP.
Time will tell.
Cheers,
Kripti.

Thursday: RIPPLE - Week 23Ripple is looking good for buy opportunities now, look at the 'related ideas' to get an analysis of the bigger context, and why my directional bias is bullish now.
I will update my idea as the trade progresses if any changes occur and my analysis is wrong, or need to be adapted to the new development of price-action.
Thanks for the support!
-----------------------------------------------------------------------------------------------------------------------
-----------------------------------------------------------------------------------------------------------------------
SMASH that follow button! 👍
💡 Leave a comment and/or message me on how I can improve and provide better content, I'm open to suggestions to create a better experience for you!
RISK DISCLAIMER: Please be advised that I am not telling anyone how to spend or invest their money. Take all of my videos as my own opinion, as entertainment, and at your own risk. I assume no responsibility or liability for any errors or omissions in the content of this channel. This content is for educational purposes only and is not tax, legal, financial, or professional advice. Any action you take on the information in this video is strictly at your own risk. We, therefore, recommend that you contact a personal financial advisor before carrying out specific transactions and investments. There is a very high degree of risk involved in trading. Past results are not indicative of future returns. Inotfancy.com and all individuals affiliated with this channel assume no responsibility for your trading and investment results.

XRP,Ripple - first target - done✅. Second target - in what case❓As I said 2 days ago, the price planed to go to 0.8 zone. It happened. Congratulations. If the price starts squeezing to 0.79, only, in this case, I'll buy. Sure, we must control the situation with BTC. Unfortunately, the BTC now sets the movement of almost the entire market.
Write in the comments all your questions and instrument analysis of which you want to see.
Friends, push the like button, write a comment, and share with your mates - that would be the best THANK YOU.
P.S. I personally will open entry if the price will show it according to my strategy.
Always make your analysis before a trade

Wednesday: RIPPLE - Week 23Hello Traders! So, ripple did what I expected, as you can see at 'Related Ideas', but now that we have broken the low, and reversed, we have created the start of a possible Expanding Flat. My directional bias now is bullish - and therefore I'm only looking for buy opportunities on lower timeframes.
I will update my idea as the trade progresses if any changes occur and my analysis is wrong, or need to be adapted to the new development of price-action.
Thanks for the support!
-----------------------------------------------------------------------------------------------------------------------
-----------------------------------------------------------------------------------------------------------------------
SMASH that follow button! 👍
💡 Leave a comment and/or message me on how I can improve and provide better content, I'm open to suggestions to create a better experience for you!
RISK DISCLAIMER: Please be advised that I am not telling anyone how to spend or invest their money. Take all of my videos as my own opinion, as entertainment, and at your own risk. I assume no responsibility or liability for any errors or omissions in the content of this channel. This content is for educational purposes only and is not tax, legal, financial, or professional advice. Any action you take on the information in this video is strictly at your own risk. We, therefore, recommend that you contact a personal financial advisor before carrying out specific transactions and investments. There is a very high degree of risk involved in trading. Past results are not indicative of future returns. Inotfancy.com and all individuals affiliated with this channel assume no responsibility for your trading and investment results.

XRP technical levels fade while freefall to $0.65 beckonsRipple has embraced downward price action since the beginning of June. The international money transfer token crashed from $1.71 to $0.65 in May but recovered to highs around $1.1 at the beginning of June.
In the last week, the overall general outlook in the market has seen XRP bulls fight a losing battle. Initially, buyers focused on gains above $1, but the barrier at $1.1 only got them exhausted.
Meanwhile, the aggressive bearish wave in the market, especially this week, forced Ripple to explore the rabbit hole. Support at $0.9 and $0.8 did little to halt the declines; thus, XRP revisited a previous anchor at $0.78.
Ripple's technical picture adds credence to the bearish outlook
Many analysts believe that this a bear cycle and that Ripple may drop further. The short-term technical outlook confirms this narrative. For instance, the Moving Average Convergence Divergence (MACD) continues to dip inside the negative region. Additionally, the MACD line (blue) recently crossed beneath the signal line, a critical bearish signal.
Similarly, the Relative Strength Index (RSI), a technical indicator tracking the trend of an asset and measuring its momentum, reinforced the bearish tightening grip. Another approach in the oversold region shows that sellers have the upper hand.
For now, the path with minor hurdles is downward. Hence, immediate support between $0.78 and $0.8 is crucial for the bulls to resume the uptrend. However, another swing south might bring XRP near the primary support in May at $0.65.
Ripple intraday levels
Spot rate: $0.84
Trend: Bearish
Volatility: Low
Support: $0.78 and $0.65
Resistance: $0.9 and $1


Monday: RIPPLE PART 2 - week 23Ripple is not really going anywhere, it just keep correcting. The structure is making flat-structures, but they are all very short-term setups, and to take advantage of these opportunities it's all about timing, and being able to enter and exit positions quickly and swiftly. It's hard to update these trades and ideas in real-time here on tradingview, but if you understand market structure, then you understand how to adapt and identify to the market structure scenarios unfolding and you know how to take advantage of them.
I will update my idea as the trade progresses if any changes occur and my analysis is wrong, or need to be adapted to the new development of price-action.
Thanks for the support!
-----------------------------------------------------------------------------------------------------------------------
-----------------------------------------------------------------------------------------------------------------------
SMASH that follow button! 👍
💡 Leave a comment and/or message me on how I can improve and provide better content, I'm open to suggestions to create a better experience for you!
RISK DISCLAIMER: Please be advised that I am not telling anyone how to spend or invest their money. Take all of my videos as my own opinion, as entertainment, and at your own risk. I assume no responsibility or liability for any errors or omissions in the content of this channel. This content is for educational purposes only and is not tax, legal, financial, or professional advice. Any action you take on the information in this video is strictly at your own risk. We, therefore, recommend that you contact a personal financial advisor before carrying out specific transactions and investments. There is a very high degree of risk involved in trading. Past results are not indicative of future returns. Inotfancy.com and all individuals affiliated with this channel assume no responsibility for your trading and investment results.

Monday: RIPPLE - Week 23I will update my idea as the trade progresses if any changes occur and my analysis is wrong, or need to be adapted to the new development of price-action.
Thanks for the support!
-----------------------------------------------------------------------------------------------------------------------
-----------------------------------------------------------------------------------------------------------------------
SMASH that follow button! 👍
💡 Leave a comment and/or message me on how I can improve and provide better content, I'm open to suggestions to create a better experience for you!
RISK DISCLAIMER: Please be advised that I am not telling anyone how to spend or invest their money. Take all of my videos as my own opinion, as entertainment, and at your own risk. I assume no responsibility or liability for any errors or omissions in the content of this channel. This content is for educational purposes only and is not tax, legal, financial, or professional advice. Any action you take on the information in this video is strictly at your own risk. We, therefore, recommend that you contact a personal financial advisor before carrying out specific transactions and investments. There is a very high degree of risk involved in trading. Past results are not indicative of future returns. Inotfancy.com and all individuals affiliated with this channel assume no responsibility for your trading and investment results.
XRP, Ripple - a clear entry point for the short position🔥The coin broke the local uptrend line. We have a clear key level at 91,66. If price stars squeezing to this level, it will be a great pattern for a breakout. Entry point only after retest. Don't forget about SL.
Write in the comments all your questions and instrument analysis of which you want to see.
Friends, push the like button, write a comment, and share with your mates - that would be the best THANK YOU.
P.S. I personally will open entry if the price will show it according to my strategy.
Always make your analysis before a trade

Ripple going back to the 60 to 40 cents range. XRPUSDT is currently in a strong downtrend as show by the red line of the hull suit indicator.
We have a very bearish kumo twist right ahead in the ichimoku cloud, further signalling a continuation of the downtrend.
Also, there seems to be a bear flag pattern forming in the last few days.
Considering all this, and XRPUSDT past performance, I'm betting for a short-term DUMP that will put us in the 0.6 to 0.3 range for a while.

Ripple / XRPUSD: 15min and 1H Chart BUY opportunityHello traders! Watch out for the breakout of the flat-structure that is currently forming, a great buy-setup in the making. The probabilities are good that this will go up, but whether it's the start of the big up move or not is not something anyone can tell. As traders we have to adapt to different market scenarios, we deal with probabilities here. For now I see 2 scenarios, and I will trade according to those, until I see market structure doing something different. Trade with care!
I will update my idea as the trade progresses if any changes occur and my analysis is wrong, or need to be adapted to the new development of price-action.
Thanks for the support!
-----------------------------------------------------------------------------------------------------------------------
-----------------------------------------------------------------------------------------------------------------------
SMASH that follow button! 👍
💡 Leave a comment and/or message me on how I can improve and provide better content, I'm open to suggestions to create a better experience for you!
RISK DISCLAIMER: Please be advised that I am not telling anyone how to spend or invest their money. Take all of my videos as my own opinion, as entertainment, and at your own risk. I assume no responsibility or liability for any errors or omissions in the content of this channel. This content is for educational purposes only and is not tax, legal, financial, or professional advice. Any action you take on the information in this video is strictly at your own risk. We, therefore, recommend that you contact a personal financial advisor before carrying out specific transactions and investments. There is a very high degree of risk involved in trading. Past results are not indicative of future returns. Inotfancy.com and all individuals affiliated with this channel assume no responsibility for your trading and investment results.

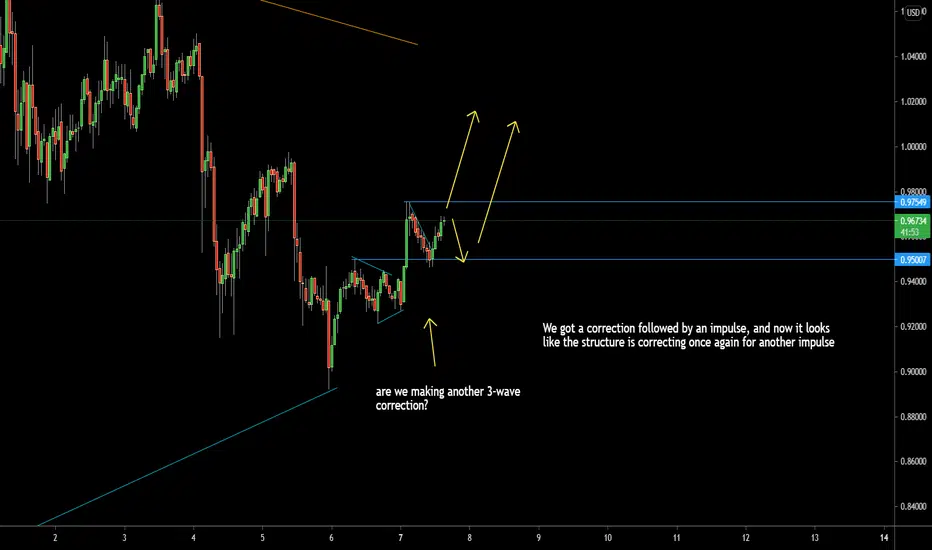
Ripple / XRPUSD: 4H ChartHello traders! Ripple is making bullish patterns, if we take a look at the daily chart, then we are able to establish a directional bullish bias based on the pattern (check out related ideas), we then take a look at the 4H and see that here we're also making a probable bullish pattern, therefore look for flag patterns (buy-setups). Trade with care!
I will update my idea as the trade progresses if any changes occur and my analysis is wrong, or need to be adapted to the new development of price-action.
Thanks for the support!
-----------------------------------------------------------------------------------------------------------------------
-----------------------------------------------------------------------------------------------------------------------
SMASH that follow button! 👍
💡 Leave a comment and/or message me on how I can improve and provide better content, I'm open to suggestions to create a better experience for you!
RISK DISCLAIMER: Please be advised that I am not telling anyone how to spend or invest their money. Take all of my videos as my own opinion, as entertainment, and at your own risk. I assume no responsibility or liability for any errors or omissions in the content of this channel. This content is for educational purposes only and is not tax, legal, financial, or professional advice. Any action you take on the information in this video is strictly at your own risk. We, therefore, recommend that you contact a personal financial advisor before carrying out specific transactions and investments. There is a very high degree of risk involved in trading. Past results are not indicative of future returns. Inotfancy.com and all individuals affiliated with this channel assume no responsibility for your trading and investment results.
