Don't miss the great buy opportunity in XRPUSDTrading suggestion:
. There is a possibility of temporary retracement to suggested support line (0.19). if so, traders can set orders based on Price Action and expect to reach short-term targets.
Technical analysis:
. XRPUSD is in a range bound and the beginning of uptrend is expected.
.The price is above the 21-Day WEMA which acts as a dynamic support.
. The RSI is at 62.
Take Profits:
TP1= @ 0.21
TP2= @ 0.23
TP3= @ 0.25
TP4= @ 0.29
TP5= @ 0.34
SL= Break below S2
❤️ If you find this helpful and want more FREE forecasts in TradingView
. . . . . Please show your support back,
. . . . . . . . Hit the 👍 LIKE button,
. . . . . . . . . . . Drop some feedback below in the comment!
❤️ Your Support is very much 🙏 appreciated! ❤️
💎 Want us to help you become a better Forex trader ?
Now, It's your turn !
Be sure to leave a comment let us know how do you see this opportunity and forecast.
Trade well, ❤️
ForecastCity English Support Team ❤️
Ripplelong

Don't miss the great buy opportunity in XRPUSDTrading suggestion:
. There is a possibility of temporary retracement to suggested support line (0.19). if so, traders can set orders based on Price Action and expect to reach short-term targets.
Technical analysis:
. XRPUSD is in a range bound and the beginning of uptrend is expected.
.The price is above the 21-Day WEMA which acts as a dynamic support.
. The RSI is at 62.
Take Profits:
TP1= @ 0.21
TP2= @ 0.23
TP3= @ 0.25
TP4= @ 0.29
TP5= @ 0.34
SL= Break below S2
❤️ If you find this helpful and want more FREE forecasts in TradingView
. . . . . Please show your support back,
. . . . . . . . Hit the 👍 LIKE button,
. . . . . . . . . . . Drop some feedback below in the comment!
❤️ Your Support is very much 🙏 appreciated! ❤️
💎 Want us to help you become a better Forex trader ?
Now, It's your turn !
Be sure to leave a comment let us know how do you see this opportunity and forecast.
Trade well, ❤️
ForecastCity English Support Team ❤️

Cryptocurrency Ripple long-term buy signalsRipple (XRP/USD), Monthly chart: Support zone + Hammer inside of Inside Bar + Another one Hammer candle patterns

When will the scallop/rounded bottom end? XRPXRP Idea
I feel the demand for XRP is high even though price action is low
just my opinion though
Included some key levels

🤢🤮 Ripple Has Not Looked Attractive. (XRP)💰 LET'S GET INTO SOME RIPPLE ANALYSIS!💰
1️⃣ First off SMASH that LIKE BUTTON & Give us a FOLLOW for DAILY ANALYSIS! ❤❤❤
(Overall Market Sentiment) 🐻 Bearish
- 3day Chart
- Red Engulfing Candle
- 3/3 EMA DOTS Red
I displayed the the curve of downward price action as we have been dropping red consistently and have been red the last 3 weeks on ripple. Based off the curve of the overall trend I think this one could get real ugly. Your main Resistance is literally a straight drop.
Best of luck to you and all of your trades this week! 🤜
Drop your charts and comments down below, share with us what you think is going on in the markets! ❤❤❤
Thanks for checking out our analysis! ✌😁✌
🥇MLT | MAJOR LEAGUE TRADER


Ripple Got a Mean Curve. 🤣 (XRP)🤷♂️ Don't need to say much. If rejection holds here, then it will drop hard!
Overrated coin with an overrated market cap.
🚮🗑🚮🗑🚮🗑
🥇MLT | MAJOR LEAGUE TRADER

XRP: Descending Wedge Breakout Analysis 1D (Jun. 12)X Force Global Analysis:
In this analysis, we look at XRP's BTC pair chart on the daily to assess a potential bullish breakout scenario.
Analysis
- The first thing we note is the descending bullish wedge we are trading in
- XRP is consolidating within a descending wedge pattern, looking for a potential breakout
- Moreover, a bullish divergence has also formed, with lower lows on the price, and higher lows on the Relative Strength Index (RSI)
- The Stochastic Oscillator is at oversold territories, looking for a potential golden cross
- While the MACD's bullish histograms are decreasing, it has nonetheless formed a golden cross, and the potential death cross could be negated by a breakout
- However, we are currently trading below the 20 Simple Moving Average (SMA), and a break above that moving average is necessary for bullish confirmation
- Moreover, for the past few weeks, Bitcoin has failed to break and close above the Ichimoku Cloud resistance
- For a breakout to lead to a bullish rally, a break and close above the Ichimoku Cloud is imperative
What We Believe
While XRP has shown weakened momentum and price movement, technicals demonstrate potentiality for a breakout. The Ichimoku Cloud resistance is extremely strong, but a break and close above those levels could lead to a bullish rally.
Trade Safe.

XRP/USD - sell zone On the day timeframe, the triangle fell from (distribution ) downwards.
I plan to trade from the zone 0.208 - 0.21.
Indicators show the shorts in a better position.
Shorts from confirmation. Stop loss can be hidden by the level. Like I drew on the chart.
At the 4 o'clock timeframe, they're drawing a model from the bounce.
A rebound from the fall, or in other words, a correction.
Indicator AO and RSI show growth
Thanks for your support! Push like if you think this is a useful idea!

XRP/USD - Safer purchase after level breakage and fixation.Safer purchase after level breakage and fixation.
But there is less profit and less risk.
It's better to wait for your price. Than running after a steam train.
Indicators are free to rise up.
The key level of $0.20 from it is safe to make a decision.
Yesterday's review added an excellent stop loss take-out.
Push ❤️ if you think this is a useful idea!
Before to trade my ideas make your own analysis.
Write your comments and questions.
Thanks for your support!

XRP Ripple Timei am not in love with Ripple but i checked a bit some Shitcoins and noticed that XRP is in a good mod for a buy and cannot dip so much.
i don't show indicators to keep the chart clear but they are looking good on Daily and Weekly.
So you can Buy now or wait for a BTC dip if u want to cumulate more and this is only about your appreciation.
Buy : 0.19ish or less
First Target
Short Term Sell : 0.248 for safety / 0.255 for greedy
Second Target if we have a clear breakout :
Middle/Long Term Sell : 0.2915ish ( sell before 0.30!)
Happy Tr4Ding !!

XRP Golden Cross - 3rd Time's A CharmThis is a daily view on XRP
I am drawing attention to the most common "golden cross" in charting: when the 50 SMA crosses above the 200 SMA
What I am specifically drawing attention to is the following:
- During our prior 2017 bull-run, it took the 3rd golden cross to enter our bull market (SHOWN BELOW)
- The first 2 golden crosses (red circles) resulted in prices rising above the 200 SMA, but then ultimately rejecting and crossing back below the 200 SMA (red 'x' failure, and red arrow move back down)
- The 3rd golden cross (green circle) resulted in prices sky rocketing, entering our bull market (green check mark, and green arrow up)
The same sort of fractal may be playing out in 2020:
- I have indicated the same first 2 golden cross failures in 2020
- I have also drawn what appears to be our 3rd upcoming golden cross. So this begs the question: Will we similar price reaction and the start of our new bull market in XRP
Please look at the chart BELOW, and the chart ABOVE and observe the similarities

Ripple Facing The Crossover. (XRP)Symbol: XRPUSD / Cryptocurrency
3day firing red with a Crossover to create Resistance. I am not interested in a buy.

XRP/USD - movement to the upper resistance level.Reason for the purchase:
* Fastening above level 0.2060
* Increased volume (increased demand at the level)
* Accumulation to continue driving
* I see where to hide the stop loss
At the weekly timeframe, the volume of trade increased.
You can see from the moving average that the bearish trend is still continuing.
But if the volume is increased, the change of trend increases the probability.
I consider the 0.20 key level to be the key level, the decline will continue.
Buying from the level, I consider it relevant.
If you have your own opinion or thoughts about current market situation, feel free to write it in comment below !


Ripple (XRP) Needs This Break Out Then Next Destination Is $5Falling wedge:
The price action of Ripple is moving in a falling wedge pattern since August 2018. Recently after the strong bearish trend in the month of March 2020 the priceline of XRP again has hit at the support of this falling wedge pattern. Here I was waiting for two indicators to give bullish signals. One from stochastic to give bull cross and second for the momentum indicator to turn weak bearish from strong bearish after these two signals I was expecting that the priceline will again move up to make another attempt to break out the resistance of this falling wedge pattern.
Finally on 6th of April the stochastic gave bull cross and on 27th of April the momentum indicator turned weak bearish from strong bearish and then the priceline of Ripple turned bullish and sofar it has reached almost at the half of the wedge pattern.
Here we can observe one more thing that the relative strength index (RSI) indicator 1st went in oversold in January 2020 and in the month of March it went again very close to the oversold zone and now it has turned bullish. And if we see the priceaction of XRP then it can be easily seen that the priceline has also formed a double bottom as well that is another very powerful bullish sign.
Indicators are turning bullish:
falling wedge:
Volume profile and Bollinger bands are giving bearish signals:
If we see the two more signals on this weekly chart then the situation is little bit disappointed. If we see the volume profile of the complete price action moving within the pattern then it can be easily witnessed that the trader’s interest is very weak below $0.17. And if we move up then we find that the interest of the traders is very low above $0.33, this is almost the same level where we have the resistance of the falling wedge pattern. Therefore in order to have a break out from the wedge we need the interest of the traders should be developed above the level of resistance, moreover if we see the Bollinger bands then it can be easily observed that the upper band of Bollinger bands is below the resistance of this falling wedge pattern. Therefore it can play a role of resistance or hurdle for the priceline that can stop the XRP to break out the resistan. Therefore in order to achieve a successful breakout from this pattern we need the Bollinger bands to move above the resistance of Wedge. However if exceptional we will have a powerful buying volume then the Ripple can ignore these signals and breakout the resistance.
Simple moving averages and bearish signal on daily chart:
Now if we switch to the short-term daily chart and place simple moving averages with the time period of 25, 50,100, and 200 then we can see that since 14 March to 29th of April the priceline was moving up with a strong bullish rally and first the price action broke out the 25 SMA after that priceline faced a little bit resistance but finally broke out the 50 simple moving average. And during this the we can also watch the golden cross formation between 25 and 50 simple moving averages. Then on 29th of April the price action of Ripple broke out the 100 SMA but since then the price action is not able to break out the 200 simple moving average. And it is being consolidated between 100 and 200 simple moving averages. And now there is bearish signal appeared and that is on 30th April a powerful bearish engulfing candlestick is appeared that is a bearish signal. This candlestick has completely in engulfed the bullish candlestick of 29th April. Therefore in order to break out the 200 simple moving average we need another powerful bullish engulfing candlestick that should engulf the bearish engulfing candlestick of 30th April or at least it should be equal to this bearish candlestick. Then this bearish candlestick will be cancelled. But unfortunately sofar after that bearish engulfing candlestick we have a two weak bullish candle sticks and and today we can see a weak bearish candlestick as well.
Up channel:
On the same daily chart the priceline of Ripple is moving within an up channel since 17th of March. At this time the price action has reached at the resistance of this channel but could not break out this resistance even after powerful bullish candlesticks with long spikes and now we have few weak bullish candles moving sideways. Here I am watching for two more indicators one is stochastic indicator another one is the momentum indicator.The stochastic indicator has already visited the overbought zone and it has given bear cross. Now if with this bear cross of stochastic indicator the momentum will be turned weak bearish from strong bearish then we can expect that the priceline may re-test the support of this channel and that is at $0.20. I am not expecting as that much powerful bearish move that the priceline would re-test the support of the falling wedge that has been formed on the long term weekly chart. Therefore after retesting the support of this channel the priceline may again move up to make another attempt to break out the resistance of this channel.
Up channel:
Stochastic and momentum:
Key level resistance at $0.31:
Now I would like to discuss a major key level resistance and support level for the priceline of Ripple. And that strong resistance and support level is at $0.31. If we seen on the chat then we can easily observe that since the XRP born this $0.31 has been very powerfull resistance and support level in the history of XRP. First we can see that it has been working as a strong resistance from May 2017 to December 2017. But once this resistance was broken in December 2017 then within one month upto January 2018 price action started very powerful bullish rally that produced more than 1476% gains. And reached more than $3. Then from January 2018 to August 2019 it has been working as a a strong support for the priceline but once in August 2019 this support has been broken down since then priceline could not breakout this resistance again. Therefore we can expect that once this resistance will be broken out then it can repeat the same move of Dec 2017 to Jan 2018 and produce more powerful bullish rally than bullish rally of 2017 to 2018. And this powerful bullish divergence can lead the XRP to reach $5 that will be all time high price.
Conclusion:
On short term the Ripple is giving bearish signals therefore we can expect bearish rally on the daily chart but on the long term the XRP is bullish and once the key level resistance of $0.31 will be broken out then XRP can achieve the all time high price.
Note: This idea is education purpose only and not intended to be investment advice, please seek a duly licensed professional and do you own research before any investment.

XRP Small scythe - HourlyA scythe has formed on the hourly chart for XRP
This is a bullish continuation pattern
here is my idea on the scythe pattern
enjoy and gl

XRP HourlyHourly chart for XRP
Ascending scallop can be seen a bullish continuation pattern
And a falling wedge can be seen another bullish pattern
Looking for another impulse wave upwards


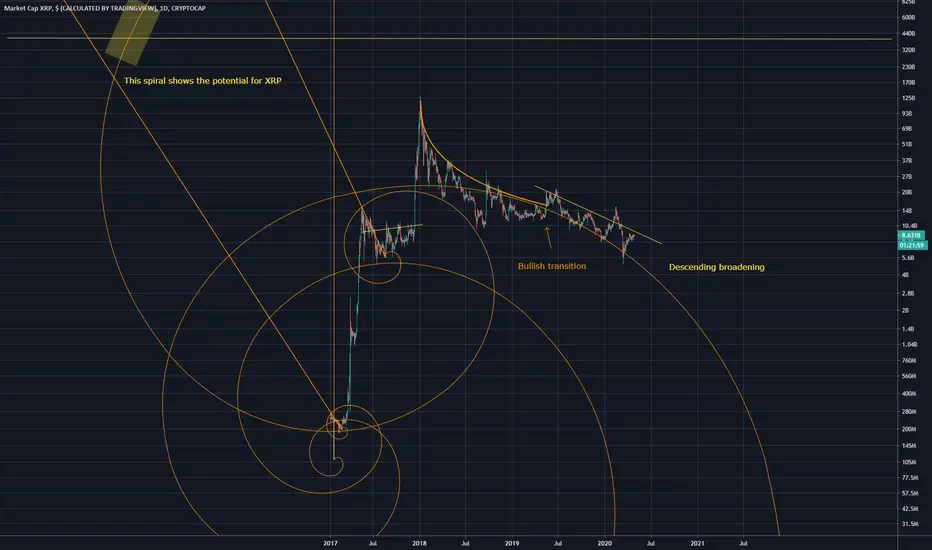
XRP cap spiralsXRP has formed a descending broadening wedge
included spirals showing the possible market cap futures highlighted in yellow rectangle
Mainly made this to show some harmonic patterns, Descending broadening wedge and the ascending wedge
Im long on this project
Wedges anyone? Pt.2 XRPXRP has formed a descending broadening wedge
This is very bullish when assigned to a daily chart
Is the long shake over?
Target upon breakout would be the top of the fib spiral, it can also be seen that the resistance of the fib spiral has been broken, creating new possibilities for a breakout
My previous idea showing an ascending scallop which is bullish after a pullback
And the MA bounce that will most likely occur on XRP


XRPXRPUSD showing positive momentum through a falling wedge, also within a descending broadening wedge which is a bullish reversal pattern. Another falling wedge is present above the one price is currently trading within. Is this simply a big shake? Fractal composite ribbon can be seen to show signs of an inverse H&S (let me know if im using this wrong, I've never used it before, always room to learn). Calling bottoms is difficult prob impossible, and shouldn't be done, but XRP is setting up a very 'hidden' bullish setup with these wedges it has formed. Best to go long like me :)
