Ripplelong

XRP/USD - Level 0.12 broke the local bottom 2017 It's important how the day closes.
If it is above 0.15 cents, we can get the continuation of the movement to the resistance level 0.175.
Provided that the levels below are fixed, 0.148 and 0.135 are interesting to buy.
And at this level to decide on the future long.
The fall is finished on the paranormal volume. ( pointed arrow )


XRPUSD formed bullish BAT | Upto 40% bullish moveHi friends hope you are well, here I have found another profit potential trading idea for you and this time Ripple (XRP) has formed bullish BAT pattern and entered in potential reversal zone and ready for bullish reversal soon.
Let’s examine how perfect this pattern is:
After initial leg (X to A) the A to B leg is retraced between 0.382 to 0.50 Fibonacci and then B to C leg is projected between 0.382 to 0.886 of A to B Fibonacci projection area and last leg (C to D) is retraced between 0.786 to 0.886 Fibonacci and now the price action is moving in potential reversal zone of this bullish BAT and now we can expect bullish divergence at any time which will lead the priceline between 0.382 to 0.786 Fibonacci projection of A to D leg , but if after this bullish divergence the candles sticks will be closed above the 0.786 Fibonacci projection area of A to D leg then it can also lead to the long term bullish move.
Buying And Sell Targets:
The buying and sell targets according to harmonic BAT pattern should be:
Buy between: $0.24244 to $0.22915
Sell between: $0.27394 to $0.32180
Stop Loss:
The potential reversal zone area which is up to $0.22915 can be used as stop loss in case of complete candle stick closes below this level.

$XRP / RIPPLE - iH&S- Buy the DIP!This is getting interesting
Still following Wyckoff accumulation schedule. Long term bias will remain bullish!!!
HEAD AND SHOULDERS INVERSE PATTERN
LOOOOOOOONG!!!!
If you think my analysis is useful, support me with a simple "LIKE". Thank you
#CRYPTO #XRP #XRPUSD #XRPBTC #RIPPLE

XRP Moonshot Pt.2$10 is the target for me.. Hopefully will be reached by EOY for longs. As you can see there are two falling wedges - one smaller one within a larger one - this can be seen using this indicator "trend lines" which provides a great outlook of your chart. This is seemingly hidden and ultra bullish. It just will take some time for the wedges to complete. Included possible pathing routes for inside the wedges however this is difficult to determine.

Ripple boizXRP has engaged in a strong horizontal support, this is a good sign. A drop may precede a pump, so don't be shaken out! A bullish exaggerated divergence can be observed w RSI and price action labeled (x) a bullish ichimoku cross can also be observed, price tends to pump through these crosses. I like to call them equilibrium crosses. Also setting up for a golden cross on this daily chart which looks nice:) Lets see where this goes!

XRPUSD 4h | 5 legit reasons why we go up (Update)As predicted, we reached the daily Trendline!
But first of all - If you like my idea, please leave a Thumbs-up! I appreciate your Support and it encourages me to keep going!
________________
Honestly, I don't understand why everyone thinks XRP goes to $0.15.
It's always like this and most never learn. They are just too emotional.
The price goes up - people panic and FOMO.
The price goes down - people hesitate, thinking the price will be on Super Sale (Even then, they would be scared to lose their money).
"Be greedy when there is blood in the Streets!"
Please, do yourself a favor and have an actual trading plan that you follow OR leave it. Simple as that.
And why do people change their opinion on a trade like twice a day?! If you would see most traders P&L on tradingview, I bet they wouldn't be green at the end of the month. Yet they sell courses and VIP Signals LOL (Sorry).
________________
ANYWAYS
________________
I said that we would reach the daily trendline (I predicted the downfall from 0.335 to 0.255)
I also expected a bounce off these levels. I don't change my trading plan now that we have reached our target. I stick to it! Confirmation builds up confidence!
(Obviously I use Stop-Losses to protect my profits and so should you!).
We have 5 good reasons why we should be comfortable in trading XRP (Going long)
1. Daily Trendline acting as Support
2. Cup and Handle Pattern (If we break to the Upside)
3. Falling Wedge (Same)
4. Long Term Support
5. Short term Support
Yes, I also see the Head and Shoulder Pattern but if you look at the history of XRP you will see that it usually only leads to a 6-10% correction (eg. 0.28 to 0.25).
I feel like we have already seen that.
As always - I'm not a financial Advisor. Please do your own research!
Thank you very much.
Good luck!
Quarto3001

XRP Falling WedgeXRP has formed a kind of 'hidden' falling wedge within its current structure. A classic example of a bullish divergence can also be observed supporting the falling wedges bullish nature.

XRP Daily Bullish DivergenceXRP has produced a daily bullish divergence, it is hard to see the lower low on the RSI, but trust me ITS THERE! This is the classic example of a oscillator , price bullish divergence.

XRPUSD Is likely to breakout the key level resistanceTaking Bounce From The Support Of Wedge:
As we have seen earlier in previous post that on week chart the Ripple is moving in a falling wedge. The formation of this chart pattern was started in Aug 2018 and now after Aug 2018 the price action has hit the support of this wedge in Dec 2019 and with hitting at support of wedge the priceline had also hit the lower band of Bollinger bands and now it has taken a strong upwards bullish move and gained more than 61% value.
After placing volume profile indicator on the complete falling wedge pattern it is visible that trader’s interest was very low at the support of the wedge this was a very strong indication for this bullish move and we also had POC level of volume profile above the price action at $0.31 and this level is also a key level resistance for the Ripple as it is not broken out since Aug 2019.
Based on above signals I predicted in my previous article which I posted in Jan 2020 that the XRP will move up from this support of the wege to hit the key level resistance at $0.31.
Below is the chart from Jan 2020 when I posted my previous article:
Below is the current position of Ripple:
Simple Moving Averages | An Alligator’s Mouth Formation:
On daily chart the simple moving averages with time period of 25, 50, 100 and 200 are turning strong bullish by forming an alligator’s opened mouth the 25 SMA has crossed up all other SMAs an 50 SMA has also crossed up 100 SMA and now has come very close to 200 SMA to form a golden cross with it then only 100 SMA will be left to form a bull cross with 200 SMA once the this bull cross between 100 SMA and 200 SMA will be formed then we will have a complete alligator’s opened mouth formation by these moving averages like they formed in Jun 2019 and the price action gave more than 80% profit.
This time again the price action is expected to start a powerful bullish rally after an alligator’s opened mouth formation.
The Key Level Resistance And Indicators:
Since XRP has crossed down the price level $0.31 in Aug 2019 it could not cross up this price level again even after several attempts.
So now $0.31 became a key level resistance for Ripple which is not letting the price action of XRP move up since Aug 2019.
But this time the priceline is likely to breakout this resistance.
If we examine since Jan 2020 the volume oscillator has triggered four times in favor of bulls with strong values of 27.62% , 23.90% , 28.34 and this time the oscillation is most powerful with the value of 30.56% if this time again the volume oscillator will be triggered then price action may breakout the resistance coz we are very close to resistance this time.
The moving average convergence divergence is strong bearish and stochastic is in bear cross once the MACD turns weak bearish or stochastic gives bull cross then from here the breakout from the resistance will be confirmed.
After Price Correction A New Bullish Harmonic Pattern Formed:
From 13 to 16 Feb 2020 we have witnessed higher spikes than the resistance but no candle stick closed above this level and now the price action has a pullback for price correction rally and during this price correction on short term 4 hour chart the Ripple has formed bullish Shark pattern with all required dimensions as below:
After initial leg (X to A) the A to B leg is retraced between 0.382 to 0.618 Fibonacci and then B to C leg is projected between 1.13 to 1.618 of A to B leg's Fibonacci projection and final (C to D) leg is retraced between 0.886 to 1.13 Fibonacci.
And after completion of pattern the price line has a strong push from potential reversal zone and now it has entered in Fibonacci projection area of C to D leg between 0.382 to 0.786 Fibonacci.
But in my opinion this push will trigger more power full bullish divergence which will lead to breakout from the resistance.

XRPUSD Bullish MomentumXRP has seen some recent gains, this could be extended further as momentum continues. Price is currently supported by ichimoku cloud, also supported by a strong Linear regression uptrend of 0.91. Included a possible fib extension if price breaks out.

RippleGuys, if you like the idea please put like button, this will be the best thanks. Thank you for your support, I appreciate it.

XRP Is Very Close To Hit The Key Level Resistance $0.31Taking Bounce From The Support Of Wedge:
On week chart the Ripple is moving in a falling wedge . The formation of this chart pattern was started in Aug 2018 and now after Aug 2018 the price action has hit the support of this wedge in Dec 2019 and with hitting at support of wedge the priceline has also hit the lower band of Bollinger bands and now it is bounced from the support of wedge at this time it has reached at middle of wedge
The Volume Profile Showing More Bullish Trend Continuation:
I have placed volume profile on complete price action of this wedge that is showing that trader's interest is very low at the support of the wedge and high upto $0.49 we have also POC of this volume profile at $0.31.
Oscillators And Indicators Are Turned Strong Bullish:
Previously on week chart the moving average convergence divergence (MACD) was turning bullish by giving weak bearish signals and relative strength index (RSI) was also oversold and stochastic had given bull cross from oversold zone.
Now the stochastic and RSI are still strong bullish and reached almost half the body of stochastic and RSI if this strong trend will be continued then we can see RSI and stochastic visiting over bought zone soon.
The MACD is now turned strong bullish as we can see the histogram is changed green from red and the moving averages of MACD has also given bull cross.
Directions And Momentum Are Shifted To Bulls From Bears And Bearish Zone Is Finally Chopped:
On week chart in directional movement the +DI and –DI has formed bull cross, the momentum is being shifted from bearish to bullish and soon we can witness the green bar in momentum indicator.
The chop zone was strong bearish since July 2019 and finally it has turned weak bearish, when last time in May 2019 it was turned bullish then the XRP surged more than 73%.
Exponential Moving Averages Are Giving Up Trend Signals:
On 4 day chart after hitting $0.51 in Jun 2019 the exponential moving average 10 crossed down the EMA 20 and formed bear cross since then the candle sticks are being closed below these EMAs once in Nov 2019 the candle sticks were likely to close above the EMA 10 and EMA 20 but at that time we did not receive a bull cross between these two EMAs therefore the attempt to close above these EMAs was unsuccessful and price action again pulled down to $0.17600 that is the lowest price since Jan 2018 up till now.
Now finally we have received a bull cross between EMA 10 and EMA 20 on current 4 day candle stick which is started on 6th Feb 2019 this can be the decision maker priceline coz so far the candle stick is not closed and still continue if it will be closed above these EMAs and we will still have bull cross between EMA 10 and 20 then it will be a proper trend reversal signal indicating towards bullish trend.
An Alligator Opened Mouth A Very Strong Bullish Signal:
On daily chart If we see the movement of simple moving averages with time period of 25, 50, 100 and 200 then 25 SMA has crossed up 50 and 100 SMAs and moving up to cross up 200 SMA now and the 50 SMA is also moving up behind the 25 SMA to cross up the 100 SMA and soon it will cross up the 200 SMA as well and this golden cross can produce a very strong bullish wave because golden cross between 50 simple moving average with 200 SMA is one of the most favorite among the professional traders and it attracts them to buy.
Once we have the order of moving averages from down to top as below:
200 SMA then 100 SMA then 50 SMA and then 25 SMA above all
Then a complete alligator’s mouth will be opened then the most powerful rally can be started.
Like when the alligator’s mouth was opened in Jun 2019 it leaded the price upto $0.51 that was around 80% big move.
Ichimoku Cloud:
Upto 2 day chart the ichimoku cloud is giving bullish signals the Lagging span has crossed up the price action and attempting to cross up the cloud, the price action has also crossed up the cloud and conversion line has formed bull cross with base line after these bullish indications we can expect that the bullish trend with be continued.
Moving Towards Key Level Resistance At $0.31:
Now after hitting the support of falling wedge pattern Ripple has surged 63% and now it is very close to the key level resistance of $0.31.
This resistance is very strong as the price action of XRP has tried three times to breakout this level but failed to do so, the 1st attempt was in Sep 2019, second in Oct 2019 and third attempt has been made on Nov 2019.
A Bullish Trend Continuation Pattern Cup & Handle Is Likely To Be Formed:
This time we can expect the breakout from this key level resistance of $0.31 because on day chart a Cup & Handle pattern is likely to be formed.
The wave down and wave up are moved very softly without any hard corners or V shape and forming a proper round shaped body of cup and this is a fact as much the shape of cup will be round shaped as much the pattern will be confirmed now there are strong chances of pull back after hitting the resistance at $0.31 and this pull back will form the handle of this cup then we can see a down channel formation or pennant or bull flag but this pull back can be a temporary bear move coz finally the price action takes bullish divergence from the handle and this bullish divergence always leads the price action to breakout the resistance of cup which is at $0.31.
Conclusion:
This time the Ripple is moving with Bitcoin which is positive on the contrary previous trend of Jun 2019 when the BTC was moving up and Ripple was moving down. There is a pullback expected before any breakout but we shouldn’t be worried coz all indicators are in favor of bullish trend rather than bearish trend. Overall green trend will be continued.
Regards,
Atif Akbar (moon333)

Ripple: Buying Trade Setup.Ripple: Buying Trade Setup.
Note: This is only for Educational purposes; this is not investment advice.

XRPBTC: Further downside before big pump(s) in 2020+This is an update on my prediction from months ago, where I foresaw the XRP developments:
I knew that XRP would not pump in 2019, contrary to many XRP shills who always like to draw their gigantic arrows pointing upwards all the time.
The date for the first XRP pump always was, and still is around April 2020.
This is due to the giant falling wedge forming in XRPBTC, since a long time already.
In the grand scheme of XRPBTC, everything aligns perfectly.
Apri 2020 I by the way also see as the date where BTCUSD will reach 20k again.
So, that is my view and it hasn't changed since months.
XRPUSD is still a strong buy!

XRP is on time correlates to 2017 patternsLooking at the current patterns, it does have a correlation pattern with 2017, it looks like there is still one last dip on the (daily) XRPUSD Poloniex chart.
Also, looking at the daily Stoch's momentum, it's possible we might see a minor dip back down near the 21's cents on the daily before it takes off.
My previous post was on the (weekly) patterns & indicators analysis. To re-cap; the weekly still have a strong potential strength and momentum (stoch and RSI) to go up.
I wouldn't be surprised if XRP jumps Feb~Apr 2020 during tax season and history repeats itself.
disclaimer: This is not a financial advice. This is my opinion that's reflected from the chart patterns and indicators.
Control your money responsively at your own will.

#XRPUSD#RIPPLE, A good time to buy?The Ripple has not really been following the rise of Bitcoin which means there is still potential for increase.
You can see that the XRP / USD broke the average moving line 200 but still not far enough away from the dangerous area.
The candles are placed above the Ichimoku cloud and in addition, a positive green cloud accompanies us on the daily graph.
Target: $ 0.26

#XRPUSD, Will it finally become an attractive currency again?A lot of the signs are still negative like the fact that the candles are still below the average moving lines 100, 200 and more, even so, we decided to focus on the buy signal.
The Ripple stopped at the resistance line (the yellow line) and responded as expected and currently the Ripple on a support line that could lead to increases.
The red cloud that accompanies the Ripple in the daily graph has come to an end.
The RSI is still only in the 55 areas and this gives us another room for further ups.
Target: $ 0.26

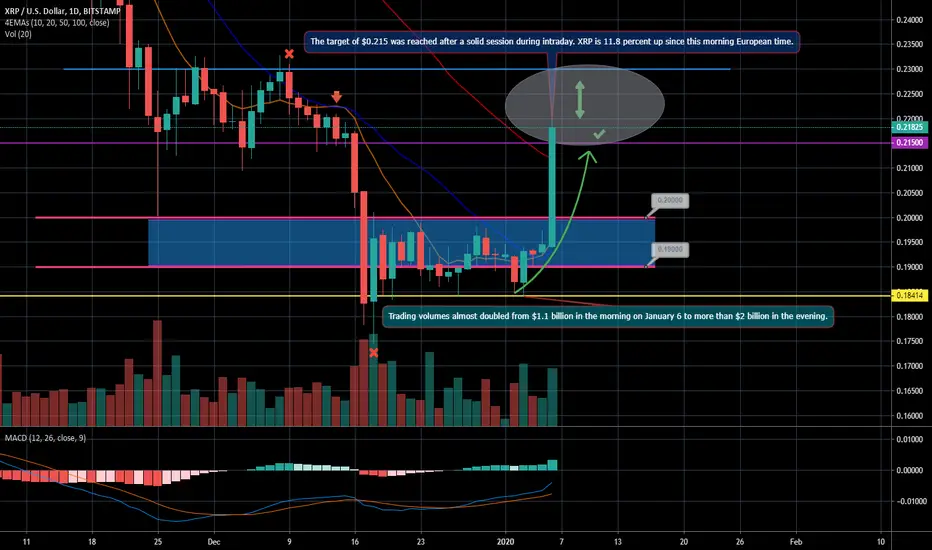
Ripple XRP/USD breakoutThe mid-week session on January 1 was far from volatile and the XRP token started 2020 without significant price changes. Trading volumes were extremely low as neither bulls nor bears could take over control.
On Thursday, January 2 the ¨ripple¨suffered a heavy drop and corrected its price down to $0.186. The good news for buyers was that these loses were completely erased on the next day, January 3 when the coin gained 3.2 percent and climbed up to $0.192.
Bears tried to intervene once again on Saturday and pushed the price down to the $0.19 line just to be rejected there.
On the last day of the week, the XRP-USD pair moved up to $0.194, still in the middle of the ranging zone.
What we witnessed on the first day of the trading week was more than unexpected as the popular altcoins skyrocketed, breaking all recently discussed short-term support zones.
The target of $0.215 was reached after a solid session during intraday. XRP is 11.8 percent up since this morning European time.
Next target for bulls is $0.23 if $0.215 holds and allows bulls to consolidate there
Trading volumes almost doubled from $1.1 billion in the morning on January 6 to more than $2 billion in the evening.
#RIPPLE He Faces Strong Resistance Please share your opinion in the comments box and do not forget to press the like button

XRPUSD formed bullish BAT | A good long opportunityPriceline of world's 3rd largest cryptocurrency Ripple (XRP) has formed bullish BAT pattern and entered in potential reversal zone.
This PRZ area should be used as stop loss in case of complete candle stick closes below this zone.
Lets have a look on the move of price action to see how perfect this pattern is driven:
After initial leg (X to A) the A to B leg is retraced between 0.382 to 0.50 Fibonacci and then B to C leg is projected between 0.382 to 0.886 of A to B Fibonacci projection area and last leg (C to D) is retraced between 0.786 to 0.886 Fibonacci and now the price action is moving in potential reversal zone of this bullish BAT and now we can expect bullish divergence at any time which will lead the priceline between 0.382 to 0.786 Fibonacci projection of A to D leg , but if after this bullish divergence the candles sticks will be closed above the 0.786 Fibonacci projection area of A to D leg then it can also lead to the long term bullish move.
As per Fibonacci sequence method we can set our targets as below:
Buy between: $0.19305 to $0.19228
Sell between: $0.19490 to $0.19766
So this very short term 2hr chart would be a good long opportunity for XRP day traders.
Regards,
Atif Akbar (moon333)
The harmonic moves analysis involves hours of hard work and determination however the success of harmonic trading in fiat and cryptocurrencies is around 80% therefore it is always important that you follow any stop loss strategy while trading harmonic patterns I have also shared a stop loss idea in this article, the information in this article is for educational purpose only this is not an investment advice, I have tried my best to catch the harmonic moves as per predefined classical harmonic BAT pattern if you find any flaw or you have any suggestion feel free to share with me in comments section.

#RIPPLE Wolfe Waves ! This is just an idea, not a recommendation
RSI : We are close to oversold
#BTCUSD : Wolf Waves
