XRPBTC Has Formed BAT Pattern And Ready For Upto 38% MovePriceline of Ripple / Bitcoin cryptocurrency has formed bullish BAT pattern and entered in potential reversal zone.
This PRZ area should be used as stop loss in case of complete candle stick closes below this zone.
Lets have a look on the pattern's move:
After inertial leg (X to A) the A to B leg is retraced between 0.382 to 0.50 Fibonacci and then B to C leg is projected between 0.382 to 0.886 of A to B Fibonacci projection and last leg (C to D) is retraced between 0.786 to 0.886 Fibonacci and now the price action is moving in potential reversal zone of this BAT pattern now we can expect bullish divergence at any time which will lead the priceline between 0.382 to 0.786 Fibonacci projection of A to D leg , but if after this bullish divergence the candles sticks will be closed above the 0.786 Fibonacci projection then it can also lead to the long term bullish move, so as per Fibonacci sequence method we can set our targets as below:
Buy between: 0.00002668 to 0.00002527
Sell between: 0.00003005 to 0.00003509
Regards,
Atif Akbar (moon333)
Ripplelong

Main Ripple XRP Analysis for TodayHi there!
PrimeXBT would like to direct your attention to a technical analysis overview of XRPUSD.
Ripple price is struggling to clear a few key hurdles against the US Dollar, while bitcoin is rallying. XRP price could gain traction once there is a close above $0.20 .
Firstly, XRP will need to move back through to the support line that's a key bullish trend line forming with support near $0.1950 on the hourly chart to hold another uptrend movement at the first major resistance level.
If there is a downside break below $0.1950 and $0.1940 , Ripple's price could move back towards the main support that is near the $0.1900 level, below which the price could move back into the positive zone.
On the upside, there are a few important hurdles forming near the local resistance zone. A successful break above the $0.20 level is needed for the bulls to gain strength. The next major resistances are seen near $0.2140 and $0.23 .
In the near term, the Relative Strength Index on the XRPUSD chart is flashing signs of bearish divergence, and some decline is expected inside a triangle.
Major Support Level: $0.19
Local Resistance Zone: $0.199 - 0.202
Market Cap: $8 484 141 997 USD
Volume (24h): $1 356 747 688 USD
Circulating Supply: 43 319 477 613 XRP
Please, let us know what you think in the comments below.
We hope you have great success with all your next trades.

XRPUSD formed bullish BAT | A good long opportunityPriceline of XRP / Dollar cryptocurrency has formed a bullish BAT pattern and entered in potential reversal zone.
This PRZ area should be used as stop loss in case of complete candle stick closes below this zone.
I have used Fibonacci sequence to set the targets:
Buy between: 0.19281 to 0.19197
Sell between: 0.19482 to 0.19786
Regards,
Atif Akbar (moon333)

XRPUSD formed bullish Butterfly | Upto 22% bullish move expectedPrice action of XRP / US Dollar has formed a bullish Butterfly and entered in potential reversal zone.
This PRZ area should be used as stop loss in case of complete candle stick closed below this area.
I have used Fibonacci sequence to set the targets:
Buy between: 0.19341 to 0.18229
Sell between: 0.20204 to 0.22299
Regards,
Atif Akbar (moon333)

XRPUSD formed bullish Shark | A good long opportunityPrice action of XRP / US Dollar has formed a bullish Shark and entered in potential reversal zone.
This PRZ area should be used as stop loss in case of complete candle stick closed below this area.
I have used Fibonacci sequence to set the targets:
Buy between: 0.22065 to 0.21907
Sell between: 0.22236 to 0.22581
Regards,
Atif Akbar (moon333)

Ripple (XRP) analysisThe XRP/USD pair peaked at $0.232 on December 8, but could not confirm its position in the middle of the $0.23-$0.235 zone. The "ripple" was rejected around $0.231 on December 9, which led to a break below the short-term uptrend channel.
Looking at $0.218 as next point of support before $0.214 - a level that triggered the last upward movement


Ripple or Tsunami????All I see is negative sentiment regarding XRP. The moon boys are back slithering under the rocks they came from since XRP dumped under 0.25 cents. The XRP haters are calling XRP dead and going to zero, using any ounce of FUD they can get their hands on to justify this. Meanwhile the RSI fractal continue to play out and we have a strikingly close resemblance to the immediate time before the last serious life changing move (circled in white). The next significant Gann Date is Dec 22 when I expect the move to occur. 15 days following we have the Gann Angle of Jan 5/6 when I think we will reach local top and have a small consolidation before sometime in March and April when we rip again. Best of luck trading, even if you are one of the trading view scumbag slime balls who lurk here lacking testicular fortitude and looking to get rich stealing ideas instead of shutting your mouths and learning something. LMK what you think in the comments below.
Free Hong Kong

XRP Bull runBull run coming soon? History shown bull runs for XRP to come around Christmas, will history repeat itself?

Strong Support TrendXRP is overdue for a bull run. If we can hold this support line I see a big move coming up. Best of luck:) #HODL

#Ripple#XRPUSD, You have to read itWe recommend a buy signal against the trend.
The Ripple is below average if you look back a year which is a great chance we will see a return to the $ 0.30 average area
The Stochastic reaches an undervalue in the daily graph.
Since the recent ascents, there has been no technical change in the Ichimoku Indicator Cloud.
Target: $ 0.2850

XRPUSD forming bullish Cypher | A good long opportunityPriceline of XRP / US Dollar cryptocurrency is forming bullish Cypher pattern and soon it will be entered in potential reversal zone.
This PRZ area should be used as stop loss in case of complete candle stick closes below this zone.
I have used Fibonacci sequence to set the targets:
Buy between: 0.27844 to 0.27737
Sell between: 0.27929 to 0.28131
Regards,
Atif Akbar (moon333)

#XRPUSD#Ripple, Short scalp then take the trade!Serious resistance line at $ 0.3030 that lasted on 4 hacking attempts.
The positive momentum that surrounds all major currencies (BTC.ETH, LTC ...) must not be ignored
We recommend buying but only after about 50 points drop!
Target: $ 0.3230

XRP/BTC - Up And Down - From One Target To AnotherRipple hits both targets from our previous post. Now what?
Again is approaching the upper trend line of current pattern rising wedge and it would be crucial to break it through. The price which needs to exceed is at 3740 sats. If don't the pullback is expected.
So, take close attention to this price level. In the case of a breakthrough, the next target is at 3900 sats where is the 200 daily moving average.
Trade safe and don't forget to put a stop loss :-)
P.S. General picture remains bullish.

XRP DominanceCurrently touching the 200 EMA
Looking back on the chart, twice that was followed by huge price action


XRP/BTC - Ripple Approaching To The Main Resistance LevelYesterday we have a nice jump and a price increase of around 5%. Today we're in the retracement and so far everything looks good. But as always we have to watch BTC. Any sudden move of BTC may have an impact on almost all alts.
So let's jump into the chart.
XRP now approaching to the main resistance line which had significant role in the past. Besides this, exactly at this resistance line we have 200 Moving Average. This is around 4000 sats and if XRP would be able to break this price level the price will continue to rise to the first midterm target which you can find on the chart.
Personally I'm expecting some sort of pullback at this price level and from this pullback, it will depend on the further development of the price action. Once we will hit this level I will update you.
SHORT TERM DEVELOPMENT:
Yesterday we have a breakout of the rising wedge to the upside. This is a significant sign and gives XRP more power to grow. But here is a "but". We need to stay above the upper trend line of this pattern, otherwise, the price can drop to the lower line of this pattern. So we have to be very careful in the current situation.
Today we can notice successful testing of this trend line which is at the moment of writing at around 3640 sats.
Be safe and don't forget to put a stop loss.
if you find this idea interesting thank you for all of your likes in advance :-)

XRP/BTC - Ripple Chart Nobody Is Seeing Right NowWe monitor this trading pair daily, so don't miss the updates and subscribe to our channel :-)
Today we will look at this trading pair on the weekly timeframe which shows us an extremely bullish opportunity in front of us. For the purpose of this TA we will be using a line break candles. These candles reduce noise and give us a clear direction of the trend. More about this trading technique you can read at the following url: school.stockcharts.com
On the weekly chart, we can notice two consecutive green candles which are very bullish signs for further price development. If history repeats itself we can expect more than 400% gain from the current price. We just need to wait and see what will be happening. I believe that I don't need to talk so much about this chart. With this chart, I would only like to demonstrate to you a big picture of our game plan which we will follow.
For a clearer picture of what's happening right now let's move on the lower timeframe.
Daily Timeframe:
Yesterday we mentioned that retracement would be finished at 3295 sats and exactly this has happened. Today we're up for 9% from our entry price and yesterday's daily candle closes above the major resistance line at 3365 sats. This is a very bullish sign.
Above the current candles, we have the upper trend line of the pattern we're in. This is the rising wedge which usually represents bearish pattern with the continuation of the price action. But .... we need to say that so far we only have 2 touches of this trend line and there is a great probability that this trend line would be broken. If this would be the case we will be facing another resistance at 2000 Moving Average which is at 4083 sats price level. This price level is another short term target. If we go beyond this price level, the parabolic bull run is expected.
So far we have 2 very short term targets, where the price can "swing".
Target1: 3589
Target2: 4083
Retracement:
Everything above 3430 sats is ok. In the next few hours, we're expecting a little retrace. Nothing serious, but we always need to have an eye on BTC. If BTC for some reason will go parabolic in one or other direction this will have an impact on the price of alts.

Dear XRP.. the community is ready. Dear XRP.. the community is ready.
XRP gives for me a really bullish sign. This could be the time where the whole comunnity is wating for.
I think it already started. Next week candles are going to be exciting to see.
Leave your XRP idea behind!
Like if u agree.
#ALTrun

XRPUSD formed a bullish gartley | A long opportunityPriceline of XRP / US Dollar cryptocurrency has formed a bullish Gartley pattern and entered in potential reversal zone.
This PRZ area should be used as stop loss in case of complete candle stick closes below this zone.
Volume profile is showing less interest of traders below the PRZ level but Stochastic is oversold and in bear cross so for secure trade we should wait stochastic to give bull cross then buy from the potential reversal zone.
MACD is turned weak bearish.
I have used Fibonacci sequence to set the targets:
Buy between: 0.27862 to 0.27580
Sell between: 0.28083 to 0.28616
Regards,
Atif Akbar (moon333)

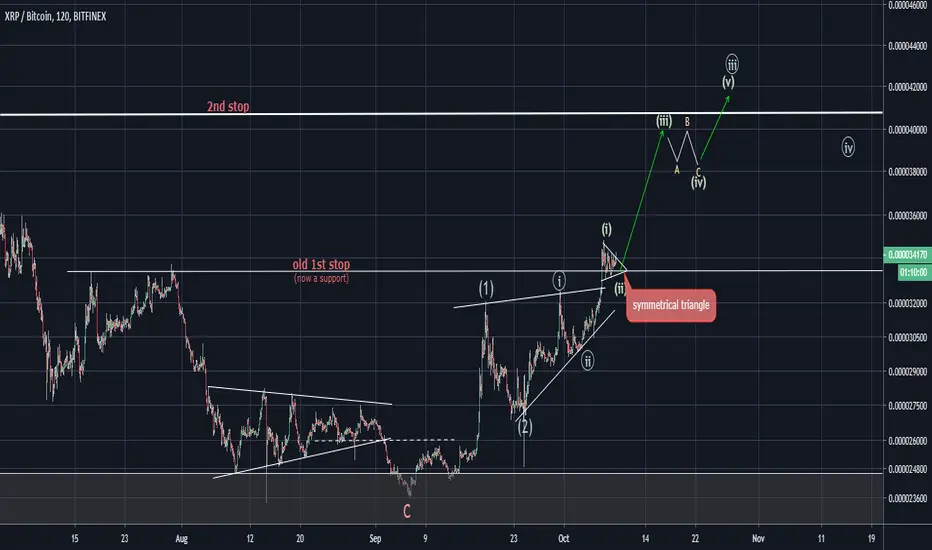
RIPPLE's XRP is now highly likely for a continuationLong position towards our 2nd stop is a choice and opportunity. And our symmetrical triangle that is within the uptrend is bullish in every way and structure from that initial uptrend, but further update shall uphold together with the actions lining.
XRPBTC formed bullish BAT a good buying opportunityThe XRP / Bitcoin has formed a bullish BAT pattern and entered in potential reversal zone.
This PRZ area should be used as stop loss point in case of complete candle stick closes below this zone.
MACD is changed weak bearish from strong bearish.
Stochastic is oversold and has given bull cross.
I have used Fibonacci sequence to set the targets.
Buy between: 0.00002992 to 0.00002959
Sell between: 0.00003071 to 0.00003190
Regards,
Atif Akbar (moon333)

XRPUSD forming a bullish BAT | A good long opportunityOn short term 1 hr chart after forming a bullish Shark pattern priceline of XRP / US Dollar is forming bullish BAT, sofar all legs are driven as required for BAT therefore I am expecting the last leg will be retraced from 0.786 to 0.886 fibonacci and soon it will be entered in potential reversal zone.
This PRZ area should be used as stop loss point in case of complete candle stick closes below this zone.
I have used Fibonacci sequence to set the targets:
Buy between: 0.23583 to 0.23098
Sell between: 0.23710 to 0.24357
Regards,
Atif Akbar (moon333)
