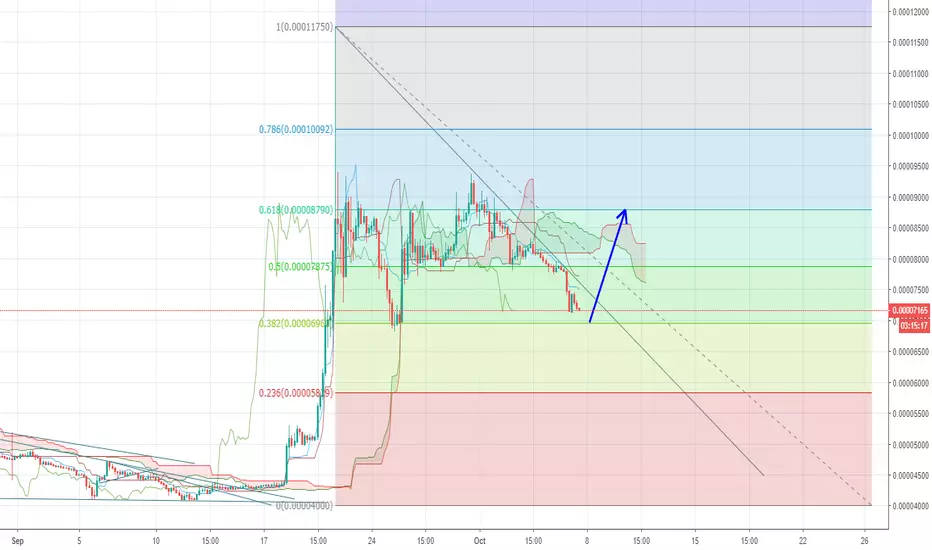
XRP prepping for lift off!XRP has showed its hand and it wants to be bullish, it hit a key swing high level and is looking to retrace. I would be interested in buying the retrace down to .618 fib and target the red level marked which is a key daily level.
Ripplelong

Ripple Long !Ripple is a real-time gross settlement system, currency exchange and remittance network created by Ripple Labs Inc., a US-based technology company. Ripple is built upon a distributed open source internet protocol, and supports tokens representing fiat currency, cryptocurrency, commodities, or other units of value such as frequent flier miles or mobile minutes. Released in 2012, Ripple purports to enable "secure, instantly and nearly free global financial transactions of any size with no charge backs."

XRP/USD Bearish coming. Trend found.We may see an uptrend channel with Ripple until the end of the year.
2018 has been a hard year for cryptos in general.
Stay tuned for next movements. Ripple is actually in the middle of a parallel channel.


#Ripple | $XRP = there's USUALLY a Fake-Out b4 the BREAKOUT!#Ripple | $XRP = there's USUALLY a Fake-Out b4 the BREAKOUT!

We're ALL IN - #Ripple | $XRP will DOUBLE in Price from here!We're ALL IN - #Ripple | $XRP will DOUBLE in Price from here!

XRP/BTC LONG MIDTERM POSITIONDaily stochastics is pointing up
weekly stochastics is point down, not long term bullish,
XRP has potential for a midterm push up with the daily and 4hr stoch pointing up
ONLY IF BTC CAN HOLD ITS WEIGHT
Best entry would be around support line at 6625

Great buy opportunity for XRPBTC on BinanceXRP (Ripple) is ready for it's 3th wave up... Let XRP come down between 0.00006340 and 0.00005940 to go long.
Enjoy the ride :)

XRP/USD A trend from the pastRipple made us happy with a green line in the quotations rates in the first month of autumn. Many experts say that it's time to buy Ripple and wait ... for that very hour when it makes a hit again.
Such a sharp rise in prices is explained by the positive XRP news background. Ripple representatives said that a commercial version of the xRapid payment platform may soon be launched. Besides, it has become known that an American bank which is one of the top 10 largest banks intends to use RippleNet to process international payments of its customers. The technology being applied in practice is a positive factor for the reputation of the project.
Until today, the price chart has attempted to settle in the rising channel, which originated in 2017. However, today we have seen a breakout of support and a decline.
Based on the RSI, the overbought decline can give a new impetus to growth, and, globally, we will see attempts to settle in the rising channel.
In case of a decline, the next pattern target can be 0.36. Intermediate targets at the top are 0.6; 0.75 and 0.96.
We currently recommend buying from the level of 0.42. The transaction target is 0.46 and 0,51.
Instead of a stop order, we would rather use "averaging", because the stop orders are being hunted. We will add levels for averaging to the update of ideas if the market continues to decline. Please, note that it is a high-risk transaction.
We are going to regularly update our short-term recommendations on this tool. We are going to inform you of the transaction entry level, the stop order level and the target for taking profit.
Subscribe and follow our recommendations!
You are going to enjoy the results!

#Ripple | $XRP (LONG) targets! ~by CryptoCurrencyAlerts.com#Ripple | $XRP (LONG) targets! ~by CryptoCurrencyAlerts.com

#Ripple $XRP/USD Longs look like they could go Higher, before...#Ripple $XRP/USD Longs look like they could go Higher, before...

Daily Top Coin Analysis #XRP #XRPBTC (07-10)This is not a call, just for analyzing
Follow me for more signals daily
Long on XRP/USD (Daily)
Currently in buyzone
above the 200 (close) ema: Bullish
Resistance ahead. perhaps buyers will push through.
Exit on bar that closes below ema (low, 26)
if it runs next buy will be in filled area (pullback)

Ripple XRP Price Prediction, Technical Analysis – September 29Ripple XRP is the 3rd largest cryptocurrencies by Market Capitalization is currently trading at $0.565127 USD (+7.36%)
Continue to read more.....

Ripple is on another bullish move, Predictions hereToday the price of Ripple XRP skyrocket more than 10 percent within minutes.
Click here to continue reading...

CRITICAL LEVEL FOR XRP(RIPPLE)!Hello traders,it's been a while since my last analysis as i had to finish my master in economics alongside with my work.
But let's get to the main subject Ripple (xrp).
Recently the world of cryptos is getting hit by multiple sides although in my opinion cryptos are not dead and for some of them the future may be bright.
The leader of all cryptos Bitcoin (BTC) is slightly down today, fluctuating around the $6,300. The major cryptocurrency is currently trading at $6,287 by press time, down 1.5 percent over the past 24 hours.
Total market cap has failed regain the $200 billion threshold over the day, falling below that point this weekend. At press time, the total market capitalization of all cryptocurrencies amounts to $194.5 billion.
Markets appeared to react negatively to the ETFS denials once again and the decision of Goldman Sachs to hault the creating of a crypto desk for now as it had stated at the past.Added to those bad news for cryptos the yesterday’s news that the U.S. Securities and Exchange Commission (SEC) temporarily banned trading in XBT Provider’s exchange-traded notes (ETNs) Bitcoin Tracker One (“CXBTF”) and Ether Tracker One (“CETHF”).
Also yesterday, Ethereum co-founder Vitalik Buterin predicted that there is no chance that the cryptocurrency and blockchain space will see “1,000-times growth” again, stating that the industry is now reaching a “ceiling,” and is moving from “just people being interested” to the stage of “real applications of real economic activity.”
In more bullish news for the industry, the crypto industry today saw the launch of two new stablecoins approved by New York regulators.
TECHNICALS OBSERVATIONS
1.We can notice the three last days sellers are in control and above the mean volume.
2.We can also see some key levels with the dotted black horizontal lines and the downward channel.
3.Rsi with the bullish divergence going for the 20 oversold area.
4.Ichimoku Clouds giving us for a long time now the bearish bias.
5.Notice that if the previous low 0,26646 does not hold we are aiming for the 0,20-0,19 area that we had enormous buying volume at the past implying a good support.
POSSIBLE TRADE
LONG TRADE
ENTRY AT 0,19250-0,20 AREA
STOP LOSS AT 0,15
FIRST TARGET AT 0.3580 AREA
HAPPY TRADING AND HAPPY PROFITS!!
PLEASE LEAVE A COMMENT YOUR OPINION OR EVEN A QUESTION YOU MAY HAVE
KEEP FOLLOWING FOR MORE PROFITS!!

XRP and the PlanetsMercury- Patty Orange
Venus- Neon Green
Jupiter- Pale Brown
Earth- Colbalt Blue
Saturn- Red
Sun- Yellow
Moon- Grey White
Neptune- Sky Blue
Uranus- Purple
The Tunnel Thru The Air

XRP / USDWe have come closer to stronger and more dangerous support, and I hope it will not be broken
If broken, it will increase negative pressure on the price

RIPPLE/BITCOIN Since mid-April, we are in a descending trend.
There is a formation of a downward wedge, the breakdown of which will lead to a change in the trend and a price reversal.
Daytime indicators from 24/07 show the market turn.
It's better to enter the market and wait for a breakdown, placing stop losses under 0.000054.

$XRP Bottom In SightWelcome Back!
The coin for discussion is XRP. I recently made a youtube video where I explained that Ripple would be a good buy soon.
The time for that Buy has never looked better!
Taking a look at Elliott Analysis we just finished a 5x3x5 bearish market correction.
This correction took us all the way back to the 0.883% Fibonacci, one of my favorite places to accumulate when using fibs.
The breakout of the falling wedge indicates a strong reversal to follow.
Time to pack your bags...
Want More Updates?
Subscribe to me on Youtube!
(Link in the description)
God Bless, Vajolleratzii


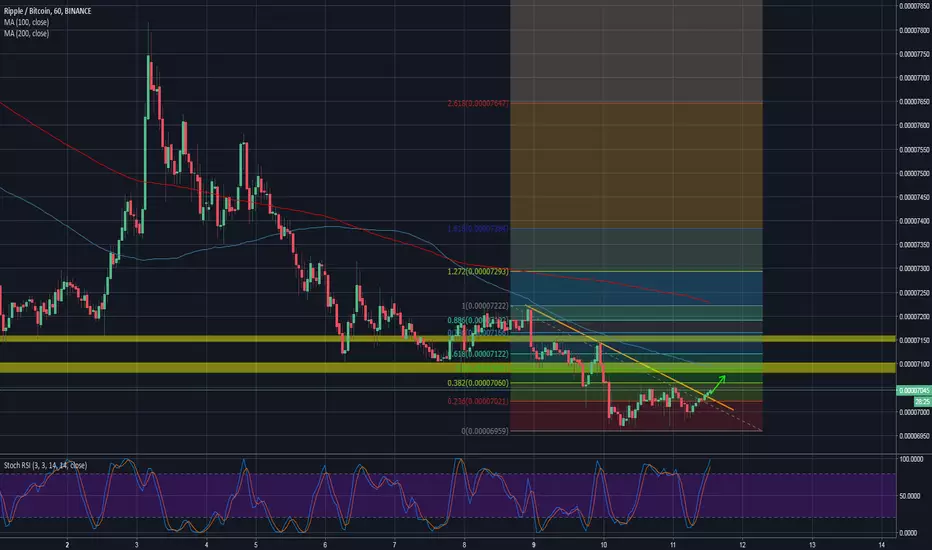
Ripple poking above the resistance A couple of days ago, #XRPBTC created a 3-month low around 0.0000700. The coin has retraced since then as the psychological level around 0.0000700 has provided support and it looks to bounce now. Ripple is also oversold on the daily chart (below 20). The bounce has been further supported by the break of the short-term trend line resistance. Moreover, #XRPBTC is also currently around 38.2% retracement which points out that the healthier retracement maybe on its way targeting at least 61.8% Fibonacci retracement.
If the coin can close above the trend line resistance on the 4H chart, then a long trade is to be issued with the following parameters. If the coin returns below the trend line and creates a failed break out, then the trade is invalidated.
Ripple LONG
Entry: Market current price - 0.00007045
Stop: 0.00007010 (move below trend line resistance)
Target 1: 0.00007090 (50% Fibonacci)
Target 2: 0.00007100 (horizontal resistance)
Target 3: 0.00007120 (61.8% Fibonacci)
Ripple Reaches the Apex...Bull Run Incoming?Hey guys. I'm back with another TA, this time on Ripple! Looking at the 4 hour chart, we can see that XRP has been forming a falling wedge pattern since its highs back in May. Time fibs show that another move may be upon us as we reach the apex of that wedge, signaling a strong move on the 12th of July. Looking at the RSI, we can see that XRP has been showing bullish divergence since it dropped to 8000 sats, failing to make lower lows as price has continued to fall. This bullish divergence is paired with MACD bullish divergence and buy signals crossing on both the AO and TTM Squeeze, which is also squeezing. I've outlined three routes XRP can take from here; go sideways and break out, drop down to 6900 to double bottom and then break out, or fall to 6900 and break through to make lower lows.
Now, my trade setup:
Enter 6900-7150 or on the break of the falling wedge
Stop Loss below 6900 double bottom (3% risk from 7110)
Targets are 7550, 7800, 8050, 8460, 8725 and 8950 short term; 9125, 9425, 9600, 10000, 10130, 11000, 12230, 12400 and 12710 midterm; 13560, 14800, 17600, 18400, 21800, 23000 long term
