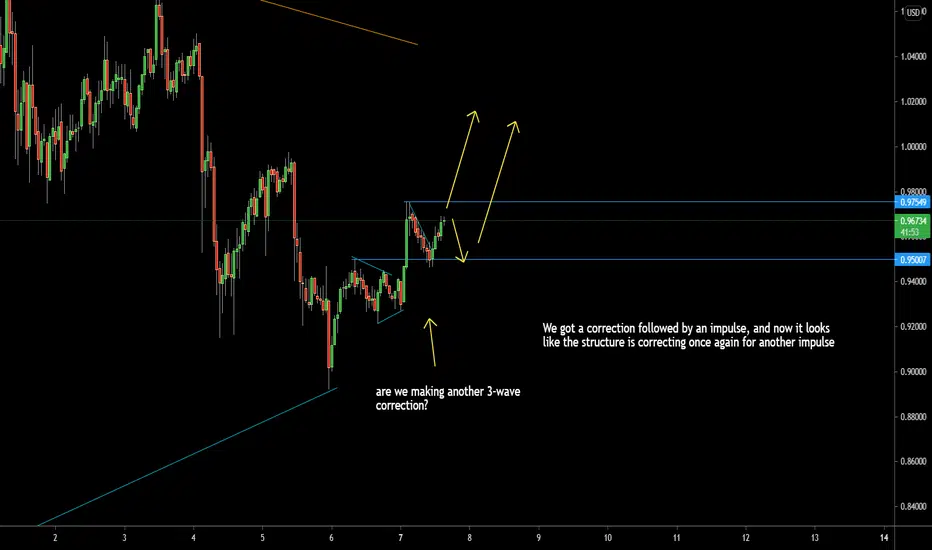
Wednesday: RIPPLE - Week 23Hello Traders! So, ripple did what I expected, as you can see at 'Related Ideas', but now that we have broken the low, and reversed, we have created the start of a possible Expanding Flat. My directional bias now is bullish - and therefore I'm only looking for buy opportunities on lower timeframes.
I will update my idea as the trade progresses if any changes occur and my analysis is wrong, or need to be adapted to the new development of price-action.
Thanks for the support!
-----------------------------------------------------------------------------------------------------------------------
-----------------------------------------------------------------------------------------------------------------------
SMASH that follow button! 👍
💡 Leave a comment and/or message me on how I can improve and provide better content, I'm open to suggestions to create a better experience for you!
RISK DISCLAIMER: Please be advised that I am not telling anyone how to spend or invest their money. Take all of my videos as my own opinion, as entertainment, and at your own risk. I assume no responsibility or liability for any errors or omissions in the content of this channel. This content is for educational purposes only and is not tax, legal, financial, or professional advice. Any action you take on the information in this video is strictly at your own risk. We, therefore, recommend that you contact a personal financial advisor before carrying out specific transactions and investments. There is a very high degree of risk involved in trading. Past results are not indicative of future returns. Inotfancy.com and all individuals affiliated with this channel assume no responsibility for your trading and investment results.
Ripplelong

Monday: RIPPLE - Week 23I will update my idea as the trade progresses if any changes occur and my analysis is wrong, or need to be adapted to the new development of price-action.
Thanks for the support!
-----------------------------------------------------------------------------------------------------------------------
-----------------------------------------------------------------------------------------------------------------------
SMASH that follow button! 👍
💡 Leave a comment and/or message me on how I can improve and provide better content, I'm open to suggestions to create a better experience for you!
RISK DISCLAIMER: Please be advised that I am not telling anyone how to spend or invest their money. Take all of my videos as my own opinion, as entertainment, and at your own risk. I assume no responsibility or liability for any errors or omissions in the content of this channel. This content is for educational purposes only and is not tax, legal, financial, or professional advice. Any action you take on the information in this video is strictly at your own risk. We, therefore, recommend that you contact a personal financial advisor before carrying out specific transactions and investments. There is a very high degree of risk involved in trading. Past results are not indicative of future returns. Inotfancy.com and all individuals affiliated with this channel assume no responsibility for your trading and investment results.
Ripple / XRPUSD: 15min and 1H Chart BUY opportunityHello traders! Watch out for the breakout of the flat-structure that is currently forming, a great buy-setup in the making. The probabilities are good that this will go up, but whether it's the start of the big up move or not is not something anyone can tell. As traders we have to adapt to different market scenarios, we deal with probabilities here. For now I see 2 scenarios, and I will trade according to those, until I see market structure doing something different. Trade with care!
I will update my idea as the trade progresses if any changes occur and my analysis is wrong, or need to be adapted to the new development of price-action.
Thanks for the support!
-----------------------------------------------------------------------------------------------------------------------
-----------------------------------------------------------------------------------------------------------------------
SMASH that follow button! 👍
💡 Leave a comment and/or message me on how I can improve and provide better content, I'm open to suggestions to create a better experience for you!
RISK DISCLAIMER: Please be advised that I am not telling anyone how to spend or invest their money. Take all of my videos as my own opinion, as entertainment, and at your own risk. I assume no responsibility or liability for any errors or omissions in the content of this channel. This content is for educational purposes only and is not tax, legal, financial, or professional advice. Any action you take on the information in this video is strictly at your own risk. We, therefore, recommend that you contact a personal financial advisor before carrying out specific transactions and investments. There is a very high degree of risk involved in trading. Past results are not indicative of future returns. Inotfancy.com and all individuals affiliated with this channel assume no responsibility for your trading and investment results.

XRP 2H SUPPORTXRP 2H support is at ~$0.95-0.98
Try to set some buy orders near the support zone
If XRP holds above the trendline,
the Take-Profit target would be $1.12, $1.20, and $1.28

Ripple / XRPUSD: 4H ChartHello traders! Ripple is making bullish patterns, if we take a look at the daily chart, then we are able to establish a directional bullish bias based on the pattern (check out related ideas), we then take a look at the 4H and see that here we're also making a probable bullish pattern, therefore look for flag patterns (buy-setups). Trade with care!
I will update my idea as the trade progresses if any changes occur and my analysis is wrong, or need to be adapted to the new development of price-action.
Thanks for the support!
-----------------------------------------------------------------------------------------------------------------------
-----------------------------------------------------------------------------------------------------------------------
SMASH that follow button! 👍
💡 Leave a comment and/or message me on how I can improve and provide better content, I'm open to suggestions to create a better experience for you!
RISK DISCLAIMER: Please be advised that I am not telling anyone how to spend or invest their money. Take all of my videos as my own opinion, as entertainment, and at your own risk. I assume no responsibility or liability for any errors or omissions in the content of this channel. This content is for educational purposes only and is not tax, legal, financial, or professional advice. Any action you take on the information in this video is strictly at your own risk. We, therefore, recommend that you contact a personal financial advisor before carrying out specific transactions and investments. There is a very high degree of risk involved in trading. Past results are not indicative of future returns. Inotfancy.com and all individuals affiliated with this channel assume no responsibility for your trading and investment results.

Ripple / XRPUSD: A very good opportunity Hello traders! There's a very good risk/reward opportunity developing in ripple at the moment. We have very clear and distinct patterns that are forming, these patterns repeat themselves and are a very good directional indication. Look for buy-setups on lower timeframes, trade with care!
I will update my idea as the trade progresses if any changes occur and my analysis is wrong, or need to be adapted to the new development of price-action.
Thanks for the support!
-----------------------------------------------------------------------------------------------------------------------
-----------------------------------------------------------------------------------------------------------------------
SMASH that follow button! 👍
💡 Leave a comment and/or message me on how I can improve and provide better content, I'm open to suggestions to create a better experience for you!
RISK DISCLAIMER: Please be advised that I am not telling anyone how to spend or invest their money. Take all of my videos as my own opinion, as entertainment, and at your own risk. I assume no responsibility or liability for any errors or omissions in the content of this channel. This content is for educational purposes only and is not tax, legal, financial, or professional advice. Any action you take on the information in this video is strictly at your own risk. We, therefore, recommend that you contact a personal financial advisor before carrying out specific transactions and investments. There is a very high degree of risk involved in trading. Past results are not indicative of future returns. Inotfancy.com and all individuals affiliated with this channel assume no responsibility for your trading and investment results.

XRP/RIPPLE Fib Circle and Channelcircled touches on the fib level 1
Bounce off the 200 day moving average
within a channel still, pump to push it firmly back in?
Hodl XRP

XRP Beautiful MonthlySitting right above the channel,
so much potential right here just based on TA
I am hodling

XRP lags price action ahead of a 34% launch to $1.44Ripple scaled several resistance levels after the drop to $0.8 last week. The upswing coincided with another win bagged by Ripple Lab attorneys against the Securities and Exchange Commission (SEC) in the ongoing lawsuit.
The US SEC was seeking access to Ripple's communication records when it inquired about the sale of XRP tokens. Judge Sarah ruled to uphold Ripple's client-attorney privilege, dealing the SEC another blow.
Following the win, Ripple's price lifted above $1 and brushed shoulders with $1.1. However, the uptrend slowed down, forcing bulls to seek refuge at $1. Meanwhile, XRP has balanced price action at this level, while buyers look forward to a potentially massive breakout.
Ripple eyes extensive upswing on breaking key technical resistance
The international money transfer token is dancing within the confines of an ascending triangle. This popular and highly bullish technical pattern often forms within an uptrend. However, the pattern has a bullish impulse even when it appears amidst a downtrend.'
As the two trend lines converge, the consolidation nears an end. On the other hand, the ascending lows insinuate that bulls are getting stronger. A break occurs before the lines meet and is characterized by an uptick in trading volume. Triangles have clear breakout measured from the highest to the lowest points. For example, Ripple could swing 34%b higher to trade around $1.44 if the pattern on the chart matures as expected.
The sluggish price action is punctuated by the Relative Strength Index (RSI) and will likely last longer. Similarly, the Moving Average Convergence Divergence (MACD) indicator does not have a defined signal; thus, bullish and bearish forces seem to cancel out, explaining the consolidation at $1.
Ripple intraday levels
Spot rate: $1
Trend: Sideways
Volatility: Low
Support: $0.9 and $0.8
Resistance: $1.1 and $1.2

XRPUSDTIf the uptrend continues, the probability of moving in the first target is towards $ 3. For the second purpose there is a range of $ 7 until mid-August

Long XRPUSDTXRP/USDT Signal
Buy around (1.00-1.04)
Sell Limit
Target 1: (1.10)
Target 2: (1.25)
Target 3: (1.35)

XRP price tiptoes above $1Ripple intends to deal with high gas fees in the non-fungible token (NFT) marketplaces. Despite the NFT flooding the cryptocurrency space headlines, especially in the first quarter of 2021, high gas fees have almost crippled the sector.
The drastic rise in the NFT culture is a story to reckon with; however, users are forces to accept dwindling interest due to the challenging process of transferring ownership.
On the brighter side, Ripple has made public the plan to combat the challenge by integrating the NFT marketplaces on the XRP Ledger. The development will favor both buyers and sellers in the relatively new sector. Moreover, the integration is a welcome for all, keeping in mind that the novel consensus XRPL uses to validate transactions utilizes minimal amounts of energy. According to a statement from the blockchain company:
“Building on the XRP Ledger provides developers a unique opportunity to run more sustainable NFT apps and marketplaces while eliminating a heavy burden for the planet.”
Ripple price rises above $1
Ripple had on Tuesday corrected from levels marginally above $1 after bulls ran out of steam to continue with the uptrend trailing from the primary support at $0.65. Higher buyer congestion at $0.9 ensured that focus remained on recovery; hence, the liftoff above $1.
The Moving Average Convergence Divergence (MACD) indicator validates the prevailing uptrend as it closes the gap to the zero line (0.00). Besides, the MACD keeps widening the divergence above the signal line, affirming the bullish grip.
Similarly, the Relative Strength Index (RSI) has a bullish outlook based on its movement from the oversold area toward the overbought region. On the upside, XRP must deal with the resistance at the 50 Simple Moving Average (SMA), which will allow bulls to gaze at higher levels around $1.4.
Ripple intraday levels
Spot rate: $1
Trend: Bullish
Volatility: Low
Support: $0.9 and $0.8
Resistance: the 50 SMA, $1.2 and $1.4

XRP retesting supportRipple is retesting support at 0.6367 level. We can observe it to respect that price and bouncing of of it. This level represents top of triangle we were talking about in March this year.
On top of that XRP is forming a channel so there is a chance for nice pull back.
Ichimoku: Chikou under price, SS1 under SS2 plus we experienced massive drop below Kumo, retest and further fall.
Personally I took my chances and Bought at the retest and hoping for at least temporary growth. Hopefully Crypto will recover and we well have another move up.


Ripple Fib Circle Bounce XRPAn idea regarding a bounce off the 2.618 fib circle line
the bottom is possibly in?

A Path Through the Clouds XRPArtistic idea for XRP up in the clouds (like how I am right now)
Price should either continue within this channel up or break to the upside
I am long XRP.

Ripple price back to the drawing board, recovery to $1.6 begins Ripple seemed to hold above $1.2 amid the trading on Wednesday. Ripple had shown resilience for a few days as it controlled the correction from $0.71. Several tentative anchor zones had been established, including the confluence formed at $1.4 by the 50 Simple Moving Average (SMA), the 100 SMA on the four-hour chart.
The flash drop continued under $1.2 and $1 before finding support at $0.85. Note that the declines in April were halted at this level, allowing the bulls to take control, bolstering the cross-border transfer token into a trajectory to $0.76.
Ripple exhibits signs of recovery
The international money remittance token has bounced off support at $0.85 and currently trades at $1.07. Holding above $1 is key to nurturing a recovery mission. Moreover, bulls must step above $1.2 to validate the uptrend and revitalize speculation for gains back to $1.6.
According to the Relative Strength Index (RSI), recovery is expected to come into play. The trend strength indicator also identifies oversold and overbought conditions. With the RSI recoiling from levels slightly under 30, the bullish grip is getting tighter. Consequently, the movement toward the midline and the overbought area will suggest that bulls have the upper hand.
It is worth mentioning that the Moving Average Convergence Divergence (MACD) still has a bearish outlook. This indicator tracks the trend direction and measures its momentum. The MACD is helpful when identifying positions to buy the dip and sell the top.
For now, the signal is still bearish and calls for caution among investors. However, as soon as the MACD line (blue) begins to cross above the signal line, the recovery will be confirmed.
Ripple intraday levels
Spot rate: $1.1
Trend: Bullish
Volatility: High
Support: $1 and $0.85
Resistance: $1.2 and $1.4

Bought the Bullflag - XRPJust added more XRP based on the bullflag formation that has resulted
Hope for a Moonshot upwards out of the structure
Using triangles along trend lines

Ripple- 2.5 is the technical targetThis correction for Bitcoin found Ripple consolidating, if we look at the bigger picture, and every new low for Btc had a higher low correspondent in ripples' case.
If we were to make an analogy with recent development in Eth price, we can expect a similar outcome...
In my opinion, with selling power lifted from BTC, a break of triangle's resistance is imminent and 2.5 is the technical target
1.2 si very strong support at this moment

💡Don't miss the great buy opportunity in XRPUSD @Ripple
Trading suggestion:
". There is a possibility of temporary retracement to the suggested support line (1.4485).
. if so, traders can set orders based on Price Action and expect to reach short-term targets."
Technical analysis:
. XRPUSDT is in a range bound, and the beginning of an uptrend is expected.
. The price is above the 21-Day WEMA, which acts as a dynamic support.
. The RSI is at 53.
Take Profits:
TP1= @ 1.6361
TP2= @ 1.7649
TP3= @ 1.9619
TP4= @ 2.0798
TP5= @ 2.6238
SL= Break below S2
❤️ If you find this helpful and want more FREE forecasts in TradingView
. . . . . Please show your support back,
. . . . . . . . Hit the 👍 LIKE button,
. . . . . . . . . . Drop some feedback below in the comment!
❤️ Your Support is very much 🙏 appreciated! ❤️
💎 Want us to help you become a better Forex / Crypto trader ?
Now, It's your turn !
Be sure to leave a comment; let us know how you see this opportunity and forecast.
Trade well, ❤️
ForecastCity English Support Team ❤️

RIPPLE ANALYSIS (BUY)XRPUSD seems to have completed its correction. We can assume this to be a running flat correction as price seems to have failed a complete distance of (a). As can be seen on the chart, both (a) and (c) lie on the ascending support extended from the impulse of the third wave. Also, (a) was a perfect retracement of the .50 fib and (c) was a perfect retracement from .382 level with the ending of the wick at .786 of (a).
With this bullish skew, we can expect a very strong impulse to the upside. My price target on XRP is $12. I will continue updating this chart as price unfolds as has been.
I highly recommend you to review my initial ideas and updates in the links provided below.
Please show your support by leaving a like or comment below and follow for more updates.
Thanks
Good luck trading.

Ripple price firmly holds crucial support as $2 beckons Ripple once again lost steam during an approach to $1.6. A correction began on Wednesday as bears put pressure on the support areas at $1.5 and $1.4, respectively. The news that Tesla had suspended Bitcoin payments for its electric vehicles sent the market in bloodshed led by BTC’s drop under $50,000.
Ripple could resume uptrend toward $2
The retreat from highs close to $1.6 embraced an anchor at $1.33, reinforced by the 50-day Simple Moving Average (SMA). This anchor brought back some semblance of stability in the market and prevented Ripple from exploring levels toward $1.
At the time of writing, XRP trades at $1.35 after bouncing off the critical support. On the upside, a delay is expected at $1.4, but once the hurdle is broken, Ripple bulls may start lifting to higher levels.
The Relative Strength Index (RSI) reveals that the bullish grip is becoming stronger. This move comes after the trend strength indicator bounced off support at 45 and is currently moving to the midline. A continued movement toward the overbought region would affirm to the investors that the slightest resistance path is upward.
It is worth mentioning that Ripple is not out of the woods yet based on the Moving Average Convergence Divergence (MACD). For instance, the MACD line’s divergence under the signal line keeps widening, insinuating that the bearish outlook is apparent. Therefore, it calls for caution and waiting for a validated break before going all-in on XRP.
Ripple intraday levels
Spot rate: $1.35
Trend: Bullish
Volatility: Low
Support: $1.33, $1.2 and $1
Resistance: $1.4, $1.6 and $1.8
