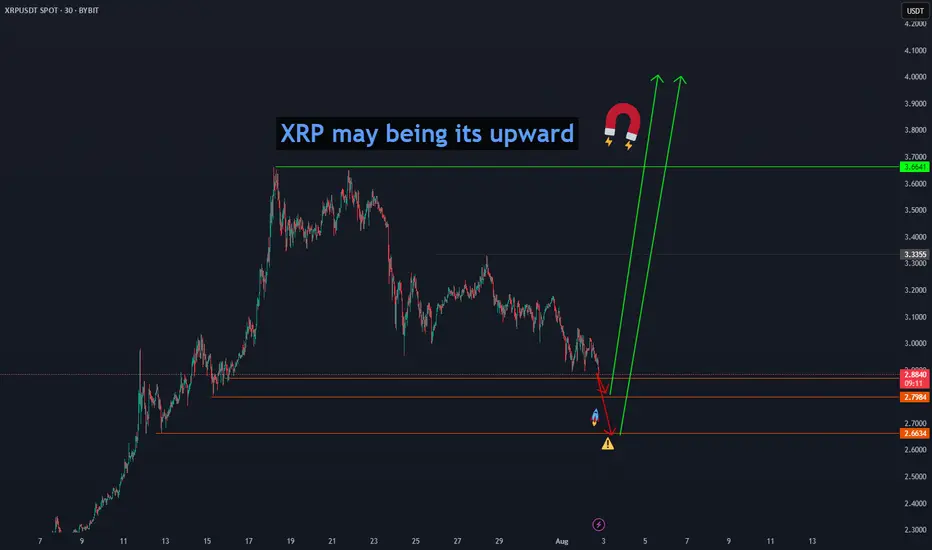
XRP may being its upward" Ripple (XRP) may begin its upward move from the price levels of 2.8865, 2.7984, and 2.6634, aiming for a first confirmed target at 3.6641 and then $4." BINANCE:XRPUSDT
Rippleusdt
XRP/USD Chart Hack – Rob the Market Before the Bears Do🏴☠️💸 XRP/USD Crypto Market Heist Plan: Thief Trader Style 💰📈
"Break the Vault, Rob the Trend – One Candle at a Time!"
🌍 Hi! Hola! Ola! Bonjour! Hallo! Marhaba! 🌍
To all fellow money makers, day robbers & chart thieves... welcome to the vault!
We’re diving into the XRP/USD (Ripple vs. U.S. Dollar) with a bold Thief Trading™ Strategy, blending technical mastery and market intuition.
📊 THE PLAN: Rob the Resistance – Swipe the Highs
🔥 Based on Thief Trading-style TA & FA combo, here's the master heist setup:
Long Bias ⚔️
Target: The High Voltage Resistance Zone
Status: Overbought + Trap Level = High Risk, High Reward
Market Mood: Bullish but risky – consolidation & reversal zones ahead
Crowd Behavior: Bearish robbers strong above, but we strike below
🧠 Thief Wisdom:
“The vault's open, but not every vault is unguarded. Wait, plan, attack with strategy.”
📥 ENTRY PLAN
The Heist Begins at the Pullback...
Use Buy Limit Orders (Thief Style: DCA / Layering)
Entry Zones: Near recent swing lows or within 15–30 min pullbacks
Let the price come to your trap – precision is our weapon
🛡️ STOP LOSS STRATEGY
Guard Your Loot – Always Secure Your Exit
SL Example: 2.8500 (3H TF swing low)
Customize SL based on:
⚖️ Your lot size
🎯 Risk tolerance
🔁 Number of entry layers
Remember: We don’t chase losses – we protect capital like it's gold
🎯 TARGET
Final Take-Profit: 4.0000
But hey… Thieves escape before alarms ring!
💡 If momentum slows, don’t be greedy. Exit smart, exit rich.
📡 FUNDAMENTAL + SENTIMENTAL OVERVIEW
The bullish bias is supported by:
📰 Macro Events
📊 On-Chain Signals
📈 COT Reports
🔗 Intermarket Correlations
📢 Sentiment Analysis
👉 Stay updated with the latest data — knowledge is the thief’s ultimate tool.
⚠️ TRADING ALERT – News Can Wreck the Heist
To survive news spikes:
🚫 Avoid entries during high-impact releases
📉 Use trailing SL to protect your open profits
🛑 Adjust exposure during uncertain volatility
❤️ SUPPORT THE CREW – BOOST THE PLAN
If this plan added value, hit the 🔥BOOST🔥 button.
It helps grow the Thief Trading Team, and together we rob smarter, not harder.
💬 Drop your feedback, thoughts, or charts below – let’s build the crew!
💎 Every candle tells a story. We don’t follow the trend – we rob it.
💣 Stay alert, stay rogue, and I’ll see you at the next market heist.
💰 Until then… chart smart, trade savage. 🐱👤💵

"XRP/USD: Bullish Raid Alert! Ride or Escape Fast!"🚨 XRP/USD HEIST ALERT: Bullish Loot Grab Before the Escape! (Thief Trading Style) 🚨
🌟 Greetings, Market Pirates & Profit Raiders! 🌟
(Hola! Oi! Bonjour! Hallo! Marhaba!)
🔥 Thief Trading Strategy Activated! 🔥
Based on ruthless technical + fundamental analysis, here’s how we SWIPE THE LOOT from XRP/USD (Ripple vs. Dollar). Follow the chart’s Long Entry blueprint—our target is the high-risk YELLOW ATR ZONE (overbought, consolidation, potential reversal). Beware of traps! Bears and cops lurk here, but we strike smart.
🏴☠️ ENTRY:
"Vault’s cracked—bullish loot is FREE GAME!"
Buy Limit Orders preferred (15-30 min timeframe near swing lows/highs).
Aggressive? Swipe instantly—just mind the cops (liquidity traps).
🛑 STOP LOSS (Save Your Loot!):
Swing Thieves: 4H recent wick low ($2.1500).
Risk Tactics: Adjust SL based on your trade size, orders, and guts.
🎯 TARGETS:
Main Take: $2.5400 (or escape earlier if momentum fades).
Scalpers: Longs ONLY! Trail your SL—no greedy holds!
💣 KEY DRIVERS (Why This Heist Works):
Bullish momentum brewing (check fundamentals, COT, on-chain data 👉go ahead to klick 🔗).
NEWS ALERT: Avoid fresh trades during high-impact news—protect open positions with trailing stops!
💥 BOOST THIS HEIST!
Hit 👍 LIKE, 🔔 FOLLOW, and 💬 COMMENT to fuel our next robbery plan. Together, we steal the market’s cash—EVERY. SINGLE. DAY.
📢 Final Warning: Markets shift FAST. Stay sharp, adapt, and CASH OUT BEFORE THE COPS ARRIVE.
🤑 Stay tuned—more heists incoming! 🐱👤🚀

XRP/USD: "Bandit’s Breakout" – MA Confirms the Profit Raid!🔥 XRP/USD HEIST ALERT: The Bullish Bank Robbery Plan (MA Breakout Strategy) 🔥
🌟 Attention, Market Pirates & Profit Bandits! 🌟
"The best traders are just thieves with a calculator."
🚨 Mission Brief (XRP/USD):
Based on Thief Trading tactics, we’re plotting a bullish heist on Ripple. High-risk, high-reward—police traps, fakeouts, and overbought zones be damned!
📌 ENTRY ZONE (Breakout or Pullback Heist)
"The heist begins at MA breakout!"
Buy Stop: Above 2.2200 (confirmed candle close).
Buy Limit: Near swing lows (15m/30m pullback).
🚨 Set an ALERT! Don’t miss the breakout.
🛑 STOP LOSS (Escape Route)
"No stop loss till breakout—then hide it like stolen cash!"
Thief SL: Nearest swing low (3H candle wick) ~2.1000.
Rebels adjust at own risk—your funeral, not mine. 😎
🎯 TARGETS (Profit Hideouts)
First Escape: 2.2400 (scalp & run).
Swing Bandits: Ride longer (trail SL advised).
⚡ SCALPERS’ NOTE:
Longs ONLY. Rich? Go all-in. Broke? Join swing heists.
Trailing SL = Your getaway car.
📡 MARKET CONTEXT (Why This Heist?)
Bullish momentum + consolidation breakout play.
Fundamentals? Check COT, on-chain, macro trends (check everything here 👉🔗🔗).
🚨 NEWS WARNING (Avoid Police Raids)
Avoid new trades during high-impact news.
Trailing stops = Your invisible cloak.
💥 BOOST THE HEIST!
"Like & Boost this idea—strengthen our robbery squad! More alerts = more stolen profits. 🚀💰
Next heist coming soon… Stay greedy, thieves. 😈

XRP: A Trader's Gambit or an Investor's FortuneXRP at the Crossroads: A Trader's Gambit or an Investor's Fortune?
The digital asset XRP currently finds itself in a fascinating and precarious position, presenting a narrative so divided it could belong to two entirely different assets. For the short-term trader, the charts are painting a picture of tension and potential reversal, a technical puzzle where a wrong move could be costly. For the long-term investor, the horizon holds the promise of a revolutionary technology poised to disrupt a trillion-dollar industry, with price targets that seem almost unimaginable from today's standpoint. This analysis delves into this profound dichotomy, exploring the immediate bearish signals that tempt traders to short, while simultaneously mapping out the ambitious, utility-driven path that could lead XRP to astronomical new heights.
The Short-Term Squeeze: A Technical Tightrope Walk
Observing XRP's recent price action is like watching a high-stakes chess match. The token has demonstrated a textbook reaction to a critical trendline, a move that likely ensnared traders who were too quick to bet on a price collapse. By bouncing precisely where technical theory suggested it might, it "trapped" these early sellers, forcing them to reconsider their positions as the price stabilized and began to creep upward.
Following this maneuver, the price has embarked on a cautious ascent from the $2.20 support zone. As of early July, XRP has managed to climb above the $2.2320 mark and is holding its ground above the 100-hourly Simple Moving Average, both of which are constructive short-term signals. The immediate focus has now shifted to a key resistance level at $2.285. A decisive break above this ceiling could signal that the bulls have taken control, potentially triggering a new wave of buying pressure.
However, a significant hurdle lies in wait. On the hourly chart, a short-term contracting triangle has formed, with its upper boundary creating firm resistance at the $2.280 level. Such patterns are known to be harbingers of volatility; they represent a period of consolidation and coiling energy before the price makes a powerful move in one direction. While a breakout to the upside is possible, the bearish case remains equally compelling.
This bearish outlook is centered on a previously marked supply zone that the price is now approaching. A supply zone is an area on the chart where a glut of sell orders is historically clustered. If the price pushes into this zone without first building a stronger foundation of support by drawing in buying interest (grabbing liquidity) from lower levels, it risks hitting a brick wall. The selling pressure could overwhelm the buying momentum, leading to a swift and strong rejection. For traders anticipating this outcome, it presents a prime opportunity to initiate a short position, betting on a significant price decline. The level of $2.28 is therefore not just a resistance point; it's a critical battleground that will likely dictate the next major directional move.
The Long-Term Vision: The $35 Moonshot Fueled by Global Remittances
To truly understand the fervent belief held by long-term XRP holders, one must look beyond the flickering candles of the hourly charts and focus on the asset's fundamental purpose. The most powerful bullish argument for XRP is not based on technical patterns, but on its potential to fundamentally reshape the global remittance market.
The remittance industry—the process of individuals sending money across borders to their families—is a colossal and ever-growing sector of the global economy. Projections indicate that this market will swell from nearly $800 billion to over $1.06 trillion by 2029. For decades, this system has been notoriously inefficient, characterized by exorbitant fees that eat into the funds sent home and settlement times that can stretch for days, leaving families waiting for critical support.
This is the problem that Ripple, the technology company behind XRP, was designed to solve. By utilizing XRP as a neutral bridge asset, Ripple's payment network can facilitate cross-border transactions in a matter of seconds, not days. The cost of these transactions is a tiny fraction of what traditional banking intermediaries charge. This value proposition of speed and savings is not merely theoretical; Ripple has been actively forging partnerships to implement this technology in key remittance corridors, including those connecting to Mexico, the Philippines, Brazil, and nations in the Middle East.
The audacious price prediction of $35 per XRP stems from a model that quantifies this potential. The logic unfolds as follows: if XRP were to successfully capture a significant portion, say 25%, of the projected $1.06 trillion remittance market by 2029, the network's intrinsic value would be immense. Applying a valuation multiple similar to those of established payment processing giants, the network could be valued at over $500 billion. With a circulating supply of approximately 60 billion tokens, a simple calculation yields a fundamental value of around $8.90 per XRP.
However, the cryptocurrency market is driven by more than just underlying utility; it is heavily influenced by demand, speculation, and investor sentiment. The model accounts for this by applying a "demand premium." If widespread adoption and recognition of XRP's role create a surge in demand, this could act as a multiplier on its fundamental value. A 4x demand premium, a figure not uncommon during crypto bull markets, applied to the $8.90 base valuation, is what brings the target to an eye-watering $35.56. This forecast, while undeniably ambitious, is anchored in the tangible prospect of solving a multi-trillion-dollar real-world problem.
Bridging the Gap: Catalysts for a New Era
The journey from a price of around $2.22 to a potential $35 is long, and its success hinges on several critical factors. A major cloud that long hung over XRP was its legal battle in the United States, which created uncertainty and stifled institutional adoption. However, significant legal victories have provided much-needed regulatory clarity, affirming that XRP itself is not inherently a security. This has been a pivotal de-risking event, opening the doors for financial institutions to begin integrating and utilizing the asset with newfound confidence.
The next major potential catalyst on the horizon is the approval of a spot XRP Exchange-Traded Fund (ETF). Following the successful launch of ETFs for other major cryptocurrencies, many in the industry see an XRP ETF as a logical next step. Such a product would be a game-changer, providing a regulated and easily accessible bridge for a vast pool of capital from traditional finance to flow into the XRP market. It would allow pension funds, asset managers, and retail investors to gain exposure to XRP through their standard brokerage accounts, potentially triggering a massive wave of demand.
Of course, the path is not without its challenges. XRP operates in a competitive environment, with other blockchain projects and even modernizing traditional systems like SWIFT vying for a piece of the cross-border payments pie. Continued innovation, network growth, and the expansion of strategic partnerships will be paramount to securing its market position.
Conclusion: A Dichotomy of Destiny
In its current state, XRP embodies the dual nature of the cryptocurrency market. It is at once a playground for nimble traders, who see the immediate risks and rewards in its tight price consolidation, and a beacon for long-term visionaries, who see the blueprint for a future global financial standard. The bearish case for a short-term rejection from the $2.28 supply zone is technically sound and warrants caution. A failure to break through this level could easily send the price back down to retest lower supports.
Simultaneously, the long-term bullish thesis is one of the most compelling in the entire digital asset space. It is not built on hype alone, but on a clear and demonstrable utility aimed at a vast and inefficient market. The prospect of a $35 XRP is a testament to this potential.
Ultimately, the decision of whether to view XRP as a short-term trade or a long-term investment is a reflection of one's own timeline, risk tolerance, and belief in its underlying technology. XRP is at a critical inflection point, and whether it succumbs to short-term pressures or breaks free to pursue its grander ambitions will be a defining story in the continuing evolution of finance.

"Ripple" Crypto Heist - Bullish Breakout Plan!🌍 XRPUSD Crypto Heist Plan: Unleash the Thief Trading Style! 🤑💸🚀
Dear Market Mavericks & Crypto Bandits, 🏴☠️
Get ready to pull off the ultimate XRPUSD market heist with our Thief Trading Style, blending razor-sharp technical analysis and cunning fundamental insights! 📊🔥 Our mission? Storm the market, grab those bullish profits, and escape before the Dangerous Red Zone traps us in overbought chaos, consolidation, or a bearish reversal. 💥 Let’s outsmart the market and cash out like legends! 🏆🎉
📈 The Heist Blueprint: Long Entry Strategy
Entry Point 🚪:
The breakout is your signal! Wait for XRPUSD to smash through the Moving Average (MA) at 2.5000—that’s your green light for bullish glory! 🌟
Pro Tip:
Set Buy Stop Orders just above the MA for breakout confirmation.
OR place Buy Limit Orders at the most recent 15M/30M swing low/high for pullback entries.
Set an ALERT on your chart to catch the breakout in action! 🔔
Stop Loss (SL) 🛑:
Breakout traders: Hold off on setting your SL until the breakout confirms. Place it at the recent 4H swing low (2.3000) for swing/day trades.
Risk Management: Adjust SL based on your lot size, risk tolerance, and multiple orders. Play it smart—this is your safety net! ⚠️
Rebels beware: If you stray from the plan, you’re dancing with fire. Own the risk! 🔥
Take Profit (TP) 🎯:
Aim for 2.7500—our golden exit.
Escape Plan: If the market screams overbought or shows reversal signs, get out early! Don’t get caught in the Red Zone trap. 🚨
🧲 Scalpers’ Corner 👀
Scalp LONG only—ride the bullish waves! 🌊
Got big capital? Dive in now. Smaller stack? Join the swing traders for the full heist.
Use Trailing Stop-Loss to lock in gains and protect your loot. 💰
📡 Market Pulse: Why XRPUSD?
The XRPUSD market is in a neutral trend with a high probability of bullish momentum. Here’s the intel driving our heist:
Fundamentals: Dive into macroeconomic data, COT reports, geopolitical events, and news sentiment.
Intermarket Analysis: Watch correlated assets for clues.
Seasonal & Positioning Trends: Align with the market’s rhythm.
Future Targets: Check the Overall Score for a full breakdown! 👉🌏🔗
⚠️ Trading Alert: News & Risk Management 📰
News releases can flip the market like a switch! Protect your positions:
Avoid new trades during high-impact news.
Use Trailing SL to secure profits and minimize losses.
Stay sharp—volatility is our friend, but only if we’re prepared!
💪 Join the Heist & Boost the Plan!
Hit the Boost Button to supercharge our Thief Trading Style and make this heist legendary! 🚀 Every boost strengthens our crew, helping us plunder profits daily with ease. 💥 Let’s dominate the XRPUSD market together! 🤝
Stay tuned for the next heist plan! 🐱👤 Keep your charts locked, your alerts set, and your trading spirit wild. See you in the profits, bandits! 🤑🎉
#ThiefTrading #XRPUSD #CryptoHeist #TradingView #MakeMoney

XRP/USD "Ripple vs US Dollar" Crypto Market Heist Plan🌟Hi! Hola! Ola! Bonjour! Hallo! Marhaba!🌟
Dear Money Makers & Robbers, 🤑💰✈️
Based on 🔥Thief Trading style technical and fundamental analysis🔥, here is our master plan to heist the XRP/USD "Ripple vs US Dollar" Crypto market. Please adhere to the strategy I've outlined in the chart, which emphasizes short entry. Our aim is the high-risk Green Zone. Risky level, oversold market, consolidation, trend reversal, trap at the level where traders and bullish robbers are stronger. 🏆💸Book Profits Be wealthy and safe trade.💪🏆🎉
Entry 📈 : "The vault is wide open! Swipe the Bearish loot at any price - the heist is on!
however I advise to Place buy limit orders within a 15 or 30 minute timeframe most recent or swing, low or high level. I Highly recommended you to put alert in your chart.
Stop Loss 🛑:
Thief SL placed at the recent / swing low level Using the 4H timeframe (2800) swing trade basis.
SL is based on your risk of the trade, lot size and how many multiple orders you have to take.
Target 🎯: 1500 (or) Escape Before the Target
🧲Scalpers, take note 👀 : only scalp on the Short side. If you have a lot of money, you can go straight away; if not, you can join swing traders and carry out the robbery plan. Use trailing SL to safeguard your money 💰.
📰🗞️Read Fundamental, Macro, COT Report, On Chain Analysis, Sentimental Outlook, Intermarket Analysis, Future Prediction:
XRP/USD "Ripple vs US Dollar" Crypto market is currently experiencing a Bearish Trend (Higher chance for Bullish in Future),., driven by several key factors.
1. Fundamental Analysis⚡⭐
Fundamental analysis assesses XRP’s intrinsic value by evaluating adoption, regulatory environment, technological developments, and market demand.
Adoption: XRP, developed by Ripple, is tailored for cross-border payments and liquidity management. By March 2025, expanded partnerships with financial institutions could enhance its utility, driving demand and supporting price growth.
Regulatory Environment: The SEC lawsuit against Ripple remains a pivotal factor. A favorable resolution by 2025 could eliminate uncertainty, boosting investor confidence and XRP’s price. Conversely, ongoing legal challenges might hinder growth.
Technological Developments: Improvements to the XRP Ledger, such as faster transaction speeds or new features, could reinforce its competitive advantage over other cryptocurrencies and traditional payment systems.
Market Demand: XRP’s ability to lower costs and accelerate international transfers increases its appeal. Growing global demand for efficient payment solutions could elevate its value.
Conclusion: The fundamental outlook is cautiously optimistic, with significant upside potential linked to regulatory clarity and increased adoption.
2. Macroeconomic Factors⚡⭐
Macroeconomic conditions shape investor risk appetite and influence cryptocurrency prices.
Global Economy: A stable or growing global economy in 2025 could encourage investment in risk assets like XRP. A recession, however, might trigger a shift to safer assets, pressuring XRP’s price downward.
Interest Rates: Low or declining rates could make XRP more appealing than yield-bearing assets. Rising rates might reduce its attractiveness.
Inflation: High inflation could position XRP as an inflation hedge, attracting investors. Deflationary trends might dampen demand for speculative assets.
Geopolitical Events: Stability in major markets (e.g., U.S., Asia) could foster bullish sentiment, while geopolitical tensions might heighten volatility.
Conclusion: Assuming a stable economy with low interest rates and moderate inflation in 2025, macroeconomic conditions could support XRP’s growth.
3. Commitments of Traders (COT) Data⚡⭐
COT data provides insights into market sentiment by showing the positions of large traders and institutions.
Large Traders (Non-Commercial): A net long position (e.g., a long-to-short ratio of 1.5:1) indicates bullish sentiment among institutional players, suggesting expectations of price appreciation.
Small Traders (Commercial): If retail traders are also predominantly long, this could amplify bullish momentum. A net short position might reflect caution or hedging strategies.
Conclusion: With large traders net long, COT data leans bullish, assuming retail sentiment aligns similarly.
4. On-Chain Analysis⚡⭐
On-chain metrics reveal network activity and user behavior, key indicators of XRP’s health and adoption.
Active Addresses: An increase in active addresses suggests growing usage and adoption, supporting price stability and potential growth.
Transaction Count: Higher transaction volumes indicate greater utility, possibly driven by real-world applications like remittances.
Validator Activity: Robust validator participation and network uptime signal a secure and reliable network.
Whale Activity: Accumulation by large holders (whales) reflects bullish intent, while distribution could indicate selling pressure.
Conclusion: Rising active addresses and transaction counts point to strong network activity, supporting a positive price outlook.
5. Intermarket Analysis⚡⭐
Intermarket analysis examines XRP’s correlations with other asset classes.
Stock Market: A positive correlation with tech-heavy indices like the NASDAQ suggests XRP could rise alongside tech sector strength.
US Dollar: A negative correlation with the US Dollar Index (DXY) implies that a weaker dollar might lift XRP prices.
Other Cryptocurrencies: XRP often tracks Bitcoin and Ethereum; a broader crypto bull run could propel XRP higher.
Conclusion: Favorable conditions—such as a robust tech sector and a weaker dollar—could align with bullish intermarket signals for XRP.
6. Market Sentiment Analysis⚡⭐
Sentiment analysis evaluates the mood across different investor groups.
Retail Investors: Positive sentiment on platforms like Twitter and Reddit (e.g., 70% bullish) reflects retail optimism, often fueling momentum.
Institutional Investors: Bullish sentiment, inferred from COT data, suggests confidence among sophisticated players.
Fear and Greed Index: A reading of 70 indicates greed, signaling strong bullishness but cautioning against potential overbought conditions.
Conclusion: Broadly positive sentiment, tempered by high greed levels, supports a bullish yet cautious perspective.
7. Next Trend Move and Future Trend Prediction⚡⭐
Projected price movements for XRP/USD are based on current trends and analysis:
Bullish Outlook:
Short-Term: $2.50–$2.60
Medium-Term: $3.00–$3.50
Long-Term: $4.00–$5.00
Key Drivers: Regulatory clarity, adoption growth, and supportive macro conditions.
Bearish Outlook:
Short-Term: $2.30–$2.20
Medium-Term: $2.00–$1.80
Long-Term: $1.50–$1.20
Key Risks: Regulatory setbacks, macroeconomic headwinds, or technological challenges.
Final Prediction: The analysis leans cautiously bullish, but bearish (short) scenarios remain credible if risks like regulatory uncertainty or economic shifts emerge. Investors should watch catalysts closely to determine XRP’s next move—upward or downward.
8. Overall Summary Outlook⚡⭐
The outlook for XRP/USD is cautiously bullish, supported by:
Strong Fundamentals: Adoption and technological utility provide a solid base.
Supportive Macro Conditions: Low rates and stable growth favor risk assets.
Bullish COT Data: Institutional optimism signals confidence.
Healthy On-Chain Metrics: Network activity reflects real demand.
Favorable Intermarket Signals: Correlations with tech and a weaker dollar are positive.
Positive Sentiment: Investor optimism drives momentum.
Risks: Regulatory uncertainty, macroeconomic shocks, or profit-taking could temper gains. On balance, the evidence favors growth.
📌Keep in mind that these factors can change rapidly, and it's essential to stay up-to-date with market developments and adjust your analysis accordingly.
⚠️Trading Alert : News Releases and Position Management 📰 🗞️ 🚫🚏
As a reminder, news releases can have a significant impact on market prices and volatility. To minimize potential losses and protect your running positions,
we recommend the following:
Avoid taking new trades during news releases
Use trailing stop-loss orders to protect your running positions and lock in profits
💖Supporting our robbery plan 💥Hit the Boost Button💥 will enable us to effortlessly make and steal money 💰💵. Boost the strength of our robbery team. Every day in this market make money with ease by using the Thief Trading Style.🏆💪🤝❤️🎉🚀
I'll see you soon with another heist plan, so stay tuned 🤑🐱👤🤗🤩

Why Is XRP Surging? Here’s What’s Fueling the RallyAfter a period of uncertainty, XRP has made a strong comeback, reclaiming the $2.70 level and reigniting bullish sentiment across the market. With the SEC’s pending decision on an XRP ETF, speculation is growing that this could be the catalyst for a major price breakout.
XRP has gained 6.84% in the past 24 hours, trading with a volume of $5.33 billion. Over the past week, it’s up 9.59%, and its YTD performance stands at +29.95%, signaling strong long-term momentum.
What’s Driving the XRP Rally?
📌 SEC ETF Decision – Growing optimism that approval could push XRP to new highs.
📊 RSI Remains Above Neutral – Increased buying pressure signals market confidence.
📈 SMA Support Holding Strong – The trend remains bullish, supporting further upside.
What’s Next for XRP?
If the rally holds, XRP could test $3.00 next, with a successful breakout targeting $3.50. However, if momentum fades, key support levels lie at $2.50 and $2.00.
With XRP holding a top 3 spot in the crypto rankings, its next move could set the tone for the broader market. Will ETF speculation fuel a breakout, or will resistance hold?

XRP Under Pressure: Inflows RiseXRP, the cryptocurrency closely associated with Ripple Labs, finds itself at a precarious crossroads. While the digital asset has shown glimpses of potential in the past, recent market indicators paint a concerning picture, with traders increasingly taking short positions and exchange inflows on the rise. This bearish sentiment is further compounded by negative perpetual funding rates, suggesting a prevailing bias towards short positions in the derivatives market. Despite these challenges, pockets of optimism remain, with some analysts predicting a brighter future for XRP and its underlying technology.
Negative Funding Rates and Short Positions
Perpetual futures contracts, a popular instrument among cryptocurrency traders, allow investors to speculate on the price of an asset without an expiration date. Funding rates associated with these contracts reflect the sentiment of the market. A positive funding rate indicates that traders are willing to pay a premium to hold long positions, signaling bullish sentiment. Conversely, a negative funding rate suggests that short positions are dominant, indicating a bearish outlook.
Currently, XRP's perpetual funding rates are consistently negative, a clear sign that traders are overwhelmingly betting against the cryptocurrency. This bearish bias is a cause for concern, as it can create a self-fulfilling prophecy, where negative sentiment leads to further price declines, triggering more short positions and exacerbating the downward spiral.
Rising Exchange Inflows
Another worrying trend for XRP is the increasing inflows into cryptocurrency exchanges. When investors deposit their XRP holdings into exchanges, it often signals an intention to sell. A surge in exchange inflows can put downward pressure on the price of XRP, as the increased supply of the cryptocurrency on exchanges can outstrip demand.
The combination of negative funding rates and rising exchange inflows paints a grim picture for XRP in the short term. These indicators suggest that traders are anticipating further price declines and are positioning themselves accordingly.
XRP Ledger Stability and Innovation
Despite the bearish price outlook, the XRP Ledger (XRPL), the underlying blockchain technology behind XRP, has demonstrated resilience and innovation. Recently, the XRPL experienced a brief downtime, raising concerns about its stability. However, the network quickly "self-healed," showcasing its robust design and ability to recover from disruptions.
Ripple's CTO, David Schwartz, explained that the XRPL is designed to withstand potential failures, even in scenarios where all validators might perceive an issue with the network. This built-in redundancy and fault tolerance are crucial for ensuring the long-term stability and reliability of the XRPL.
Furthermore, the XRPL has witnessed the growing adoption of its stablecoin, RLUSD. In just two months, RLUSD has facilitated over 105,000 transactions on the XRPL, demonstrating the increasing demand for stablecoins within the XRP ecosystem. The success of RLUSD highlights the potential of the XRPL to support a wide range of financial applications and use cases.
The Path Ahead for XRP
XRP finds itself at a critical juncture. The negative funding rates and rising exchange inflows indicate a bearish short-term outlook. However, the resilience of the XRPL, the growing adoption of RLUSD, and the persistent optimism of some market participants suggest that XRP's story is far from over.
The cryptocurrency market is known for its volatility, and predicting future price movements with certainty is impossible. While the current indicators are concerning, they do not necessarily dictate the long-term fate of XRP. The cryptocurrency's future will depend on a variety of factors, including regulatory developments, technological advancements, and market sentiment.
For now, XRP investors should remain cautious and closely monitor market trends. The negative funding rates and rising exchange inflows should serve as a warning sign, but they should not overshadow the underlying potential of the XRPL and the ongoing developments within the XRP ecosystem. Only time will tell whether XRP can overcome its current challenges and fulfill the lofty expectations of its most ardent supporters.


XRP: Is the $3.00 Breakout the Start of a New Rally!?XRP Token ( BINANCE:XRPUSDT ) , backed by Ripple , a pioneer in international financial transfers, this token has once again captured the market's attention. Is this growth sustainable or just a temporary surge?
Let's take a closer look.
Fundamental Analysis :
1- Legal Advancements(Recent Court Victories) : Ripple has achieved successes in its legal battles against the U.S. Securities and Exchange Commission (SEC), reducing legal uncertainties surrounding XRP and boosting investor confidence.
2- Strategic Partnerships(Collaborations with Major Financial Institutions) : Ripple has initiated partnerships with banks and financial institutions worldwide, especially in Europe and Asia, aiding in the broader adoption of XRP.
3- Increased Utility(Speed and Efficiency in Transactions) : Given its high speed and low transaction fees, XRP is being considered a suitable option for international transfers.
4- Institutional Investment(Approval of Exchange-Traded Funds (ETFs)) : The approval of ETFs related to XRP could lead to increased demand and, consequently, a rise in its price.
5- Leadership Changes(Changes in SEC Leadership) : With Gary Gensler stepping down as SEC Chair and the potential appointment of more crypto-friendly leaders, regulatory pressures on XRP are expected to decrease, potentially aiding its growth.
-----------------------------------------------------------
Now, let's take a look at the Technical Analysis of XRP .
XRP is trying to break the Resistance zone($2.92-$2.68) . However, the $3.00 Resistance level(Round Number) is preventing XRP from continuing to rise.
Of course, with the large volume of the candle breaking the Resistance zone , we can hope for an increase in XRP .
Regarding Classic technical analysis , the Rising Wedge Pattern has failed and will act as a continuation Pattern when a reversal pattern fails. ==>> Educational Tip
According to the theory of Elliot waves , it seems that XRP has succeeded in completing the main wave 3 and we should wait for the main wave 4 . It looks like the main wave 4 can end around $2.85 or $2.74 ( near the upper line of the failed wedge pattern ).
Looking at the chart of XRPBTC ( BINANCE:XRPBTC ) in the weekly time frame , we can see that it seems that XRPBTC has succeeded in breaking the Resistance lines and is currently trying to break the Resistance zone , and if this zone breaks , we can see a further increase in XRP compared to Bitcoin(if the crypto market is bullish ) and vice versa if the crypto market is bearish , we can hope that XRP will experience a smaller decline than Bitcoin.
Based on the explanation above, I expect XRP to rise to at least a Potential Reversal Zone(PRZ) after the pullback is completed .
Note: If XRP returns below the Resistance zone($2.92-$2.68) again, we can expect a further decline of XRP.
XRP Analyze (XRPUSDT), 4-hour time frame⏰.
🔔Be sure to follow the updated ideas.🔔
Do not forget to put Stop loss for your positions (For every position you want to open).
Please follow your strategy and updates; this is just my Idea, and I will gladly see your ideas in this post.
Please do not forget the ✅' like '✅ button 🙏😊 & Share it with your friends; thanks, and Trade safe.

Ripple Faces New Legal Hurdles Amid XRP’s PerformanceRipple Labs finds itself under renewed legal scrutiny as plaintiffs in the class action lawsuit, In re Ripple Labs Inc. Litigation, filed appeals with the Ninth Circuit Court. The ongoing legal battles surrounding Ripple and its native token, XRP, continue to cast a shadow over the cryptocurrency’s prospects despite its significant market performance in recent months.
The Legal Landscape
Proposed Order to Deny Ripple’s Bill of Costs
Plaintiff Bradley Sostack has filed an objection to Ripple’s bill of costs in a California district court, proposing an order to deny the company’s request to cover litigation expenses. This move underscores the persistent contention in the lawsuit, with plaintiffs challenging Ripple’s earlier favorable judgments, including those regarding summary judgment and claims under California law.
Upcoming Deadlines
Adding to the complexity, the principal brief in the high-profile Ripple vs. SEC case is due on January 15. This timeline aligns closely with speculation about SEC Chair Gary Gensler’s potential last-ditch efforts to impose additional regulatory challenges on Ripple before his anticipated departure on January 20.
Ripple’s Strategic Developments
While legal battles rage on, Ripple has continued to innovate. Recent developments include the launch of the RLUSD stablecoin, further cementing its ambition to dominate blockchain-based financial solutions. However, this progress has been somewhat overshadowed by the ongoing litigation.
Technical Analysis
From a technical standpoint, XRP’s price dynamics reflect the broader market sentiment influenced by the lawsuit:
- Current Performance: At the time of writing, XRP is trading at $2.40, experiencing a 1.37% decline within the past 24 hours.
- RSI Weakness: The Relative Strength Index (RSI) is hovering around 50, signaling a lack of clear momentum. This aligns with the market’s cautious approach amid uncertainty surrounding the legal outcomes.
- Bearish Reversal Pattern: XRP appears to be forming a bearish reversal pattern, suggesting a potential decline if market sentiment doesn’t improve.
Fundamental Perspective
XRP has been a standout performer, with a 400% rally in recent months attributed to Ripple’s victories against the SEC and its strategic moves in the financial ecosystem. Despite this, the token remains vulnerable to the ongoing legal challenges and regulatory scrutiny.
Key Considerations:
- The outcome of the appeals and the SEC’s principal brief could significantly impact XRP’s market trajectory.
- Ripple’s ability to continue its technological advancements, such as expanding its stablecoin ecosystem, will be crucial in maintaining investor confidence.
Conclusion
Ripple’s legal battles represent a pivotal moment for XRP and the broader cryptocurrency market. While the token has shown resilience with impressive gains and innovations like the RLUSD stablecoin, the uncertainty surrounding its legal status continues to weigh heavily. Investors should keep a close watch on the January 15 deadline and the broader implications of regulatory actions under the SEC’s leadership transition.

XRP Update 2024-11-12XRP Most Probable Targets are mentioned.
Note : This is a personal Idea and Not enough for trading

Ripple could hit its highest price in 6 years XRP's RSI currently sits at 72. This indicates a renewal of bullish momentum.
Ripple CMF is currently at 0.05, down from 0.10 when its price peaked at $1.63 a week ago, reflecting reduced capital inflows.
At 0.05, XRP’s CMF indicates slight bullish sentiment.
EMA lines remain bullish, with short-term lines positioned above long-term ones, signaling an ongoing uptrend. However, the narrowing gap between the lines suggests weakening bullish momentum, indicating a possible trend reversal.
If buying pressure strengthens and a new uptrend forms, XRP price could retest its recent high of $1.63. Breaking this level could push the price to $1.70, marking its highest value since 2018.

XRP down as traders cash out. Brief analysisXRP has witnessed a surge in selling activity since it climbed to a three-year high of $1.63 on November 23. Currently trading at $1.41, the altcoin has since noted a 13% price dip.
According to Santiment’s data, over the past seven days, XRP’s realized profits have totaled $1.84 billion, the highest since April 2021.
XRP currently trades at $1.41, above support formed at $1.33. Sustained profit-taking activity by token holders will pull XRP’s price to test this support level. If it fails to hold, the downward trend strengthens, and the XRP price dip may extend to $1.28.
On the other hand, this bearish projection will be invalidated if buying activity resumes. This may push XRP’s price toward revisiting its three-year high of $1.63.

XRP: bulls vs bearsCertainly, after three years of a steady downtrend, XRP’s resurgence sparked renewed FOMO in the market. On the day XRP hit $1, active accounts on the XRP ledger surged to a yearly high of around 48K. However, within just a week, that number has dropped to 30K, reflecting a 37.5% decline.
These abrupt exits have disrupted the momentum needed to break the $2 barrier, leading to a more than 2% decline after it crossed the halfway point two days ago, with XRP currently priced at $1.46 (at the time of writing).
However, if the bulls lose confidence in XRP’s long-term potential, a pullback to around $1 could form a local bottom, offering an attractive entry point for new traders looking to capitalize on a rebound.
This places Ripple at a crossroads, where the next move will define whether the momentum will build toward $2 or retrace to new entry points around $1.
The coming days will likely show which side takes control in this tug-of-war. However, the bulls’ drive to keep XRP from falling after so many challenges gives them a strong psychological edge.
With continued confidence, the likelihood of breaking $2 grows, as bulls work to reignite FOMO in the market.

XRP ideaThis idea is my long term xrp/usdt observation. It's not investment advice, but I've been following it here for about 3 years. When I see that it works well, I share it. It is my own opinion.

XRP (Ripple): Resistance BreakoutTrade setup : Price is in an uptrend as price has broken back above 200-day moving average. Price also made a Higher Low (above the low from early July of $0.38), which is positive. Now we look for the right entry opportunity in Uptrend. We wait for price to either 1) break above $0.67 resistance to signal continuation of uptrend, with +15% upside potential to $0.75 next, or 2) pull back near $0.50 support for another swing trade entry in Uptrend with upside potential back to $0.67. Learn risk management in Lesson 9.
Pattern : Resistance Breakout . Once a price breaks above a resistance zone, it signals that buyers have absorbed all the supply from sellers at this level and price can resume it's advance. Following a resistance breakout, the next closest resistance zone becomes a price target. Learn to trade key level breakouts in Lesson 7.
Trend : Short-term trend is Up, Medium-term trend is Strong Up and Long-term trend is Up.
Momentum is Bearish but inflecting. MACD Line is still below MACD Signal Line but momentum may have bottomed since MACD Histogram bars are rising, which suggests that momentum could be nearing an upswing. Price is neither overbought nor oversold currently, based on RSI-14 levels (RSI > 30 and RSI < 70).
Support and Resistance : Nearest Support Zone is $0.50, then $0.42. Nearest Resistance Zone is $0.67, then $0.75.

XRP (Ripple): Pullback in UptrendTrade setup : Price is in an uptrend. Following a a bullish breakout from Falling Wedge pattern, price broke above $0.57 key level. However, it got overbought (RSI > 70), which was followed by a pullback on some profit taking. We would be buyers on pullbacks to $0.50-$0.55 support zone, with +30% upside potential back to $0.67 resistance.
Pattern : Pullback in Uptrend . Price remains in an Uptrend but has pulled back, which could present a 'buying dip' opportunity. Traders should look for the nearest support level where price could stabilize and resume its Uptrend. This support level could be a level where price bounced off of in the past, or a level that was previously resistance. (concept known as polarity).Learn to trade key levels in Lesson 3.
Trend : Short-term trend is Strong Up, Medium-term trend is Up and Long-term trend is Strong Down.
Momentum is Bullish but inflecting. MACD Line is still above MACD Signal Line but momentum may have peaked since MACD Histogram bars are declining, which suggests that momentum could be nearing a downswing. Price is neither overbought nor oversold currently, based on RSI-14 levels (RSI > 30 and RSI < 70).
Support and Resistance : Nearest Support Zone is $0.50, then $0.42. Nearest Resistance Zone is $0.67.

XRPUSD BULLISH MONEY HEIST PLANMy Dear Robbers / Traders,
This is our master plan to Heist XRPUSD Market based on Thief Trading style Technical Analysis.. kindly please follow the plan I have mentioned in the chart focus on Long entry. Our target is Red Zone that is High risk Dangerous level, market is overbought / Consolidation / Trend Reversal at the level Bearish Robbers / Traders gain the strength. Be safe and be careful and Be rich.
Note: If you've got a lot of money you can get out right away otherwise you can join with a swing trade robbers and continue the heist plan, Use Trailing SL to protect our money.
Stop Loss : Recent Swing Low using 4h timeframe
Warning : Fundamental Analysis comes against our robbery plan. our plan will be ruined smash the Stop Loss. Don't Enter the market at the news update.
Loot and escape on the target 🎯 Swing Traders Plz Book the partial sum of money and wait for next breakout of dynamic level / Order block, Once it is cleared we can continue our heist plan to next new target.
support our robbery plan we can easily make money & take money 💰💵 Join your hands with US. Loot Everything in this market everyday make money easily with Thief Trading Style.

XRPUSD Ripple/US Dollar Bearish Side Money Heist PlanMy Dear Robbers / Traders,
This is our master plan to Heist XRPUSD Market based on Thief Trading style Technical Analysis.. kindly please follow the plan I have mentioned in the chart. Our target is Green Zone that is High risk Dangerous level MA act as a Dynamic Support & Order Block, So the Market is oversold / Consolidation / Trend Reversal at the level Bullish Robbers / Traders gain the strength. Be safe and be careful and Be rich.
Note: Day traders & Scalpers If you've got a lot of money you can get out right away otherwise you can join with a swing trade robbers and continue the heist plan,
Loot and escape on the target 🎯 Swing Traders Plz Book the partial sum of money Use Trailing Stop To Protect Looted Money and wait for next breakout of dynamic level / Order Block, Once it is cleared we can continue our heist plan to next new target it will update after the Breakouts.
support our robbery plan we can easily make money & take money 💰💵 Join your hands with US. Loot Everything in this market everyday.

XRP: Approaching ResistanceTrade setup : Price is in a downtrend. Price needs to break above stiff resistance area: horizontal $0.55 resistance and 200-day moving average (~$0.58) to resume an uptrend.
Pattern : Price is Approaching Resistance, which is a level where it could pause or reverse its recent advance, at least temporarily. Resistance is often a level where price got rejected in the past, or potentially prior Support level that was broken. (concept known as polarity). Once price breaks above resistance, it can advance higher to the next resistance level. Learn to trade key levels in Lesson 7.
Trend : Short-term trend is Up, Medium-term trend is Down and Long-term trend is Strong Down.
Momentum is Bullish (MACD Line crossed above MACD Signal Line) ABOVE days ago. Price is neither overbought nor oversold currently, based on RSI-14 levels (RSI > 30 and RSI < 70).
Support and Resistance : Nearest Support Zone is $0.50, then $0.42. Nearest Resistance Zone is $0.55, then $0.65.

XRP: buy in low renge📊Analysis by AhmadArz:
🔍Entry: 0.5878
🛑Stop Loss: 0.5668
🎯Take Profit: 0.6025-0.6247
🔗"Uncover new opportunities in the world of cryptocurrencies with AhmadArz.
💡Join us on TradingView and expand your investment knowledge with our five years of experience in financial markets."
🚀Please boost and💬 comment to share your thoughts with us!
