RIPPLE will give us great Profits, be Sure! Hello, Traders!
Monfex is at your service and today we overview XRP/USD.
What do you expect from Ripple?
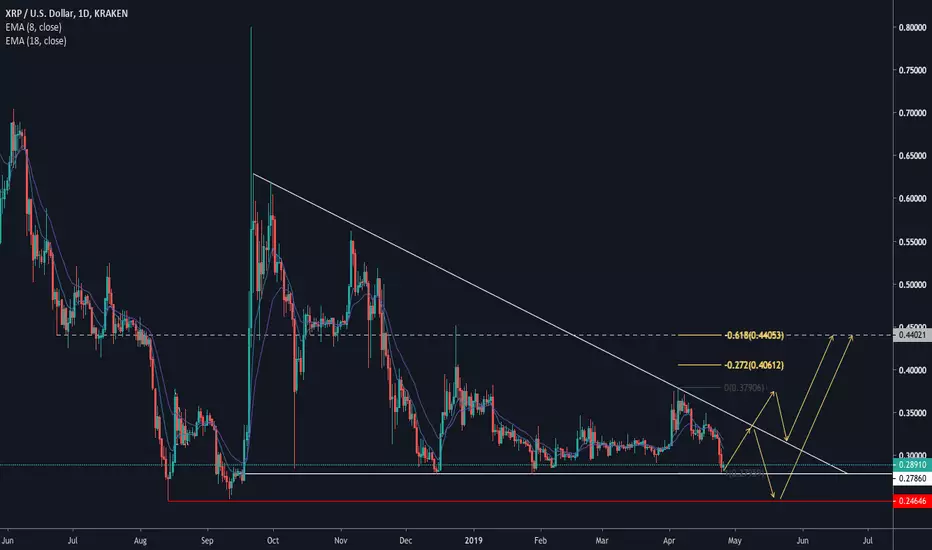
Curent price ~$0.257
It is moving in the falling wedge and now near support - buy - accumulation zone. Also XRP has by Stoch RSI two bullish div and going to leave the oversold zone. So we have asume that soon will be good positive movement on this chart!
We have key resistance price level ~ $0.266 , there is resistance volume with MA20 by the breakdown of which we also can assume buy position.
Active Trade Signal by XRP/USD
- Buy below $0.248
- Take profit ~ $0.322
- Stop at $0.218
Share your thoughts, ideas about the market under the chart.
Disclaimer
This report is for information purposes only and should not be considered a solicitation to buy or sell any trading assets. Monfex accepts no responsibility for any consequences resulting from the use of this material. Any person acting on this trade idea does so entirely at their own risk.
Rippleusdt

XRP/USD Price Action Analysis | A Weak ConsolidationRipple is trying to get back in the Trading Range. Even if it manages to do so, this weak structure indicates that it will continue its downtrend after taking a visit to the previous swing high and hunting the stops above it. That visit, is our initiation.
Entry: 0.267
SL: 0.288
TP-1: 0.214
TP-2: 0.169
R/R: 4.67
Please let me know if you have any suggestions or any ideas to add. I can also give you more detailed explanation for this specific trade setup.
The ideas published here are not financial advices.

XRPUSD forming a bullish BAT | A good long opportunityOn short term 1 hr chart after forming a bullish Shark pattern priceline of XRP / US Dollar is forming bullish BAT, sofar all legs are driven as required for BAT therefore I am expecting the last leg will be retraced from 0.786 to 0.886 fibonacci and soon it will be entered in potential reversal zone.
This PRZ area should be used as stop loss point in case of complete candle stick closes below this zone.
I have used Fibonacci sequence to set the targets:
Buy between: 0.23583 to 0.23098
Sell between: 0.23710 to 0.24357
Regards,
Atif Akbar (moon333)

XRPUSD price action extended the leg and formed a bullish CrabIn my previous chart:
the priceline of XRP / US Dollar cryptocurrency formed the bullish BAT but neither the MACD turned weak bearish nor stochastic gave any bull cross to give us any buying signal and eventually price action broke down the PRZ area and now the price action has retraced between 1.27 to 1.618 and formed a bullish Crab and it is entered in potential reversal zone to hit the sell targets soon insha Allah.
This PRZ area should be used as stop loss point in case of complete candle stick closes below this zone.
Volume profile is still showing less interest of traders here and stochastic is oversold and also gave bull cross on current candle stick but MACD is still strong bearish so for secure trade we can wait for MACD to turn weak bearish.
I have used Fibonacci sequence to set the targets:
Buy between: 0.22595 to 0.19817
Sell between: 0.24751 to 0.29968
Regards,
Atif Akbar (moon333)

XRPUSD formed a bullihs BAT | A very good long opportunityPriceline of XRP / US Dollar cryptocurrency has formed a bullish BAT and it is entered in potential reversal zone to hit the sell targets soon insha Allah.
This PRZ area should be used as stop loss point in case of complete candle stick closes below this zone.
Volume profile is showing less interest of traders here, but Stochastic is oversold and did not give bull cross and MACD is strong bearish so for secure trade we can wait for MACD to turn weak bearish or for stochastic to give bull cross then buy.
I have used Fibonacci sequence to set the targets, and this time I have defined buying zone from 0.618 to 0.886 of X to A Fibonacci projection:
Buy between: 0.27799 to 0.25664
Sell between: 0.28389 to 0.31227
Enjoy your profits and Regards,
Atif Akbar (moon333)


XRPUSD formed a bearish gartley | A good short opportunityWith the formation of bullish gartley pattern which I have published in my previous below idea:
The price action was also forming another bearish harmonic gartley pattern and now it is entered in potential reversal zone to hit the targets soon insha Allah.
But MACD is strong bullish and Stochastic is also bullish and did not give bear cross sofar moreover the Volume profile of complete pattern is showing that the traders are still interested to trade above the potential reversal zone but not above the resistance line.
So for secure trade we can wait for MACD to turn weak bullish from strong bullish or for Stochastic to give bear cross then by and the PRZ area or the resistance line can be used as stop loss in case of complete candle stick closes above the PRZ or resistance, coz if the resistance or PRZ will be broken then D leg can be extended from 1.27 to 1.618 fibonacci to form a bearish butterfly pattern and this gartely can be invalidated.
I have used Fibonacci sequence to set the targets:
Sell between: 0.25975 to 0.26308
Re-Buy can be between: 0.25713 to 0.25083
Enjoy your profits and regards,
Atif Akbar (moon333)

Ripple formed a bullish BAT | A good long opportunityAfter successful completion of a bullish gartley pattern priceline of XRP / US Dollar cryptocurrency has formed a bullish BAT pattern and entered in potential reversal zone to hit the sell targets soon insha Allah.
Volume profile of complete pattern is showing less interest of traders at this area.
But stochastic is strong bearish and has given bear cross moreover MACD is turned weak bullish from strong bullish, so here I would suggest to wait for MACD to turn back strong bullish or if the MACD will be turned strong bearish then wait for to turn it back to weak bearish or wait for bull cross from stochastic then take the long position.
The PRZ area should be used a stop loss zone if a complete candle stick will be closed below this area.
I have used Fibonacci sequence to set the targets.
Buy between: 0.25350 to 0.24754
Sell between: 0.25510 to 0.26309
Enjoy your profits and regards,
Atif Akbar (moon333)

Ripple/Tether (Aug 14) #XRP $XRP #USDT $USDTCurrent price of XRP is quite good to hold in long-term. But there is a super strong support at 0.28$, if this level can't hold XRP, XRP will die
Buy : Close to 0.28-0.29$ as possible
Sell : 0.31-0.345-0.37-0.42$
Mid-Hold : 0.5$
Stop : Under 0.28$

XRPUSD formed bullish shark | Upto 77% profit potential tradeThe priceline of XRP /U.S DOLLAR has formed a bullish shark pattern and entered in potential reversal zone.
From here it can hit the sell targets soon insha Allah.
The MACD is also turned bullish.
I have defined the targets using Fibonacci sequence as below:
Buy between: 0.30493 to 0.25690
Sell between: 0.35358 to 0.45584
Regards,
Atif Akbar(moon333)

ripple forecasthere is our ripple bank level i will put my buy limit orders in the blue zone and wait to our targets hit

RIPPLE / USDT Setting Up For ABC CorrectionRIPPLE dropped nicely and looks to be entering an ABC corrective pattern. We just saw Wave A at $1.64 - matching the 4 Wave range. Our next target is Wave B at about $2.25 - matching the 3 Wave range. After that, Wave C should return to at or under $1.64. It could continue a downtrend after this point or bounce off the $1.60 support and continue a new impulse wave up.
Things to watch:
BTC movements could break the pattern. RIPPLE has been pretty reactive to BTC recently. A BTC movement could cause anomalies or break out of the standard ABC trend.
TARGETS:
Wave A at $1.64.
Wave B at about $2.25.
Wave C at or under $1.64.
Note:
This is an idea of a future market movement. The current markets are highly volatile and can change at any moment. It is not a suggestion to trade, and I am not a financial advisor.

Ripple has completed shark | Upto 77% profit possibilityThe priceline has completed the shark pattern and entered in potential reversal zone.
We already have a 2nd pivot support within PRZ area from here the price action will take bullish divergence insha Allah.
The stochastic is in oversold zone 1st time after feb 2019.
The targets are:
Buy between: $0.3049 to $0.25697
Sell between: $0.35363 to $0.45585
Regards,
Atif Akbar (moon333)

XRPUSD - Mid-range consolidation areaXRPUSD seems to be in a mid-range consolidation area, I'm unsure of the short term sentiment, but remain bullish on the overall outcome.


Ripple/Tether (June 22) #XRP $XRP #USDT $USDT#WAIT
Current Price : 0.442$
Buyzone : Close to 0.38$ as possible
Sellzone : 0.45-0.535-0.6-0.625$
Stoploss : Under 0.37$
Buyback : 0.325-0.35$

XRP possible move back to channel topXRP looks poised to make a run to that channel top resistance
If it can find support after breaking above supply here, we could see a channel break and move higher


Bullish Gartley pattern. back to $0.36Bullish gartley pattern on 1h xrp chart ! back to the upside !

Ripple, XRP/USD. Buy entry with low risk.Open buy near $0.3180
Goals: $0.34 and $0.37
- Price bounced from Mirror level
- Potential profit in 3 times bigger than a risk

Monthly inverted hammerWe're seeing an inverted hammer on the monthly xrp chart. $0.38 is coming sooner than expected.