Rising WedgeLooking at $SPY - I've been trading this from the previous Double Top on 4HR. Here I see a reversal. $SPY Rising Wedge, Double Top
-not trading advice ;)
Rising Wedge

BTC Daily, A Quick RecapHere are the most important BTC levels for us to be watching IMO We are in a large area of resistance on the macro TF and I would really like to see BTC break up out of this rising wedge pattern and out of this large area of resistance.
If we decide to break to the upside my next targets would be 50k, 55k, and 59k, I will be watching closely because if for some reason BTC could break through all this resistance (good news, economical news etc) then we could see BTC have another strong rally higher.
But in saying all that we will prepare for both a bull market continuation and a bear market. I think it is very important we keep an open mind here and just be patient.


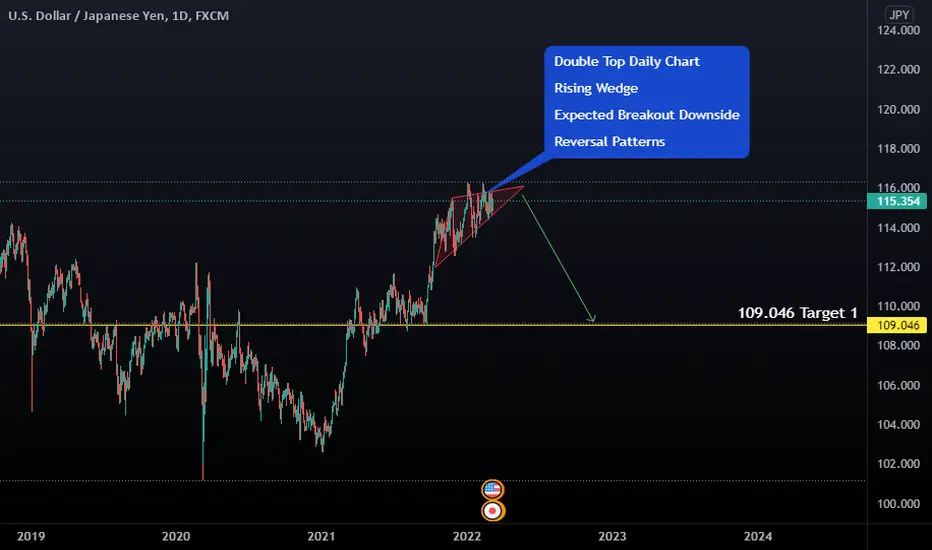
USD JPY Reversal PatternsRising Wedge forming in Apex.
Reversal Pattern back to Support Levels at 110/109
Scalping idea for "Short" LUNAUSDTIf rising wedge formation works, Luna price may fall down to $82 - 81 levels.

Terra Analyze (Short Term/Rising Wedge)!!!Tera was able to make a Rising Wedge Pattern from 43.2 until 60.5$ , also the price lost the lower line of its Rising Wedge 2 days ago.
Terra Analyze ( LUNAUSDT) Timeframe 1h ⏰
I have two scenarios for the next movement of Terra .
🔅 S cenario 1 : Terra was able to pass pullback, and it will go down from 57$ .
🔅 Scenario 2 : Terra is on the pullback, and it will make Inverse Head and Shoulder Pattern .
🔴 Resistance Zones 🔴 & 🟢 Support Zones 🟢 that we have in front of Terra .
🔴 Resistance zones on Terra 's way:
🔴 Resistance zone : 58.2$ until 57.5$ (Resistance + Cluster of Fibs)
🔴 Heavy Resistance zone : 63.3$ until 60.6$ (Resistance + Cluster of Fibs +Yearly Pivot Point + Monthly Pivot Point )
🟢 Support zones on Terra 's way:
🟢 Support zone : 53.6$ until 53.1$ (Support + Cluster of Fibs)
🟢 Heavy Support zone : 48.4$ until 46.8$ (Support + Cluster of Fibs + SMA 200(TF Daily))
Do not forget to put Stop loss for your positions (For every position that you want to open).
Please follow your strategy , this is just my idea, and I will be glad to see your ideas in this post.
Please do not forget the ✅' like '✅ button 🙏😊 & Share it with your friends, Thanks, and Trade safe

$WAVESUSDT 1HR Potential Rising Wedge $WAVESUSDT 1HR Potential Rising Wedge
Please note with a rising wedge if it goes up, it will come down!
The Rising Wedge is a bearish pattern.
What do you think? :)
Thanks,
Kelly

BTCUSDT is creating a rising wedge?Bitcoin had a bounce from our weekly support after a dump due to war, the price created a V shape.
On the 4h Timeframe, the price is testing a key level on 39600 on the daily resistance on 0.5 Fibonacci level. If you look on the left you can see an accumulation before the previous bearish impulse, it means that this area is so strong to break.
the previous candle created a false breakout, no bullish momentum followed the candle, and the Volume is decreasing. If we exclude the nervous candles about the war, we can identify a rising wedge. A rising wedge with two up-sloping trend lines. The volume trend usually slopes downward.
How to approach?
We are monitoring the price, a clear breakout of 38300 with retest should be a clear sign for a new bearish impulse, 37k is the first 4h support.
The setup is invalidated if the price is going to have a breakout and retest of 42k
––––
Keep in mind.
🟣 Purple structure -> Monthly structure.
🔴 Red structure -> Weekly structure.
🔵 Blue structure -> Daily structure.
🟡 Yellow structure -> 4h structure.

nzdchf rising wedgerising wedge NZDCHF are forming shape similar to Rising Wedge pattern. This kind of pattern has bearish meaning, so downward breakout is .

AUDJPY H2 A good opportunity for sell !Hello traders this is my idea about audjpy H2 with price action and harmonic pattern method as you see we have a rising wedge at the end of the downtrend and the price came back from resistance line and resistance area also I think we have a harmonic pattern here that name is deep crab ( although it's not a ideal deep crab but In my opinion I can consider it as a deep crab ) so I expect a downtrend for this chart and I determined possible targets . Good luck.

AUDJPY pattern formingAUDJPY forming a rising wedge on a previous down trend and has reached to the previous demand area. There is a possibilty to break the trend. Word of advise: wait for the trend to confirm as shown in the chart or don't get into the trade with no confirmation.
Happy Trading Guys

GBP / CAD 1073558 + 0.18 % LONG IDEA * PRICE ACTION & STRUCTUREHEY EVERYONE
HOPE EVERYONE IS DOING GOOD HAVING A GOOD ONE.
NEW WEEK, NEW OPPORTUNITIES.
LOOKING AT THE GBP / CAD
* The PAIR has been trading in a RISING WEDGE just broke above a resistance level, retested this level somewhat now signaling continuation.
- Short term the pair is currently rejecting at this structure possibly signaling continuation in momentum on the 4h chart this in a rising wedge..
- Looking for long entries on the THE POUND / CAD this week should all the rules of the formation be met.
lets see how it goes
IF THIS IDEA ASSISTS IN ANY OR IF YOU LIKE THIS ONE
SMASH THAT LIKE BUTTON & LEAVE A COMMENT.
ALWAYS APPRECIATED
____________________________________________________________________________________________________________________
* Kindly follow your entry rules on entries & stops. |* Some of The idea's may be predictive yet are not financial advice or signals. | *Trading plans can change at anytime reactive to the market. | * Many stars must align with the plan before executing the trade, kindly follow your rules & RISK MANAGEMENT.
_____________________________________________________________________________________________________________________
| * ENTRY & SL -KINDLY FOLLOW YOUR RULES | * RISK-MANAGEMENT | *PERIOD - SWING TRADE

Can we get a retest of this Rising Wadge on BTC?As i told you at 44k we had hidden bearish divergence on the weekly and bearish divergence on the daily, point of control, daily resistance level and golden pocket. On the top of that we had this bearish pattern called rising wadge that we broke to the downside so it was clear to me that we are going down.
At the moment we are at the support levels where i am taking advantage of the ranging market because of the low volume on the weekends.
However i am expecting a bounce from this point at beginning of the week and retest of the breakout point betwen 42 and 42.8k where we can get our short position filled.
On the weekly i am still bullish and i am expecting a bounce from the ascending channel on the weekly and continuation of the bullrun 2.0.
If we break the channel and close weekly below it we can expect bear market and lower twenties.
What do you think about this rising wadge retest and can we reach the target?
If you like my ideas please follow me and like the post because i am posting every day and you can find always something interesting on my profile, i am new to Treadingview but i have 6 years expirience in trading.
BTC TO THE MOON!

Bearish Wedge ~ Short SetupAfter the Shooting Star we had on a weekly, and the continuation of this ending this week before a long weekend on the NYSE, I believe the short-position could play out well.
The bearish wedge formed has a measured move to a 30K; which is coincident with 2021 heavy support. If we can see a test of 28K to freak people out and a close (weekly basis) above 30K. The momentum may shift back. For now, I am bearish.

FTM/BTC (Fantom Coin) Preparing for Another Epic Leg Up >2XBINANCE:FTMBTC is one of the most beautiful charts I've seen in a while. Fantom is a smart contracts network that has grown about 100x in the past year. In this video, we analyse the charts and give our future outlook.
You can view this chart here .
If you like this video, then please leave a like. If you would like to see more, then please follow me. Thank you.

GBPJPY Break Four Hourly Rising WedgeGBPJPY started it's downside movement, and successfully made a lower low structure show us that the trend is nearly change
Price already break the Rising Wedge pattern, and making a sideways movement, high probability for GBPJPY to go down and close the Gap
Target Price is on the External 1.618 and the Yellow Classic Support line after closing the gap, reach around 21st - 22nd February due to Sun Ingress
FX:GBPJPY
-Fibomic International-

Rising wedge pattern in HindalcoIn Hindalco seen rising wedge pattern on 1hr/15min Time frame, expecting good bearish move
Analysis on 18.02.2022 1Hr Time frame

Perfect Bitcoin descending channel on 4 hourly time frame.As i said in my previous posts we are in Ascending channel on the weekly, on the daily we broke out from our rising wadge to the downside (is going to be confirmed if close below 43.1k)
and descending channel on 4 hourly.
Yesterday i posted about the rising wadge on the daily and i was bearish, because on the weekly we have formed hidden bearish diverganece and on the daily berish devirgance.
Everybody was bullish because of the inverse Head and shoulders and that was a perfect counter trade.
Now is everybody going to be bearish because of the M pettarn breakout and call for 37k so we can counter trade them again around 40.5k or bottom of the channel and ride it to the upside till we retest rising wadge on the daily.
What do you think about this descending channel and can we get a bounce?
If you like my ideas please follow me and like the post because i am posting every day and you can find always something interesting on my profile, i am new to Treadingview but i have 6 years expirience in trading.
BTC TO THE MOON

We have rising wadge on the daily BTC chart!!!Everybody is talking about the inverse head and shoulders pattern but i think that is to good to be truth.
I just saw this rising wadge with multiple touch points on the upside and downside.
And i wish i could be more bullish but we have hidden bearish divergance on the weekly and small bearish devirgace on the daily if the candel closes in red.
Even if we we close above 45k i am still going to be bearish as long we do not close the daily above 46.2k.
Sometimes we make higher high just to liquidate shorts and trap long positions before we reverse.
However in strong bull markets rising wadges do break to the upside so i am not counting out the bulls but they need to show some more buying pressure.
As of my trades i am still holding 50% of my long position from 41.9k and if we break to the downside i am exiting at break even.
What do you think about this rising wadge and can the bulls push thru 46k?
If you like my ideas please follow me and like the post because i am posting every day and you can find always something interesting on my profile, i am new to Treadingview but i have 6 years expirience in trading.
BTC TO THE MOON

GBPAUD >>> Break Rising WedgeGBPAUD breaks the Daily Rising Wedge Pattern, price is going to finish retesting the trend line now
Target Price is on the Fibonacci Cluster 1.618 and 2.24
FX:GBPAUD
-Fibomic International-

MANA RetestCurrently experiencing a retest of the rising wedge, hopefully we will break back into the wedge making a bullish case scenario opening an opportunity to open a long position to the top of the wedge. However we could get rejected and retest the previous support. All depends on which direction Bitcoin is going to choose.

Analyze a Rising Wedge pattern In BTCUSDT chart Hello , this is my first educational post in trading view I hope it will help you and give you a better knowledge to understand the Rising wedge pattern
Please tell me your feedback and suggestions

BTC ON THE WEEKLY RISING WADGE VS RISING CHANNELBack in october i drew this rising wadge and i completely forgot about it.Since than we got our third touch point and big bounce from it on the fourth of december.This rising wadge goes back from 2017 Bull-run and has multiple touch points on the upside and 3 touch points on the downside.
But we also have this rising channel and 3 perfect touch points on the downside and 2 on the upside becouse of that i got in long position at 33k.
What to do if we get rejected from the rising wadge? The answer is simple,i am going out from my long position and wait for rsi on the weekly to go slightly below 30 whith has idicated bear market low back in 2015 and 2018.However if we break back in i think flying to the moon is very likely to happen.
What do you think about my opinion?
If you like my ideas please follow me and like the post, i am new to Treadingview but i have 6 years expirience in trading.
BTC TO THE MOON!
