Protect Capital First, Trade SecondIn the world of trading, mastering technical analysis or finding winning strategies is only part of the equation. One of the most overlooked but essential skills is money management. Even the best trading strategy can fail without a solid risk management plan.
Here’s a simple but powerful money management framework that helps you stay disciplined, protect your capital, and survive long enough to grow.
✅1. Risk Only 2% Per Trade
The 2% rule means you risk no more than 2% of your total capital on a single trade.
-Example: If your trading account has $10,000, your maximum loss per trade should not exceed $200.
-This protects you from large losses and gives you enough room to survive a losing streak without major damage.
A disciplined approach to risk keeps your emotions under control and prevents you from blowing your account.
✅2. Limit to 5 Trades at a Time
Keeping your number of open trades under control is essential to avoid overexposure and panic management.
-A maximum of 5 open trades allows you to monitor each position carefully.
-It also keeps your total account risk within acceptable limits (2% × 5 trades = 10% total exposure).
-This rule encourages you to be selective, focusing only on the highest quality setups.
Less is more. Focus on better trades, not more trades.
✅3. Use Minimum 1:2 or 1:3 Risk-Reward Ratio
Every trade must be worth the risk. The Risk-Reward Ratio (RRR) defines how much you stand to gain compared to how much you’re willing to lose.
-Minimum RRR: 1:2 or 1:3
Risk $100 to make $200 or $300
-This allows you to be profitable even with a win rate below 50%.
Example:
If you take 10 trades risking $100 per trade:
4 wins at $300 = $1,200
6 losses at $100 = $600
→ Net profit = $600, even with only 40% accuracy.
A poor RRR forces you to win frequently just to break even. A strong RRR gives you room for error and long-term consistency.
✅4. Stop and Review After 30% Drawdown
Drawdowns are a part of trading, but a 30% drawdown from your account's peak is a red alert.
When you hit this level:
-Stop trading immediately.
-Conduct a full review of your past trades:
-Were your losses due to poor strategy or poor execution?
-Did you follow your stop-loss and risk rules?
-Were there changes in the market that invalidated your setups?
You must identify the problem before you continue trading. Without review, you risk repeating the same mistakes and losing more.
This is not failure; it’s a checkpoint to reset and rebuild your edge.
Final Thoughts: Survive First, Thrive Later
In trading, capital protection is the first priority. Profits come after you've mastered control over risk. No trader wins all the time, but the ones who respect risk management survive the longest.
Here’s your survival framework:
📉 Risk max 2% per trade
🧠 Limit to 5 trades
⚖️ Maintain minimum 1:2 or 1:3 RRR
🛑 Pause and review after 30% drawdown
🧘 Avoid revenge trading and burnout
Follow these principles and you won't just trade, you'll trade with discipline, confidence, and longevity.
Cheers
Hexa
Riskmanagementstrategy
Mastering Risk Management: The Trader’s Real EdgeYou’ve all heard it,
“Cut your losses and let your winners run.”
Simple words — but living by them is what separates survivors from blown accounts.
Here’s some tips on how to approach risk management when trading:
☑️ Risk is always predefined: Before I click Buy or Sell, I know exactly how much I’m willing to lose. If you don’t define risk upfront, the market will do it for you.
☑️ Position sizing: Never risk more than 1–2% of your account per trade. Small losses mean you can keep taking high‑probability setups without fear.
☑️ Always use a stop‑loss: No stop? You’re not trading — you’re gambling.
☑️ Stop‑loss discipline: Place stops where the market proves you wrong — not where it “feels comfortable.” Then leave them alone.
☑️ Focus on risk/reward, not win rate: A 40% win rate can still be profitable if your average reward outweighs your risk.
☑️ Risk/reward ratio: Only take trades with at least a 2:1 or 3:1 potential. You don’t need to win every trade — your winners should pay for your losers (and more).
Remember:
“It’s not about being right all the time. It’s about not losing big when you’re wrong.”
Risk management won’t make your trades perfect — but it will keep you trading tomorrow.
And in this game, staying in the game is everything.
💭 How do you handle risk in your trading? Drop your strategy or tip in the comments — let’s share and learn together! 👇
Thanks again for all the likes/boosts, we appreciate the support!
All the best for a good week ahead. Trade safe.
BluetonaFX

AUD/USD: The Clearest Short Opportunity This WeekThis week, the macro and market landscape provides a rare alignment across all major models—making AUD/USD the standout short opportunity among G10 FX pairs.
Key Reasons for the Bearish AUD/USD Bias:
1. Commitment of Traders (COT):
Institutional positioning has turned decisively bearish on the Australian dollar, with net shorts increasing and sentiment remaining negative.
2. Z-Score & Positioning Extremes:
Z-Score indicators confirm a below-average long bias for AUD, highlighting that recent speculative flows are heavily skewed to the short side.
3. EXO/Score Model:
Our EXO (macro scoring) model gives AUD/USD a clear SHORT rating, with no offsetting bullish factors in the “core” or “risk/reward” signals.
4. Commodity Edge – Iron Ore:
Iron ore prices, a crucial driver for AUD, have sharply declined in recent weeks. This is a classic “canary in the coal mine” for AUD weakness historically, persistent iron ore declines precede broader AUD selloffs.
5. Sentiment & Risk Environment:
Despite global “risk-on” sentiment, AUD is unable to benefit, as both macro and market participants rotate away from commodity FX and into USD strength.
6. Endo (Fundamental) Model:
While Australia’s macro data still looks solid on a lagging basis, all faster models (positioning, flows, sentiment, commodities) point to an imminent shift typically, ENDO lags in catching turning points.
Conclusion & Tactical View:
SHORT AUD/USD is the highest conviction trade for this week, backed by full alignment of macro, positioning, sentiment, and real-economy factors.
Expect continued downside pressure while commodity markets and COT data remain bearish.
For active traders, the first 3–7 days following this setup historically provide the highest reward-to-risk moves.

Target hit Last post I talked about the bearish momentum which gbpusd had and how it will follow up the chart. I'm now done for the day, anticipate more sell till it reaches my buy zone
BTCUSDT: Pro Analysis, Major Swing Supports, Risk Focus__________________________________________________________________________________
Technical Overview – Summary Points
__________________________________________________________________________________
Momentum & Trends : Short-term consolidation (<1H frames), dominant uptrend 2H–1W. BTC market structure is “Up” across all higher timeframes.
Supports/Resistances :
Major supports: 100,300 – 101,600 USDT (1D/4H/2H pivots)
Resistances: 109,000 – 111,500 USDT (1D/W/12H pivots)
Volume : Recent bearish climax absorbed, back to normal volumes, no current excess.
Multi-TF Behavioral Read : Behavioral indicators (ISPD DIV) are neutral; no extreme sentiment. Risk On / Risk Off Indicator confirms structural buy-side.
__________________________________________________________________________________
Strategic Summary
__________________________________________________________________________________
Global Bias : Bullish trend on high TFs, technical consolidation short term.
Opportunities : Swing entries on return ≥101.6k, TP at 109k/111.5k. Manage position sizes actively before Fed.
Risk Zones : Invalidation <100.3k daily; key area to monitor. Short-term stop-loss below 99.9k.
Macro Catalysts : FOMC (June 17–18) = expected volatility, no major macro risk now. Watch Mideast tensions. Rising tensions in the Middle East (Israel/Iran): volatile climate, potential risk-off sentiment on certain assets, but no widespread panic; to be monitored in case of rapid escalation (possible increased BTC volatility).
Action Plan : Favor gradual entries on major supports, reduce leverage pre-macro events, active volatility and stops monitoring.
__________________________________________________________________________________
Multi-Timeframe Analysis
__________________________________________________________________________________
1D / 12H: Key support at 100.3k–101.6k, major resistance 109–111.5k. Repeated rejections at resistance, mature range. Normal volume, consolidating momentum.
6H / 4H: Strong lateral structure, ISPD/Volume neutral. Technical play around 101.6k, gradual profit-taking below 109k.
2H / 1H: Start of institutional reaction (moderate to high volumes). Bearish climax absorbed, possible short-term rebound at local support 99.9k–101.6k.
30min / 15min: Micro-range, short-term consolidation, some volume spikes on corrections. Downtrend confirmed on lower TFs, despite macro/swing bullish confluence.
ISPD & Risk On / Risk Off Indicator Summary:
ISPD DIV = Neutral across all timeframes.
Risk On / Risk Off Indicator = STRONG BUY on all horizons (US tech strong).
Cross-timeframe Synthesis : BTC market is accumulating on supports under favorable tech sector influence. Short-term consolidation seen as post-shakeout setup for potential resumed uptrend.
__________________________________________________________________________________
Final Synthesis & Operational Plan
__________________________________________________________________________________
BTC market remains in a dominant swing bullish bias, supported by tech sector momentum and on-chain inflows. Key support zones (100.3–101.6k) offer attractive technical swing entries, with targets at 109–111.5k. However, strict risk management is essential ahead of the upcoming FOMC, rising Middle East tensions (Israel/Iran), and the potential for sudden volatility spikes.
Strategy: Maintain bullish exposure with partial profit-taking and reduced leverage into macro/geopolitical events. Systematic stops remain below 99.9k.
__________________________________________________________________________________

Bitcoin Strong Momentum Below Key Resistance__________________________________________________________________________________
Technical Overview – Summary Points
__________________________________________________________________________________
Momentum: Strong bullish momentum across higher timeframes. Generalized “Up” alignment via MTFTI, strong leverage from the Risk On / Risk Off Indicator (Strong Buy on all timeframes except temporary 2H Down).
Supports / Resistances: Price evolving just below major resistances (107643.9, 109952.8, 111949) and holding above key defensive zones (104940/105287.8, then 100353/100335).
Volumes: Average on higher timeframes, very high/accelerating on 30min/15min (potential buying climax or local volatility spike).
Multi-TF/ISPD DIV Behaviour: ISPD mostly neutral, but “Sell” warning on 30min during volume peaks (risk of quick profit-taking or fake breakout).
__________________________________________________________________________________
Strategic Summary
__________________________________________________________________________________
Global Bias: Ultra-bullish. Momentum structure supported by technical/sectoral/on-chain convergence.
Opportunity: Buy on defended pullbacks (support 104940/105287.8) or daily confirmation > 107700. Extension toward 109950–111949 upon pivot breakouts.
Main Risk: Extreme volumes + ISPD Sell alerts (30min) = caution, speculative excess/whipsaw possible, quick profit-taking, lack of macro catalyst (weekend proximity).
Macro Catalysts: No urgent catalysts (macro stable, low exogenous risk).
Action Plan:
Tactical entry on defended pullbacks or validated daily signal > 107700.
Stop-loss below 104940 (pivot), swing validation below 100335/100353 (on-chain).
Active management of 107600–107700 zone (potential climax/local capitulation).
__________________________________________________________________________________
Multi-Timeframe Analysis
__________________________________________________________________________________
1D (Daily): Strong momentum, price just below pivots, no sell signal. Supports: 100300/93337.4.
12H: Similar structure, buyers in control, potential dip under 107600–109900.
6H/4H: Ongoing bullish impulse, test of the critical 107640–107644; no signs of weakness bar minor consolidation.
2H: Only TF Down, technical breakout underway, “Up” signal restoring (watch for fakeout below 107600).
1H: Strong Up momentum, breakout confirmed, next candle confirmation needed.
30min/15min: Record volumes, ISPD Sell at 30min: high “bull trap” risk. Microsctructure strongly bullish but high post-spike volatility risk.
Risk On / Risk Off Indicator: Strong Buy on all major timeframes.
Bullish Confluences:
Up alignment (all majors except 2H), breakouts, confirmed sectoral momentum.
Very high volumes = new trend or potential buying climax.
Short-term risks:
ISPD Sell + extreme volume 30min/15min = possible local exhaustion.
Critical zone: 107600–107700. Watch out for fake breakouts!
__________________________________________________________________________________
Strategic Bias – Pro Summary
__________________________________________________________________________________
Technical: Setups remain bullish. Pivot breaks “open” the target zone up to 109950–111949. Stops below 104940 (pivot), swing validation sub 100335/100353. Switch to active management on exhaustion signals (vol spike or ISPD Sell).
On-Chain: Mature distribution; upside limited without new catalyst, but 103700/104940 zone remains pivotal.
Macro: No bearish macro/news catalyst short-term, technical dominance prevails.
Operational Summary:
Tactical bullish stance.
Favor buying dips toward 104940–105287.8.
Partial profit-taking above 109950.
Switch defensive on daily break 104940/104000.
__________________________________________________________________________________

BTCUSDT Analysis – Pivot 103k/106k, strategy and key zones__________________________________________________________________________________
Technical Overview – Summary Points
__________________________________________________________________________________
Momentum : Bullish structure on 1D/12H (MTFTI “Up”), but short-term consolidation (1H-2H “Down”). Momentum exhaustion observed.
Key Supports/Resistances : Resistances: 105287.8 / 106743.9 / 109952.8 / 111949. Supports: 103033.3 / 100333.3 / 93337.4. Repeated rejections below 105-106k, active testing of 103-100k supports.
Volume : Normal or slightly elevated on all timeframes. No capitulation or euphoric extremes detected.
Multi-TF Behaviour : Strong sector leadership (Risk On / Risk Off Indicator = “Strong Buy” across all frames; growth stocks > market). No behavioural anomalies on ISPD DIV. High-cycle consolidation below resistance.
__________________________________________________________________________________
Strategic Summary
__________________________________________________________________________________
Overall Bias : Neutral/bullish as long as 103k/100k holds. Bullish momentum intact, but short-term caution warranted.
Opportunities : Defensive buys/technical pullbacks above 103k; scalp/range trading 103-106k.
Risk Zones : Confirmed breakdown below 100k or acceleration in LTH distribution.
Macro Catalysts : Next FOMC June 17-18; no major short-term events identified (recent neutral macro, FOMC is key for swings).
Action Plan : Prioritize strict stops (≥3%) near pivots, consistent monitoring of behaviour/volume. Avoid overexposure pre-FOMC.
__________________________________________________________________________________
Multi-Timeframe Analysis
__________________________________________________________________________________
1D : Structuring range below 109952.8-111949 resistances. Bullish HTF trend, but momentum pausing. Average volume. Risk On / Risk Off Indicator “Strong Buy”. No extreme ISPD signals (neutral).
12H – 6H : Consolidation; supports holding, no euphoric confirmation (normal volumes, ISPD DIV neutral). Sector leadership unchanged.
4H : Compression below 105287.8. Moderate volume. Defensive resumption on supports. MTFTI bullish. Dynamic risk: monitor for sell-side capitulation.
2H – 1H : Technical correction, active retest of 105k (range 103-105k). Absorption volume. MTFTI “Down”.
30min – 15min : Short-term positive bias above 103k. Risk of false break if volume remains low. Risk On / Risk Off Indicator “Buy”/“Strong Buy”.
Cross-Indicators : Market leadership confirmed: Risk On / Risk Off Indicator = Strong Buy on all frames >15min. No excess behaviour or significant divergences detected. Key ranges: 103k-105k. On-chain: heavy LTH profit-taking but no panic.
Summary : BTC market in post-cycle-high congestion phase, structurally robust, but momentum recalibrating with fewer “easy trades.”
__________________________________________________________________________________
Cross insights & on-chain summary
__________________________________________________________________________________
On-chain (Glassnode) : Top at $111.8k, correction to $103.2k by LTH profit-taking. Spot accumulation on $103.7k/$95.6k. Upside limited unless fresh buying flows return.
Macro events : Awaiting FOMC; no recent surprises. Price action and levels dominate short-term strategy.
Stops/invalidation : Swing long defended at 103k/100k (stop <100k H4). Partial short/sell below 106743.9/109952.8. Dynamic targets: 106-109.9k; extension: 111.8k if breakout on volume.
__________________________________________________________________________________
Conclusion & Actionable Plan
__________________________________________________________________________________
Market condition:
- High consolidation, ranging below major resistances.
- Long-term bullish, short-term momentum fading.
- Neutral/bullish if 100-103k holds.
- “No macro — only levels” until FOMC or volatility catalyst.
Tactical decision:
- Trade technically, stops ≥3% under supports.
- Defended buys at 103k (stop <100k), partial profit 106-109k.
- Continuous monitoring of volume/on-chain zone reaction.
- Aggressive exit/hedge below support, target 96k/83k.
__________________________________________________________________________________
100% analysis based on TradingView multi-TF, Glassnode on-chain, macro calendar and risk management.
__________________________________________________________________________________

BTC Tactical rebound or flush? Decision point at $103700 support__________________________________________________________________________________
Technical Overview – Summary Points
➤ Strong overall momentum across all swing/weekly timeframes, clear advantage to buyers.
➤ Key support at 103,700–104,000 USDT (chart/on-chain confluence, maximum visibility on all timeframes).
➤ Major technical resistance zone at 111,000–112,000 USDT (ATH + HTF pivots).
➤ Volumes normal to moderate, no directional climax or emotional excess in short and mid-term.
➤ Risk On / Risk Off Indicator remains strongly positive, indicating persistent sector outperformance.
➤ Only short-term weakness detected: temporary bearish trend on 2H/1H/30min/15min, typical of a short-term flush within a bullish structural context.
__________________________________________________________________________________
Strategic Summary
➤ Main bias: Bullish for swing approaches as long as $103,700 holds on closing.
➤ Opportunity: Buy on support on any retest 103,700–104,000 USDT with stop <102,000 USDT.
➤ Partial target: Take profits at 105–106k, then 111–112k.
➤ Risk zones: Confirmed break below 103,700 USDT with high volume = potential flush to 97–98k or even 95–96k.
➤ Catalysts: Quiet macro calendar until NFP (06/06) & FOMC (mid-June) — increased monitoring as these events approach.
➤ Action plan: Tactical intervention on support pullback, reduce exposure before major events.
__________________________________________________________________________________
Multi-Timeframe Analysis
1D/1W : Major structure fully bullish. No underlying reversal, stable volume, solid momentum. Risk On / Risk Off Indicator fully “On Risk”, no behavioral excess.
12H/6H: Sector momentum and volumes validate all swing-long entries on dips. Key supports 103,700–104,000 USDT consistently defended across timeframes.
4H/2H: Bullish bias maintained, healthy structure. Slight intraday weakness: 2H softens, moderately high volumes without extremes.
1H/30m/15m: Short-term bearish bias across all LTF — profit taking impact, typical technical flush on support. Bearish signals do NOT invalidate HTF bullish trend, but require tactical vigilance.
Risk Summary: A fast drop below 103,700 USDT with volume would validate a flash liquidation scenario to 97–98k. Pullback in mature bull phase, strongly defended at the key support: timing for “mean reversion” on volume reaction, else wait for lower setups.
Risk On / Risk Off Indicator: Still “On Risk”, strong tech/growth sector momentum on daily/swing.
ISPD: No behavioral excess, neutral/median histogram across timeframes.
Volumes: Normal/moderate, no exhaustion spike nor major selling.
On-chain: Mature distribution, LTH profit-taking; key supports at $103,700, $97,100, $95,600.
__________________________________________________________________________________
Strategic Synthesis & Bias
Market in mature bullish consolidation, HTF structure robust as long as 103,700 USDT holds.
Active opportunity window until NFP & FOMC: prioritize swing/mean-revert setups.
Required stop for any trade: strictly below $102,000.
Smart monitoring of volumes & sentiment: confirmed support break + volume = wait for lower rebound.
No excessive panic or exuberance signals: strong RR if re-entering the main range.
Actively manage exposure approaching macro events.
Operational summary:
• Buy at 103,700–104,000 USDT, stop <102,000.
• Partial profits at 105–106k, final offload at 111–112k.
• Reduce exposure ahead of NFP/FOMC.
• If break of 103,700 USDT: stop and wait for $97–98k or $95–96k.
__________________________________________________________________________________

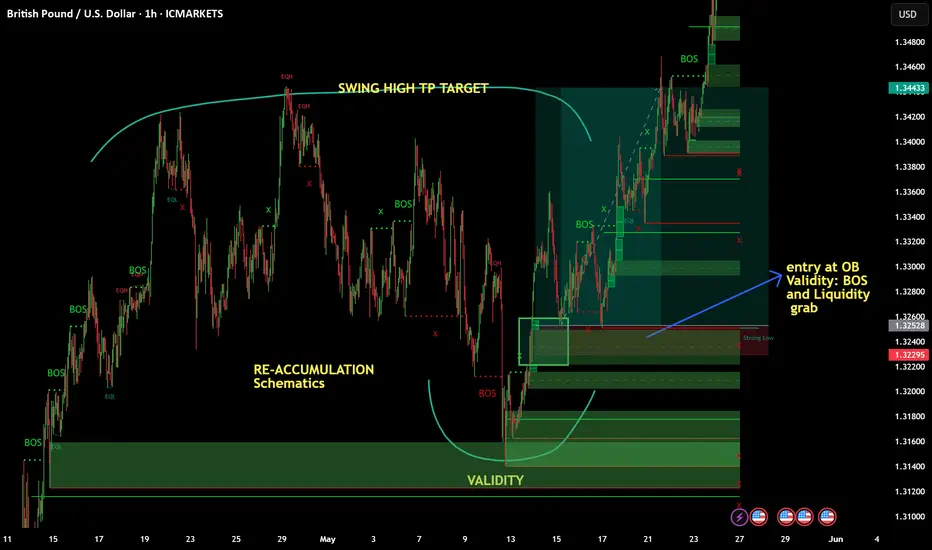
May 25 2025- BUY TRADE LIMIT order activated GBPUSDHi folks!
-Been busy lately so I dont consistently post. Attached here is the chart of GBPUSD, A classic re-accumulation in 1H timeframe. Before I got this trade It took me 1 week to monitor the schematics of this wyckoff re-accumulation. It came to fruition last Thursday so I monitor for buy Limit order entry within 1H to 15 min. charts. Validity here was the liquidity grab of re-accumulation ( check the image for clear caption).
TP: 8RR
Risk: 0.05% of Account
-Proprietary Trader
#wyckoff
#supplyanddemand
#refinement
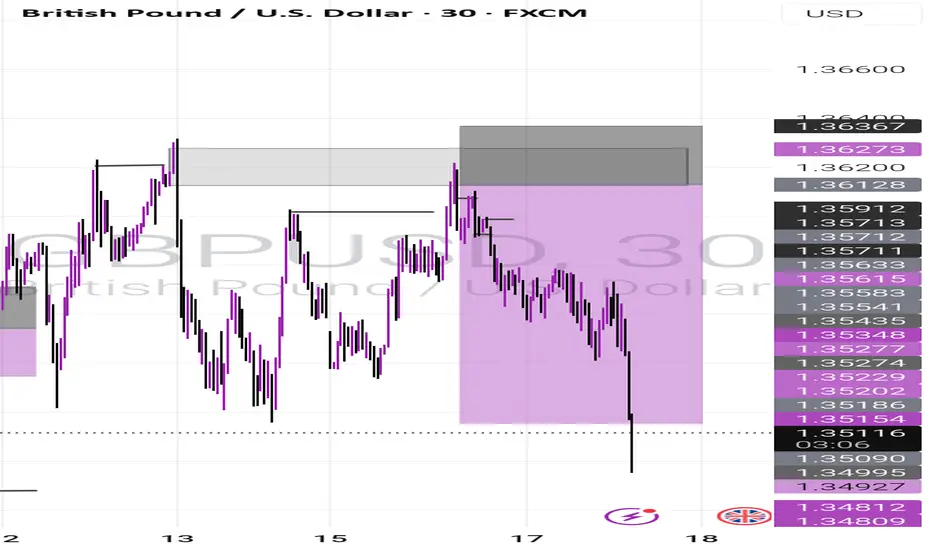
Supply Zone Rejection & BOS Confirm Downtrend ContinuationAfter a clean shift in structure marked by a CHoCH and subsequent BOS, price retraced into a clear supply zone—offering a high-probability short setup. Here's how the setup unfolded:
🧠 Trade Rationale
Break of Structure (BOS): Price broke below a key higher low, confirming a bearish structure.
Change of Character (CHoCH): Signaled the end of bullish momentum earlier in the sequence.
Supply Zone: Price retraced into a well-defined supply area (aligned with imbalance and prior support turned resistance).
Entry: Short taken as price tapped into the supply and failed to make a new high—further confirmed by a lower timeframe CHoCH.
Target: Aiming for the next BOS level below, aligning with clean equal lows/liquidity draw.
🔍 Key Concepts Highlighted
Structure-based trading with CHoCH and BOS labeling.
Supply zone entries based on price action confirmation.
Risk-to-reward driven decision-making (tight SL above supply, TP near next demand).
💬 What do you think? Do you wait for confirmation within supply, or enter at touch?
Let’s discuss—drop your thoughts and feedback!

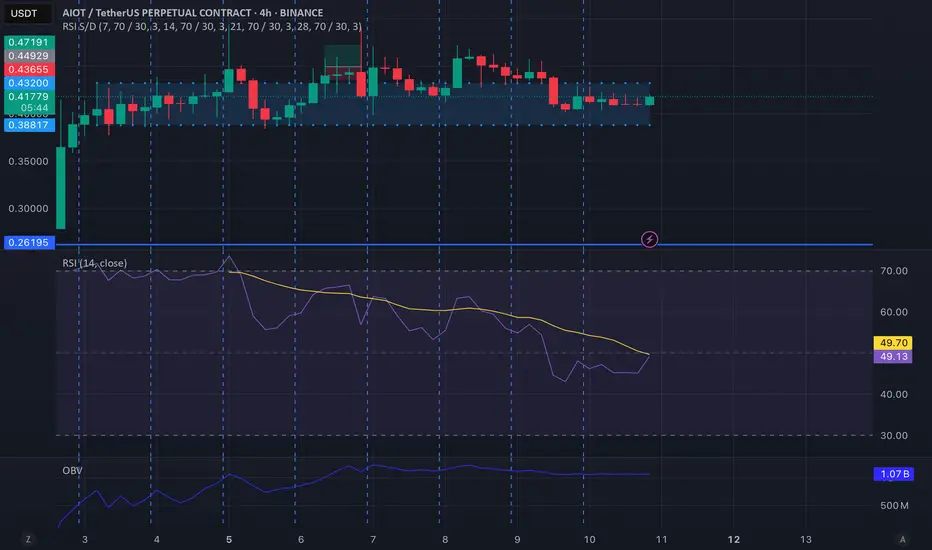
WHAT A GEM!!!AIOT/USDT is ready to take of !!
Sellers try to take over but all of them will be liquidated cause life is unfair...
We though ,we will place ourselves in the right direction and we will open long position..
In case it will drop 20% we will buy more as this coin is on uptrend..
Our price target will be 0.6 with 2X leverage..Hope you will follow as well as we are here to make a fortune for all of us!
We will keep you updated for more!
Mastering Volatile Markets: Liquidity Makes or Breaks Trades█ Mastering Volatile Markets Part 2: Why Liquidity Makes or Breaks Your Trades
If you've read the first part of this four-part series, you know that reducing position size is a key strategy for surviving volatile markets. The second crucial factor that determines success or failure in wild markets is understanding liquidity.
In volatile markets, liquidity is often the real reason behind those massive price spikes — whether 300-500 point moves in the NAS100, violent whipsaws in crypto or stop hunts in forex.
█ Liquidity: The Silent Killer in Wild Markets
In normal market conditions, liquidity is everywhere. You can enter and exit trades with minimal slippage, and everything feels smooth. But in volatile conditions, liquidity can disappear quickly.
Here's why it happens:
Market makers pull back to avoid getting caught in wild moves.
Spreads widen , making execution harder.
Order books thin out , meaning there aren't enough buy or sell orders to absorb aggressive price movements.
Even small orders can cause significant price changes when liquidity is low.
This is what causes those huge candles you often see in volatile markets. It's not just about more buyers or sellers; it's about less liquidity available to absorb those trades.
There’s also a common misunderstanding at play here: High Volume = High Liquidity
Many newer traders see a big volume candle and think, "Oh, high volume means it's safe to trade." But that’s an inaccurate conclusion.
⚪ Volume refers to the number of transactions happening.
⚪ Liquidity refers to how much depth the market has to handle those transactions without causing price instability.
In volatile markets, high volume doesn't mean there's enough liquidity.
And low liquidity causes wild wicks, huge spreads, higher slippage and unstable price action.
█ How to Navigate Low Liquidity in Volatile Markets
So, how can you trade effectively in these conditions?
1) Expect Crazy Moves — Levels Will Get Violated
In high-volatility, low-liquidity markets:
Support and resistance levels won't hold as they usually do.
Price will blow through key levels like they were nothing.
Fakeouts become extremely common.
2) Don't Rely Solely on Support & Resistance
As a newer trader, it's vital not to blindly rely on S/R levels in these markets. Here's why:
Don't expect clean bounces or perfect reactions.
Fakeouts, wicks, and stop hunts are normal.
Tight stops right behind these levels? You'll get stopped out a lot.
Experienced traders know this, which is why we adapt the strategies to handle the market's unpredictability.
3) Split Your Orders Into Smaller Chunks
One of the most effective techniques in volatile markets is order splitting.
Break it into smaller chunks instead of entering your full position at one price. This would help you survive fakeouts, scale in better across larger price moves and avoid becoming liquidity for bigger players.
Example: Let's say you want to go long at support (15,000 on the NAS100), instead of entering all at 15,000. Instead Enter:
25% at 15,000
25% at 14,950
25% at 14,900
25% at 14,850
This way, if the market fakes out below support due to low liquidity, you get filled at better prices without panic.
4) Control Your Emotions — Understand the Environment
This is HUGE in volatile markets.
Many retail traders panic when prices move against them quickly. But if you understand the nature of low liquidity , you can remain calm:
It's normal for the price to move wildly.
Levels will get swept.
Fake moves are common before the market plays out the right way.
█ Summary
Let’s take stock of what we learned today about liquidity in highly volatile markets:
High volatility often equals low liquidity.
High volume does not equal high liquidity.
Expect fakeouts , wild price behavior, and wide spreads.
Don't rely blindly on support/resistance levels.
Split your orders into smaller chunks to manage risk.
Trade smaller position sizes and stay calm.
Remember, you must adapt not only your size but also your execution . Understand liquidity, or it will punish you.
█ What We Covered Already:
Part 1: Reduce Position Size
Part 2: Liquidity Makes or Breaks Trades
█ What's Coming Next in the Series:
Part 3: Patience Over FOMO
Part 4: Trend Is Your Best Friend
-----------------
Disclaimer
The content provided in my scripts, indicators, ideas, algorithms, and systems is for educational and informational purposes only. It does not constitute financial advice, investment recommendations, or a solicitation to buy or sell any financial instruments. I will not accept liability for any loss or damage, including without limitation any loss of profit, which may arise directly or indirectly from the use of or reliance on such information.
All investments involve risk, and the past performance of a security, industry, sector, market, financial product, trading strategy, backtest, or individual's trading does not guarantee future results or returns. Investors are fully responsible for any investment decisions they make. Such decisions should be based solely on an evaluation of their financial circumstances, investment objectives, risk tolerance, and liquidity needs.

Are You Taking the Right Risks in Trading? RISK Per Trade Basics
What portion of your equity should you risk for your trading positions?
In the today's article, I will reveal the types of risks related to your position sizing.
Quick note: your risk per trade will be defined by the distance from your entry point to stop loss in pips and the lot size.
🟢Risking 1-2% of your trading account per trade will be considered a low risk.
With such a risk, one can expect low returns but a high level of safety of the total equity.
Such a risk is optimal for conservative and newbie traders.
With limited account drawdowns, one will remain psychologically stable during the negative trading periods.
🟡2-5% risk per trade is a medium risk. With such a risk, one can expect medium returns but a moderate level of safety of the total equity.
Such a risk is suitable for experienced traders who are able to take losses and psychologically resilient to big drawdowns and losing streaks.
🔴5%+ risk per trade is a high risk.
With such a risk, one can expect high returns but a low level of safety of the total equity.
Such a risk is appropriate for rare, "5-star" trading opportunities where all stars align and one is extremely confident in the positive outcome.
That winner alone can bring substantial profits, while just 2 losing trades in a row will burn 10% of the entire capital.
🛑15%+ risk per trade is considered to be a stupid risk.
With such a risk, one can blow the entire trading account with 4-5 trades losing streak.
Taking into consideration the fact that 100% trading setups does not exist, such a risk is too high to be taken.
The problem is that most of the traders does not measure the % risk per trade and use the fixed lot.
Never make such a mistake, and plan your risks according to the scale that I shared with you.
❤️Please, support my work with like, thank you!❤️
I am part of Trade Nation's Influencer program and receive a monthly fee for using their TradingView charts in my analysis.

CHFJPY POSSIBLE NEXT MOVE!CHFJPY currently break down of traingle and trade and down side of traingle now market will going to retest this traingle resistance and make any candle that show bearish momentum and break thier low so we will see downward market will going.
Remember! The result of your past trades, whether they were winning or losing ones, shouldn’t affect how you handle your next positions.

The Graph (GRT)🔷 Introduction:
What is GRT?
The Graph (GRT) is a decentralized protocol designed for indexing and querying blockchain data. It enables developers to access blockchain information quickly and efficiently without the need to run dedicated servers. GRT serves as the native token of this ecosystem, used for transaction fees and securing the network.
🔹 Technical Analysis of GRT/USDT – Weekly Timeframe
📌 Overall Market Condition
After an extended corrective phase, GRT remains within its weekly ascending channel. The price is currently hovering around a key support zone (0.1165 - 0.1334, marked in blue), which has historically triggered significant reactions.
🔍 Potential Scenarios
📈 Bullish Scenario:
✅ If the blue support holds and the price re-enters the ascending channel, further upside potential is likely.
✅ Key resistance levels:
Orange Zone (0.3202 - 0.3577): Possible initial reaction level.
Red Zone (0.6423 - 0.7232): Major resistance before reaching the final target.
✅ Key Consideration: If weakness in momentum and declining volume appear near these resistance levels, gradual profit-taking and a cautious approach could be wise. Otherwise, continued bullish momentum could push the price toward the channel’s upper boundary, targeting 1.0667 - 1.2607 (light blue TP zone).
📉 Bearish Scenario:
❌ If the blue support fails, the price could drop towards the next major support zone at 0.0691 - 0.0816 (gray support).
❌ Losing this level would invalidate the bullish structure and increase the likelihood of deeper declines.
🎯 Entry Strategy & Risk Management
⚡ Gradual entry within the blue support zone with a stop-loss below the gray zone is recommended.
⚡ Suggested risk: 0.25% to 0.5% of spot capital (to prevent heavy losses).
⚡ Volume increase in this area could signal a potential trend reversal.
🔹 Conclusion
The current support level is critical for GRT. If it holds, the bullish scenario remains intact, allowing for potential growth toward the upper boundary of the ascending channel. However, losing this level could invalidate the bullish structure and lead to a deeper correction.
🔸 Additionally, when approaching key resistance levels (0.3202 - 0.3577 and 0.6423 - 0.7232), monitoring volume and price behavior is essential. Signs of weakness in these zones may indicate an opportunity for gradual profit-taking and a more cautious approach.

TRADING LEVERAGE | How to Manage RISK vs REWARDFor today's post, we're diving into the concept " Risk-Reward Ratio "
We'll take a look at practical examples and including other relevant scenarios of managing your risk. What is considered a good risk to reward ratio and where can you see it ? This applies to all markets, and during these volatile times it is an excellent idea to take a good look at your strategy and refine your risk management.
You've all noticed the really helpful tool " long setup " or " short setup " on the left-hand column. This clearly identifies the area of profit (in green), the area for a stop-loss (in red) and your entry (the borderline). It also shows the percentage of your increases or decreases at the top and bottom. It looks like this :
💭Something to remember; It is entirely up to you where you decided to take profit and where you decide to put your stop loss. The IDEAL anticipated targets are given, but the price may not necessarily reach these points. You have that entire zone to choose from and you can even have two or three take profits points in a position.
Now, what is the Risk Reward Ratio expressed in the center as a number.number ?
The risk to reward ration is exactly as the word says : The amount you risk for the amount you could potentially gain. NOTE that your risk is indefinite, but your gains are not guaranteed. The risk/reward ratio measures the difference between the entry point to a stop-loss and a sell or take-profit point. Comparing these two provides the ratio of profit to loss, or reward to risk.
For example, if you're a gambler and you've played roulette, you know that the only way to win 10 chips is to risk 5 chips. Your risk here is expressed as 5:10 or 5.10 .You can spread these 5 chips out any way you like, but the goal of the risk is for a reward that is bigger than your initial investment. However, you could also lose your 5 and this will mean that you need to risk double as much in your next play to make up for your loss. Trading is no different, (except there is method to the madness other than sheer luck...)
Most market strategists and speculators agree that the ideal risk/reward ratio for their investments should not be less than 1:3, or three units of expected return for every one unit of additional risk. Take a look at this example: Here, you're risking the same amount that you could potentially gain. The Risk Reward ratio is 1, assuming you follow the exact prices for entry, TP and SL.
Can you see why this is not an ideal setup? If your risk/reward ratio is 1, it means you might as well not participate in the trade since your reward is the same as your risk. This is not an ideal trade setup. An ideal trade setup is a scenario where you can AT LEAST win 3x as much as what you are risking. For example:
Note that here, my ratio is now the ideal 2.59 (rounded off to 2.6 and then simplified it becomes 1:3). If you're wondering how I got to 1:3, I just divided 2.6 by 2, giving me 1 and 3.
Another way to express this visually:
In the first chart example I have a really large increase for the long position and you can't easily simplify 7.21 so; here's a visual to break down what that looks like:
If you are setting up your own trade, you can decide at what point you feel comfortable to set your stop loss. For example, you may feel that if the price drops by more than 10%, that's where you'll exit and try another trade. Or, you could decide that you'll take the odds and set your stop loss so that it only triggers if the price drops by 15%. The latter will naturally mean you are trading at higher risk because your risk of losing is much more. Seasoned analysts agree that you shouldn't have a value smaller than 5% for your stop loss, because this type of price action occurs often during a day. For crypto, I would say 10% because we all know that crypto markets are much more volatile than stock markets and even more so than commodity markets like Gold and Silver, which are the most stable.
Remember that your Risk/Reward ratio forms an important part of your trading strategy, which is only one of the steps in your risk management program. Dollar cost averaging is another helpfull way to further manage your risk. There are many more things to consider when thinking about risk management, but we'll dive into those in another post.

Silver XAGUSD defies them all. Breakout 1Hr
You can see the 1Hr candles from earlier this morning NY time where the squeeze was on.
I think that this Tariff' business of Donny's will include some volatile days but from my understanding & in only the past 24 hours that whole thing will actually be supportive of the Gold price and Cryptocurrency's amidst some fear sellers from time to time.

COFORGE Options Trading Strategy: Breakout and Momentum-BasedIn this post, we’ll explore a couple of options strategies for COFORGE using the data for strike price 9000 . By closely monitoring the price action and key option data, we can make informed decisions that align with market trends. Here’s how we can approach trading this stock’s options effectively:
Key Option Data Breakdown
Call Short Covering: Indicates that the market sentiment is bullish as traders are closing their call positions, signaling a potential upward movement.
Put Writing: A strong sign of bullishness as traders are actively writing puts, expecting the price to stay above the 9000 strike.
Call and Put LTP (Last Traded Price):
Calls LTP: 278.8 (indicating that calls are gaining traction).
Puts LTP: 100.7 (a lower LTP for puts suggests lower demand).
Open Interest (OI) and Change in OI:
Calls OI Change: -47,850 (indicating a reduction in call positions due to short covering).
Puts OI Change: +123,975 (signifying an increase in put writing, which reinforces the bullish sentiment).
Strategy 1: Buying the Call or Put Based on the First 5-Minute Candle
This strategy involves observing the price movement in the initial 5 minutes after the market opens and deciding whether to buy a call or put, depending on the price action and option data.
When to Buy the Call or Put:
If the first 5-minute candle shows a bullish move, consider buying the call option as the market sentiment appears to be in favor of upward movement.
If the first 5-minute candle shows a bearish move, consider buying the put option. However, given the overall data showing strong put writing, this could be less likely.
Why It Works:
The first 5 minutes are crucial for gauging market sentiment, and with the data indicating strong bullishness (due to call short covering and put writing), a call option is likely to perform well.
Considerations:
This strategy requires watching for clear momentum during the first 5 minutes. If the market remains indecisive, it may be better to stay on the sidelines to avoid wasting premium.
Strategy 2: Breakout Strategy – Buy Calls or Puts on the Break of Highs
This strategy involves waiting for a breakout of the call or put’s high price. The breakout indicates a shift in momentum, and we’ll enter the trade based on whichever direction triggers first.
When to Buy the Call:
Watch for the call’s high price (389.85). If the call option breaks this level, it signals that the upward momentum is gaining strength. Buy the call to capitalize on the breakout.
When to Buy the Put:
If the call option doesn’t break its high and the price starts to show weakness, consider buying the put once it breaks its high (360.6). However, the data suggests that the market bias is bullish, so a call breakout is more likely.
Why It Works:
Breakouts are powerful signals of market momentum. Since the data shows heavy put writing, the call option is more likely to break its high first. This creates an opportunity to buy calls in a bullish trend.
Considerations:
Always monitor the volume and the price action for confirmation of the breakout. If both calls and puts test their highs without clear direction, consider waiting for a clearer signal.
Conclusion:
Given the strong bullish sentiment reflected in the options data—call short covering and put writing—the most reliable strategy is Strategy 2. Watch for a call breakout above 389.85 or a put breakout above 360.6 (if the call fails to break its high). The bullish bias suggests that the call option is more likely to outperform, but a breakout in either direction can trigger the strategy.
Pro-Tip: Set a stop loss just below the breakout level to manage risk effectively. The market sentiment is heavily tilted towards bullishness, so a call option breakout is the most probable outcome.

Risk Management in Trading: Keeping It Simple and Stress-FreeIf you're new to trading, you’ve probably heard the golden rule: “Don’t risk more than 1-2% of your account on a single trade.” Sounds easy, right? But let’s be real—trading is way more than just crunching numbers.
Let’s Break It Down
1. Don’t Bet the Grocery Money! 🍎
First things first: Never trade with money you can’t afford to lose. Imagine this—your rent is due next week, but instead of saving, you decide to trade all that cash because you’re feeling lucky. Spoiler alert: That’s not luck—it’s a one-way ticket to Stress City. When you trade money you can’t afford to lose, every market wobble feels like the end of the world. Keep your bills paid and your pantry stocked before you even think about trading.
Example: Think of trading like buying lottery tickets. You wouldn’t spend your entire paycheck hoping to hit the jackpot, right? (Well, I hope not!) Treat your trading account the same way.
2. Discipline > Math 🧠
Sure, knowing the 1% rule is cool, but what really matters is sticking to it. Here’s the thing: Losing streaks happen to everyone—even pros. The question is, how many losses in a row can you handle without losing your cool and going all-in on a “revenge trade”?
Example: Think of it like a diet. You promise to eat just one cookie, but after a bad day, you eat the whole pack. The same thing happens in trading if you’re not disciplined. One bad trade can lead to a whole bunch of bad decisions.
3. Trading Won’t Pay Your Bills (At Least Not Yet) 💸
Many people dream of quitting their job to trade full-time. Sounds great, but here’s the catch: You need a lot of money to make trading your main income source. The trader in the video suggests keeping a day job while learning the ropes. That way, you’re not relying on trading profits to survive.
Example: Imagine opening a lemonade stand, but you only have two lemons. You can’t expect to make enough lemonade to pay rent! Work on growing your “lemon supply” (your trading skills and capital) before you go all-in.
4. Watch Your Trade Count 🕒
Making too many trades in one day is like eating too much junk food—it might feel good at first, but it’ll cost you later. Even small risks add up quickly when you’re overtrading. The pros call this “death by a thousand cuts.”
Example: If you take 10 trades in a day, risking 1% each, you’re suddenly risking 10%. That’s like ordering 10 desserts because “they’re just tiny.” Spoiler: It adds up fast.
5. Learn from Poker Players 🎲
Ever watched poker pros on TV? They don’t bet everything on one hand—they manage their “bankroll” carefully, so they don’t lose it all. The same idea works in trading. Lower your position size when things aren’t going well so you can stay in the game.
Pro Tip: Want a fun exercise? Use poker chips or fake money to practice “betting” on trades. Seeing your stack shrink will remind you why managing losses is so important.
Simple but Powerful Lessons
Build a Safety Net: Before you think about trading full-time, save up enough money to cover your expenses for a few months. This way, you can trade without freaking out over every dollar.
Learn a Backup Skill: Trading takes time to master. While you’re learning, keep a steady job to support yourself financially.
Focus on the Process, Not the Profits: Winning traders don’t obsess over the money—they focus on following their strategy and improving their skills.
A Few Quotes to Keep in Mind
“Risk management isn’t about numbers; it’s about discipline.”
“If losing money makes you panic, you’re trading too much.”
“Turn off the profit and loss display—focus on making good trades.”
Final Thought: Keep It Chill
Trading is like a marathon, not a sprint. Take your time, stick to your plan, and never risk more than you’re comfortable losing. If you approach it with patience and discipline, you’ll not only survive but thrive in the markets.
Now, go grab a coffee (or lemonade) and plan your next trade with confidence! ☕🍋
Hope you enjoyed the content I created, You can support with your likes and comments this idea so more people can watch!
✅Disclaimer: Please be aware of the risks involved in trading. This idea was made for educational purposes only not for financial Investment Purposes.
---
• Look at my ideas about interesting altcoins in the related section down below ↓
• For more ideas please hit "Like" and "Follow"!

Hidden Risk: How to Uncover and Control Before You Click 'Buy'As seasoned traders, we understand that risk management isn't just a beginner's concept; it's the bedrock of sustainable profitability. We've moved beyond the rudimentary rules and are fluent in position sizing and stop-loss orders. But in the dynamic landscape of TradingView, where opportunities arise and vanish in the blink of an eye, even intermediate traders can fall prey to impulsive decisions that erode our hard-earned capital.
The solution? Systematizing our risk assessment with a pre-trade risk profile. It isn't about reinventing the wheel but refining our approach to ensure that every trade aligns with our overall strategy and risk tolerance. It gives us an edge by keeping us disciplined.
The Pitfalls of Complacency
It's easy to become complacent when we've got a few winning trades under our belt. We start to feel invincible precisely when we're most vulnerable. We might skip steps, loosen our stop-losses, or increase our position sizes beyond our predefined limits. We are often driven by emotions rather than logic, and it's a slippery slope.
Remember, even a well-defined risk management plan is useless if it's not consistently applied. Each trade carries unique risks influenced by factors beyond our standard calculations.
Creating a Pre-Trade Risk Profile: A Refresher
Before hitting that buy or sell button, click on TradingView to create a simple risk profile for the specific trade. Ask yourself a series of critical questions:
1. The Asset's Volatility:
What's the current Average True Range (ATR)? How does it compare to the asset's historical ATR? Higher volatility demands wider stop-losses and potentially smaller position sizes.
Are there any upcoming news events or economic releases that could impact volatility? Factor these in, as they can significantly alter the risk landscape. Be aware of, for instance, earning reports.
2. The Trade Setup:
What's your entry point, and why? Is it based on an explicit technical signal, or are you chasing a move?
Where's your stop-loss, and what is your rationale behind it? Is it placed below a key support level or based on a multiple of the ATR?
What's your target price, and is it realistically achievable given the current market conditions? Avoid setting overly ambitious targets that expose you to unnecessary risk.
3. The Correlation Factor:
How does this asset correlate with other positions in your portfolio? Are you inadvertently increasing your exposure to a specific sector or market trend?
Could a single event trigger losses across multiple positions? Diversification is key, but it requires careful consideration of correlations.
4. The Time Factor:
What's your intended holding period for this trade? The longer the timeframe, the greater the potential for unforeseen events to impact your position.
Does your stop-loss need to be adjusted based on the timeframe? A wider stop-loss than a day trade might be necessary for a swing trade.
5. The "Gut Check":
Are you comfortable with the potential loss on this trade? If the answer is no, it's a red flag. Either reduce your position size or reconsider the trade altogether.
Are you trading based on a well-defined plan, or are emotions driving your decision? Be honest with yourself.
From Profile to Action: Implementing Your Assessment
Once you've answered these questions, you have a clearer picture of the trade's risk profile. Use this information to:
Fine-tune your position size: Ensure it aligns with your pre-determined risk per trade (e.g., 1-2% of your capital).
Set your stop-loss: Place it strategically based on the asset's volatility and your chosen support/resistance levels.
Determine your risk/reward ratio: Is the potential profit worth your risk? Aim for at least a 1:2 or 1:3 risk/reward ratio.
Bonus Tip: Develop Your Risk Score System
Consider creating a simple risk score system to streamline your risk assessment further. Assign points to different risk factors based on their potential impact.
For example, here is the Trade Impact Estimator (T.I.E):
Volatility: Low Volatility (Below Average ATR): +1 point
Average Volatility (Within Average ATR): 0 points
High Volatility (Above Average ATR): -1 point
News Events: Major News Event Scheduled: -2 points
Minor News Event: -1 point
No News Event: +1 Point
Correlation: High Correlation with Existing Positions: -1 point
Low Correlation: +1 point
Timeframe: Day Trade: +1 point
Swing Trade: 0 points
Long-Term Trade: -1 point
Trade setup: Good Risk/reward ratio: +1 point
Neutral Risk/Reward ratio: 0 points
Bad Risk/Reward ratio: -2 points
Set Thresholds:
Total Score of +3 or higher: Potentially a lower-risk trade, consider proceeding as planned.
Total Score between 0 and +2: Proceed cautiously; consider reducing position size.
Total Score of -1 or lower: Re-evaluate the trade, widen your stop-loss, significantly reduce position size, or avoid the trade altogether.
Disclaimer: This is a simplified example. You can customize your risk score system to include additional factors and adjust the point values based on your own trading style and risk tolerance. You can also assign more points to factors that have historically impacted your trading results. It's crucial to backtest and refine your system over time.
The Takeaway
Mastering risk management is a continuous journey. By incorporating a pre-trade risk profile into our routine, we elevate our trading from reactive to proactive. We transform ourselves from gamblers to calculated risk-takers. On TradingView, where information flows ceaselessly, this disciplined approach is not just an advantage; it's a necessity. So, refine your process, stay vigilant, and make your trades profitable.

Renzo (REZ)REZ Analysis
🔹 Overall Status:
After an initial drop, REZ coin has been fluctuating within a range box (yellow zone) between 0.03070 - 0.05034 and has recently broken above the upper limit of the box, moving upwards. Currently, the price is pulling back to this broken range zone.
🔹 Key Levels:
1️⃣ Support Levels:
Bottom of the range box: 0.033 - 0.030
0.618 Fibonacci retracement: Current potential support area
2️⃣ Resistance Levels:
Daily resistance zone (red): 0.065
Bullish Targets:
First Target: 0.17279 - 0.21604 (1 Fibonacci level)
Second Target: 0.40065 - 0.50092 (1.618 Fibonacci level)
Third Target: 2.09323 - 2.61712 (2.618 Fibonacci level)
🔹 RSI and Entry Signals:
RSI is currently in an ascending channel on the daily timeframe and is at the bottom of the channel, suggesting potential support and continuation of the uptrend.
A move of RSI into the overbought zone, along with a breakout of key resistances, could signal a stronger entry point.
🔹 Scenarios:
✅ Bullish Scenario:
If the price stabilizes above the 0.065 daily resistance (red) with increasing trading volume, a move towards Fibonacci targets becomes more probable.
⚠️ Bearish Scenario:
If the price fails to stabilize above resistance, a correction towards the range box bottom (0.033 - 0.030) could occur.
🔹 Trading Volume:
Monitoring the increase in volume when breaking the daily resistance is crucial, as it could signal a sharp move.
🔹 Conclusion:
Safe Entry: After price stabilizes above the red resistance zone with increased volume.
Risky Entry Zones: Near the range box support levels and 0.618 Fibonacci retracement.
📊 Confirmations:
Breakout of daily resistance with high volume
Support from RSI at the bottom of the ascending channel
Reaction to Fibonacci levels
🔑 Recommendation: Always prioritize capital management. Set a stop-loss at the breakdown of the 0.030 support zone.

Compound (COMP)
🔢 COMP Analysis
🔹 Overall Status:
The COMP coin, after following an ascending channel, successfully broke above the channel’s ceiling. At the PRZ zone (which includes the ascending channel ceiling and weekly resistance), selling pressure led to a price correction, pushing the price down to the 0.382 Fibonacci level.
✅ Key Point:
Stabilizing above the PRZ zone can accelerate price growth toward Fibonacci targets.
Trading volume in this area is crucial as it can provide stronger signals about the buyers' or sellers' dominance.
🔹 Support and Resistance Analysis:
1️⃣ Support Levels:
First Support: 0.382 Fibonacci level around $79-$81.
Second Support: 0.5 Fibonacci level around $68-$71.
Third Support: 0.618 Fibonacci level near $60-$62.
2️⃣ Resistance Levels:
PRZ Zone: Weekly resistance and broken ascending channel ceiling (around $92-$103).
Bullish Targets:
First Target: 1.618 Fibonacci level (already achieved).
Second Target: 2.618 Fibonacci level near $300-$330.
Third Target: 3.272 Fibonacci level around $500-$550.
Final Target: 3.618 Fibonacci level near $720-$750.
🔹 Price Movement Prediction:
1️⃣ Bullish Scenario (if price stabilizes above PRZ):
If the price stabilizes above $140 (PRZ zone), it may head toward the 2.618, 3.272, and 3.618 Fibonacci levels.
Increased trading volume above PRZ will confirm buyers' dominance.
2️⃣ Bearish Scenario (if the correction continues):
If the 0.382 Fibonacci level is broken, the price correction could extend to the 0.5 and 0.618 Fibonacci levels.
These levels could offer attractive opportunities for re-entry via laddered buying.
🔹 RSI and Entry Signals:
The RSI indicator on the weekly timeframe is at 72.71 (overbought zone), indicating possible selling pressure.
Positive Note: A bullish divergence between the price and RSI suggests the uptrend may resume after a correction.
The ascending RSI trendline can act as support.
✅ Conclusion and Recommendations:
1️⃣ Key Levels:
Supports: $79-$81 (0.382), $68-$71 (0.5), and $60-$62 (0.618 Fibonacci).
Resistances: $130-$140 (PRZ) and higher targets at $300-$330, $500-$550, and $720-$750.
2️⃣ Entry Strategies:
Laddered buying near 0.5 and 0.618 Fibonacci support levels if the correction continues.
Entry after price stabilizes above the PRZ zone ($130) with rising trading volume.
3️⃣ Risk Management:
Pay close attention to trading volume and price action near critical levels.
Monitor the RSI indicator to assess trend strength and identify potential corrections or continued growth.
💡 Final Recommendation:
In the current conditions, wait for technical confirmations (such as stabilization above resistance or corrections to lower levels) before entering. Prioritize capital management to minimize risks.

The bears pair of the week. Shorting today into Dec. EURGBP
You could definitely do well shorting the EURUSD pair today, but even more lucrative is probably to go short on the EURGBP currency pair.
Why do I make this call?
Because it is imho more bearish than EURUSD at present, because unlike the latter which will probably have a bounce intraday at least during the start of the Asian session, bears will move in at some point on EURUSDvat about the 1hr timeframe from memory.
But every chart I viewed of EURGBP 1minute to 3monthly has the tipping-over effect and right from the get-go I think this will sell-off.
Of the other EUR pairs I have checked, i'm only about 1/3 through, EURCAD & EURAUD are also very bearish on the charts and the EURUSD I expect to gain the bearish sell a bit later during Asia Monday.
I will probably take a small lot size Short and ride this one into December using a mental-soft-stop which puts me in control to exit the trade when I want. For example, if an intervening bullish news story is released to the market to pump up the falling EUR.
I would like to report back when profits or losses are taken. For a review of trade.
