EURGBP: Bearish Continuation from Reclaimed Order Block!Greetings Traders,
In today’s analysis of EURGBP, we observe that institutional order flow on the H4 timeframe has recently shifted bearish. This provides us with a clear directional bias to look for shorting opportunities in line with the prevailing higher timeframe trend.
Higher Timeframe Context:
On the weekly timeframe, price action is currently drawing towards a Weekly Fair Value Gap (FVG). This bearish draw on liquidity confirms the macro-level bearish sentiment. With the recent bearish market structure shift (MSS) on the H4, we now have strong confluence between the weekly and intraday order flow, favoring continued downside.
Key Observations on H4:
Reclaimed Bearish Order Block: After shifting structure to the downside, price has retraced into a bearish reclaimed order block—a region previously marked by institutional selling. This return to the origin of prior sell-side imbalance offers institutions the opportunity to mitigate earlier positions and reinitiate shorts. The failure of price to break higher confirms bearish intent.
Confluence with Weekly Draw: The reclaimed order block aligns with the broader draw towards the weekly FVG, providing an optimal zone for bearish confirmation entries.
Trading Plan:
Entry Strategy: Look for lower timeframe confirmation entries within the H4 reclaimed order block.
Target: The short-term target remains the Weekly Fair Value Gap, supporting a discount-side delivery.
As always, remain disciplined in execution. Let the market confirm your bias before entering, and manage risk according to your rules.
For a detailed market walkthrough and in-depth execution zones, be sure to watch this week’s Forex Market Breakdown:
Kind Regards,
The Architect 🏛️📉
Riskmangement

Trading as a Probabilistic ProcessTrading as a Probabilistic Process
As mentioned in the previous post , involvement in the market occurs for a wide range of reasons, which creates structural disorder. As a result, trading must be approached with the understanding that outcomes are variable. While a setup may reach a predefined target, it may also result in partial continuation, overextension, no follow-through, or immediate reversal. We trade based on known variables and informed expectations, but the outcome may still fall outside them.
Therefore each individual trade should be viewed as a random outcome. A valid setup could lose; an invalid one could win. It is possible to follow every rule and still take a loss. It is equally possible to break all rules and still see profits. These inconsistencies can cluster into streaks, several wins or losses in a row, without indicating anything about the applied system.
To navigate this, traders should think in terms of sample size. A single trade provides limited insight, relevant information only emerges over a sequence of outcomes. Probabilistic trading means acting on repeatable conditions that show positive expectancy over time, while accepting that the result of any individual trade is unknowable.
Expected Value
Expected value is a formula to measure the long-term performance of a trading system. It represents the average outcome per trade over time, factoring in both wins and losses:
Expected Value = (Win Rate × Average Win) – (Loss Rate × Average Loss)
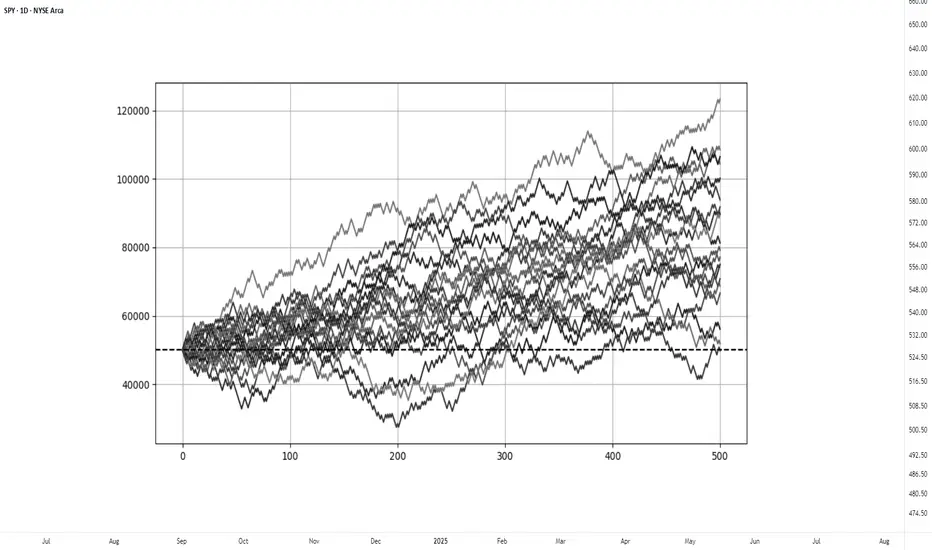
This principle can be demonstrated through simulation. A basic system with a 50% win rate and a 1.1 to 1 reward-to-risk ratio was tested over 500 trades across 20 independent runs. Each run began with a $50,000 account and applied a fixed risk of $1000 per trade. The setup, rules, and parameters remained identical throughout; the only difference was the random sequence in which wins and losses occurred.
While most runs clustered around a profitable outcome consistent with the positive expected value, several outliers demonstrated the impact of sequencing. When 250 trades had been done, one account was up more than 60% while another was down nearly 40%. In one run, the account more than doubled by the end of the 500 trades. In another, it failed to generate any meaningful profit across the entire sequence. These differences occurred not because of flaws in the system, but because of randomness in the order of outcomes.
These are known as Monte Carlo simulations, a method used to estimate possible outcomes of a system by repeatedly running it through randomized sequences. The technique is applied in many fields to model uncertainty and variation. In trading, it can be used to observe how a strategy performs across different sequences of wins and losses, helping to understand the range of outcomes that may result from probability.
Trading System Variations
Two different strategies can produce the same expected value, even if they operate on different terms. This is not a theoretical point, but a practical one that influences what kind of outcomes can be expected.
For example, System A operates with a high win rate and a lower reward-to-risk ratio. It wins 70% of the time with a 0.5 R, while System B takes the opposite approach and wins 30% of the time with a 2.5 R. If the applied risk is $1,000, the following results appear:
System A = (0.70 × 500) − (0.30 × 1,000) = 350 − 300 = $50
System B = (0.30 × 2,500) − (0.70 × 1,000) = 750 − 700 = $50
Both systems average a profit of $50 per trade, yet they are very different to trade and experience. Both are valid approaches if applied consistently. What matters is not the math alone, but whether the method can be executed consistently across the full range of outcomes.
Let’s look a bit closer into the simulations and practical implications.
The simulation above shows the higher winrate, lower reward system with an initial $100,000 balance, which made 50 independent runs of 1000 trades each. It produced an average final balance of $134,225. In terms of variance, the lowest final balance reached $99,500 while the best performer $164,000. Drawdowns remained modest, with an average of 7.67%, and only 5% of the runs ended below the initial $100,000 balance. This approach delivers more frequent rewards and a smoother equity curve, but requires strict control in terms of loss size.
The simulation above shows the lower winrate, higher reward system with an initial $100,000 balance, which made 50 independent runs of 1000 trades each. It produced an average final balance of $132,175. The variance was wider, where some run ended near $86,500 and another moved past $175,000. The drawdowns were deeper and more volatile, with an average of 21%, with the worst at 45%. This approach encounters more frequent losses but has infrequent winners that provide the performance required. This approach requires patience and mental resilience to handle frequent losses.
Practical Implications and Risk
While these simulations are static and simplified compared to real-world trading, the principle remains applicable. These results reinforce the idea that trading outcomes must be viewed probabilistically. A reasonable system can produce a wide range of results in the short term. Without sufficient sample size and risk control, even a valid approach may fail to perform. The purpose is not to predict the outcome of one trade, but to manage risk in a way that allows the account to endure variance and let statistical edge develop over time.
This randomness cannot be eliminated, but the impact can be controlled from position sizing. In case the size is too large, even a profitable system can be wiped out during an unfavorable sequence. This consideration is critical to survive long enough for the edge to express itself.
This is also the reason to remain detached from individual trades. When a trade is invalidated or risk has been exceeded, it should be treated as complete. Each outcome is part of a larger sample. Performance can only be evaluated through cumulative data, not individual trades.
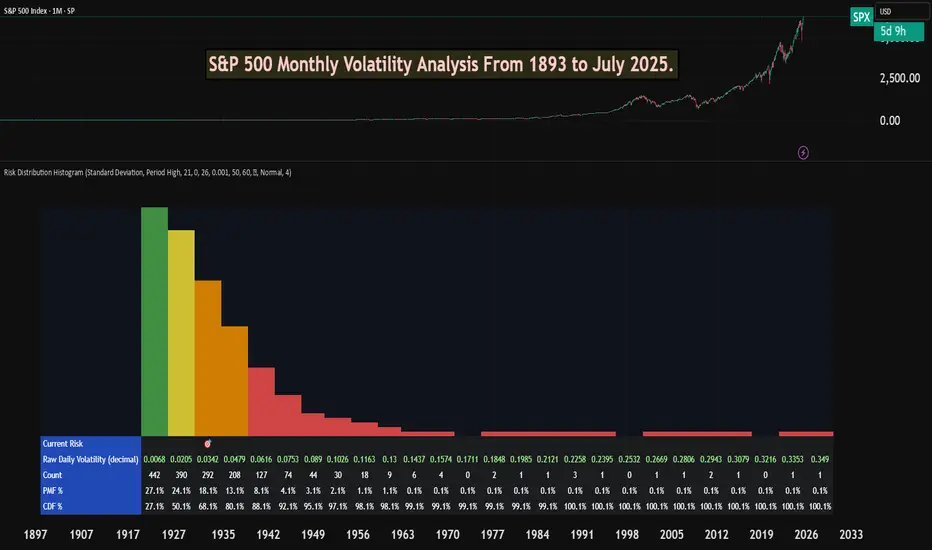
S&P 500 Monthly Volatility Analysis From 1893 to July 2025Most of the time, the S&P 500 is seen as a low-volatility index when compared to most individual stocks, small-cap indexes, or indexes from other countries.
However, most investors don't know exactly what volatility to expect from a statistical perspective.
The Risk Distribution Histogram allows us to understand exactly how risk is distributed.
S&P 500 Statistical Risk Distribution
Here are some highlights from what we get from the analysis. Some of this data might actually surprise investors. The data is monthly:
27% of all months have volatility under 0.68%
80% of all months' volatility was under 4.79%
5% of all months had a volatility of over 7%
If we can call a volatility over 25% a severe crash or "grey" swan, we had 7 of those events
3 months with extreme volatility over 30%
This allows us to understand tail risk and plan ahead. While most times the S&P 500 is in the low volatility zone, extreme events can happen.
What can we learn from this?
Prepare for rare but possible high-volatility events.
Understand the 80/20 rule. Most months are very low volatility, but 20% of them will have a volatility higher than 5% approximately.
Avoid overconfidence in stability
Plan for long-term horizons. High volatility tends to "dissipate" in the long term.
This is why it's important not to discard rare high-volatility events, especially when the investor is in need of liquidity.
This risk analysis can be done for any ticker.
Risk-to-Reward and Journaling : Track, analyze, and evolve
📈 Mastering the Markets: Why Risk-to-Reward and Journaling Are Every Trader’s Edge
In trading, profitability isn't just about making winning trades — it's about managing risk smartly and learning from every position. Two of the most underrated habits that separate amateurs from consistent traders are:
1. Understanding Risk-to-Reward (R:R)
The risk-to-reward ratio is the foundation of trade planning. It's a simple calculation of how much you're willing to risk versus how much you aim to gain. A ratio of 1:2 means you risk $1 to potentially make $2.
✅ Why it matters:
Even with a 40% win rate, a positive R:R can still yield profitability.
It disciplines your entries, stops, and targets — no more emotional exits.
It forces you to filter out trades that don’t offer enough upside.
📊 For example, if you take 10 trades risking $100 each with a 1:2 R:R:
Win 4 = $800 gain
Lose 6 = $600 loss
Net Profit = $200 despite winning less than half.
2. The Power of Journaling
Trading without a journal is like flying blind. Your memory fades, but data doesn’t lie. A trading journal helps you:
🧠 Improve strategy by analyzing what works (symbols, timeframes, setups)
📉 Spot patterns in losses — overtrading? wrong R:R? bad timing?
📈 Stay disciplined — journaling enforces accountability
📒 Capture emotions — was it fear or FOMO? A journal tracks mindset too.
In my experience, journaling alone can boost a trader’s edge more than tweaking indicators. It turns experience into insight.
🎯 Final Word
The market rewards preparation, not prediction. A solid risk-to-reward framework keeps you in the game. Journaling turns your trades into tuition. Together, they compound your growth.
Happy Trading
Look First, Then LeapIn trading, how you prepare matters more than how you react. The phrase “Look first, then leap” reminds traders to avoid impulsive decisions and instead focus on proper analysis, planning, and risk control. Whether you're trading stocks, forex, crypto, or commodities, this principle can save you from painful losses and build a foundation for long-term success.
Let’s break down what it really means to “look first,” and how applying this mindset can improve your trading discipline.
✅Preparation Beats Emotion
Before entering any trade, a trader should ask: What is this trade based on? Logic or emotion?
🔹 Control Impulsive Decisions
Most losing trades happen when people act on gut feelings, FOMO, or after seeing a sudden price spike. But excitement is not a strategy; analysis is.
🔹 Check the Basics First
-What is the market trend? (uptrend, downtrend, or sideways?)
-Are you trading with or against the trend?
-Are there any upcoming news events that might impact the market?
Taking a moment to “look first” gives clarity and filters out low-probability trades.
✅ Trade Only When There’s a Setup
The best trades often come from waiting for the right moment, not forcing entries.
🔹 Identify Clear Patterns
Before jumping in, confirm your strategy setup:
-Is it a breakout or a fakeout?
-Are key support/resistance levels respected?
-Is volume supporting the move?
🔹 Use Confirmation Tools
Indicators like RSI, MACD, and moving averages can support your decision. Price action and patterns like triangle, channel, and flag also provide valuable clues.
Look first means not reacting to the first move; wait for the follow-through.
✅ Always Define Risk and Reward
Entering a trade without a defined stop-loss or target is like jumping into water without checking its depth.
🔹 Use a Risk-Reward Ratio
Before leaping into a trade, ask yourself:
-What am I risking?
-What can I gain?
Aim for a minimum risk-reward ratio of 1:2 or 1:3 to stay profitable even with a lower win rate.
🔹 Position Sizing Matters
Know how much of your capital to allocate. Using 1-2% of your capital per trade helps manage losses and avoid emotional pressure.
✅ Adjust for Market Conditions
Just because you’ve seen success in one type of market doesn’t mean your strategy will always work.
🔹 Trending vs. Ranging Markets
-Trend-following strategies work well in strong trends.
-Mean-reversion or breakout-fade strategies work better in sideways markets.
🔹 Check for Major News or Events
Earnings reports, central bank meetings, or geopolitical events can change everything in seconds. Before entering a trade, look at the calendar.
Adapting to market conditions is part of looking first.
✅ Use a Trading Plan, Not Just a Feeling
Every trade should follow a plan, not just “I think this will go up.”
🔹 What Should Your Plan Include?
Entry and exit rules
-Stop-loss and take-profit levels
-Criteria for valid setups
-Timeframes and trading hours
A plan brings structure and consistency, reducing emotional decisions.
✅ Journaling and Reviewing Trades
Looking first also means learning from the past.
🔹 Keep a Trading Journal
Log every trade entry, exit, reason, emotion, and outcome. This helps you spot mistakes and patterns in your behavior.
🔹 Review Regularly
After a drawdown or losing streak, review your last 10–20 trades. Was your strategy sound? Were you disciplined? Did you look before you leaped?
Improvement comes from reflection and correction.
✅ Be Mentally Ready Before Every Trade
Looking first also means checking your internal state.
🔹 Ask Yourself Before Trading:
-Am I calm and focused?
-Am I trying to recover a loss?
-Am I trading because I’m bored or emotional?
If your mindset is off, step away. A bad state leads to bad decisions—even with a good strategy.
✅Backtest and Practice Before Going Live
Before risking real money, test your setup thoroughly.
🔹 Why Backtesting Helps
It lets you see how your system performs on historical data. This builds confidence and filters out weak strategies.
🔹 Demo Trading Is Smart, Not Weak
Trading in a demo account before going live helps you learn execution, order management, and emotional control—without financial damage.
✅ Protect Capital First, Trade Second
Your first goal isn’t to make money, it’s to stay in the game.
🔹 Survive First, Then Thrive
Big losses can take weeks or months to recover. That’s why looking first is critical—it prevents careless trades that damage your capital.
✅Final Word: Be the Trader Who Waits
The market rewards those who are patient, disciplined, and prepared. Anyone can open a trade, but only those who look first truly understand what they’re doing.
Before your next trade, ask yourself:
“Do I have a clear reason, a defined risk, and the right mindset? Or am I just reacting?”
Because in trading, it’s not how many trades you take, it’s how many good trades you wait for.
In trading, success doesn't come from speed; it comes from clarity, preparation, and discipline. The principle “Look first, then leap” serves as a constant reminder to slow down, observe, analyze, and plan before taking action. It’s a mindset that separates the disciplined trader from the emotional speculator.
Every trade you take should be backed by logic, not impulse. Whether it’s identifying the right setup, managing your risk, or simply being patient enough to wait for confirmation, looking first gives you control in a world that thrives on chaos.
In the end, trading isn’t about making quick money—it’s about making the right decisions consistently. So before your next trade, take a breath, do your research, and ask yourself:
“Am I truly ready to leap, or do I need to look one more time?”
That one extra moment of reflection could be the difference between a lesson and a profit.
Cheers
Hexa🧘♀️
Chart Image Credit: TradingView
Protect Capital First, Trade SecondIn the world of trading, mastering technical analysis or finding winning strategies is only part of the equation. One of the most overlooked but essential skills is money management. Even the best trading strategy can fail without a solid risk management plan.
Here’s a simple but powerful money management framework that helps you stay disciplined, protect your capital, and survive long enough to grow.
✅1. Risk Only 2% Per Trade
The 2% rule means you risk no more than 2% of your total capital on a single trade.
-Example: If your trading account has $10,000, your maximum loss per trade should not exceed $200.
-This protects you from large losses and gives you enough room to survive a losing streak without major damage.
A disciplined approach to risk keeps your emotions under control and prevents you from blowing your account.
✅2. Limit to 5 Trades at a Time
Keeping your number of open trades under control is essential to avoid overexposure and panic management.
-A maximum of 5 open trades allows you to monitor each position carefully.
-It also keeps your total account risk within acceptable limits (2% × 5 trades = 10% total exposure).
-This rule encourages you to be selective, focusing only on the highest quality setups.
Less is more. Focus on better trades, not more trades.
✅3. Use Minimum 1:2 or 1:3 Risk-Reward Ratio
Every trade must be worth the risk. The Risk-Reward Ratio (RRR) defines how much you stand to gain compared to how much you’re willing to lose.
-Minimum RRR: 1:2 or 1:3
Risk $100 to make $200 or $300
-This allows you to be profitable even with a win rate below 50%.
Example:
If you take 10 trades risking $100 per trade:
4 wins at $300 = $1,200
6 losses at $100 = $600
→ Net profit = $600, even with only 40% accuracy.
A poor RRR forces you to win frequently just to break even. A strong RRR gives you room for error and long-term consistency.
✅4. Stop and Review After 30% Drawdown
Drawdowns are a part of trading, but a 30% drawdown from your account's peak is a red alert.
When you hit this level:
-Stop trading immediately.
-Conduct a full review of your past trades:
-Were your losses due to poor strategy or poor execution?
-Did you follow your stop-loss and risk rules?
-Were there changes in the market that invalidated your setups?
You must identify the problem before you continue trading. Without review, you risk repeating the same mistakes and losing more.
This is not failure; it’s a checkpoint to reset and rebuild your edge.
Final Thoughts: Survive First, Thrive Later
In trading, capital protection is the first priority. Profits come after you've mastered control over risk. No trader wins all the time, but the ones who respect risk management survive the longest.
Here’s your survival framework:
📉 Risk max 2% per trade
🧠 Limit to 5 trades
⚖️ Maintain minimum 1:2 or 1:3 RRR
🛑 Pause and review after 30% drawdown
🧘 Avoid revenge trading and burnout
Follow these principles and you won't just trade, you'll trade with discipline, confidence, and longevity.
Cheers
Hexa
The Dangers of Holding Onto Losing Positions...One of the most common — and costly — mistakes in trading is holding onto a losing position for too long. Whether it's driven by hope, ego, or fear, this behavior can damage your portfolio, drain your capital, and block future opportunities. Successful trading requires discipline, objectivity, and the willingness to accept when a trade isn’t working. Understanding the risks behind this behavior is essential to protecting your capital and evolving as a trader.
-- Why Traders Hold Onto Losing Trades --
It’s not always poor strategy or lack of experience that keeps traders locked in losing positions — it’s often psychology. Several cognitive biases are at play:
1. Loss Aversion
Loss aversion refers to our instinctive desire to avoid losses, often stronger than the desire to realize gains. Traders may hold onto a losing position simply to avoid the emotional pain of admitting the loss, hoping the market will eventually turn in their favor.
2. Overconfidence
When traders are overly confident in their analysis or trading thesis, they can become blind to changing market conditions. This conviction may cause them to ignore red flags and hold on out of sheer stubbornness or pride.
3. The Sunk Cost Fallacy
This is the belief that since you’ve already invested money, time, or effort into a trade, you need to keep going to “get your investment back.” The reality? Past investments are gone — and continuing the position often compounds the loss.
These mental traps can distort decision-making and trap traders in unproductive or damaging positions. Being aware of them is the first step toward better judgment.
-- The True Cost of Holding Losing Positions --
Holding onto a bad trade costs more than just the money it loses. It impacts your entire trading strategy and limits your growth. Here’s how:
1. Opportunity Cost
Capital tied up in a losing trade is capital that can’t be used elsewhere. If you keep $8,000 in a stock that’s fallen from $10,000 — hoping it rebounds — you're missing out on placing that money in higher-performing opportunities. Inactive capital is wasted capital.
2. Deeper Compounding Losses
A 20% loss doesn’t sound catastrophic until it becomes 30%… then 40%. The deeper the loss, the harder it becomes to break even. Holding out for a recovery often makes things worse — especially in markets with high volatility or downtrends.
3. Reduced Liquidity
Successful traders rely on flexibility. When your funds are tied up in a losing position, you limit your ability to respond to new opportunities. In fast-moving markets, this can be the difference between success and stagnation.
Recognizing these costs reframes the decision from “holding on until it turns around” to “preserving capital and maximizing potential.”
Consider this simple XAUUSD (Gold) weekly chart example. If you base a trading strategy solely on the Stochastic oscillator (or any single indicator) without backtesting and ignoring the overall trend, focusing solely on overbought signals for reversals, you'll quickly see the oscillator's frequent inaccuracies. This approach will likely lead to substantial and prolonged losses while waiting for a reversal that may never occur.
-- Signs It’s Time to Exit a Losing Trade --
The hardest part of trading isn’t opening a position — it’s closing a bad one. But if you know what to look for, you’ll know when it’s time to let go:
1. Emotional Attachment
If you find yourself feeling “married” to a trade, it’s a warning sign. Traders often assign meaning or identity to a position. But trading should be based on data and strategy, not sentiment.
2. Ignoring or Adjusting Your Stop Loss
Stop Loss orders exist for a reason: to protect your capital. If you habitually move your stop further to avoid triggering it, you’re letting hope override risk management.
3. Rationalizing Losses
Statements like “It’ll bounce back” or “This company always recovers” can signal denial. Hope is not a strategy. When you catch yourself justifying a bad position without objective reasoning, it’s time to reevaluate.
Consider also reading this article:
-- How to Cut Losses and Move Forward --
Cutting a loss isn’t a failure — it’s a skill. Here are proven techniques that help you exit with discipline and confidence:
1. Use Stop Losses — and Respect Them
Set a Stop Loss at the moment you enter a trade — and stick to it. It takes the emotion out of the exit and protects your downside. Moving the stop is the fastest path to deeper losses.
2. Trade With a Plan
Every trade should be part of a bigger strategy that includes risk tolerance, entry/exit points, and profit targets. If a position hits your predetermined loss threshold, exit. Trust your system.
3. Apply Position Sizing and Diversification
Never risk more than a small percentage of your capital on a single trade. Keep your portfolio diversified across different instruments or sectors to avoid one position derailing your progress.
4. Review and Reflect
Post-trade analysis is vital. Review both wins and losses to learn what worked — and what didn’t. This practice sharpens your strategy and builds emotional resilience over time.
-- Why Cutting Losses Strengthens Your Portfolio --
There’s long-term power in letting go. Here’s what cutting losses early can do for you:
1. Preserve Capital
The faster you cut a losing trade, the more capital you retain — and the more opportunities you can pursue. Capital preservation is the foundation of longevity in trading.
2. Reduce Emotional Stress
Sitting in a losing trade weighs heavily on your mindset. The stress can cloud your judgment, increase risk-taking, or cause hesitation. Exiting early reduces this emotional drag and keeps you clear-headed.
3. Reallocate to Better Setups
Exiting losing trades frees up both capital and mental energy for higher-probability opportunities. This proactive approach builds momentum and reinforces the idea that it’s okay to be wrong — as long as you act decisively.
Consider also reading this article:
-- Final Thoughts: Discipline Over Denial --
Holding onto losing trades may feel like you're showing patience or commitment — but in reality, it's often denial wrapped in hope. Trading is about probabilities, not guarantees. The most successful traders aren’t the ones who win every trade — they’re the ones who manage losses with discipline.
Letting go of a bad trade is a show of strength, not weakness. It’s a deliberate choice to protect your capital, stay agile, and refocus on trades that serve your goals. The market doesn’t owe you a comeback — but with a clear head and disciplined approach, you can always find your next opportunity.
✅ Please share your thoughts about this article in the comments section below and HIT LIKE if you appreciate my post. Don't forget to FOLLOW ME; you will help us a lot with this small contribution.
123 Quick Learn Trading Tips - Tip #7 - The Dual Power of Math123 Quick Learn Trading Tips - Tip #7
The Dual Power of Math: Logic for Analysis, Willpower for Victory
✅ An ideal trader is a mix of a sharp analyst and a tough fighter .
To succeed in the financial markets, you need both logical decision-making and the willpower to stay on track.
Mathematics is the perfect gym to develop both of these key skills at the same time.
From a logical standpoint, math turns your mind into a powerful analysis tool. It teaches you how to break down complex problems into smaller parts, recognize patterns, and build your trading strategies with step-by-step thinking.
This is the exact skill you need to deeply understand probabilities and accurately calculate risk-to-reward ratios. 🧠
But the power of math doesn't end with logic. Wrestling with a difficult problem and not giving up builds a steel-like fighting spirit. This mental strength helps you stay calm during drawdowns and stick to your trading plan.
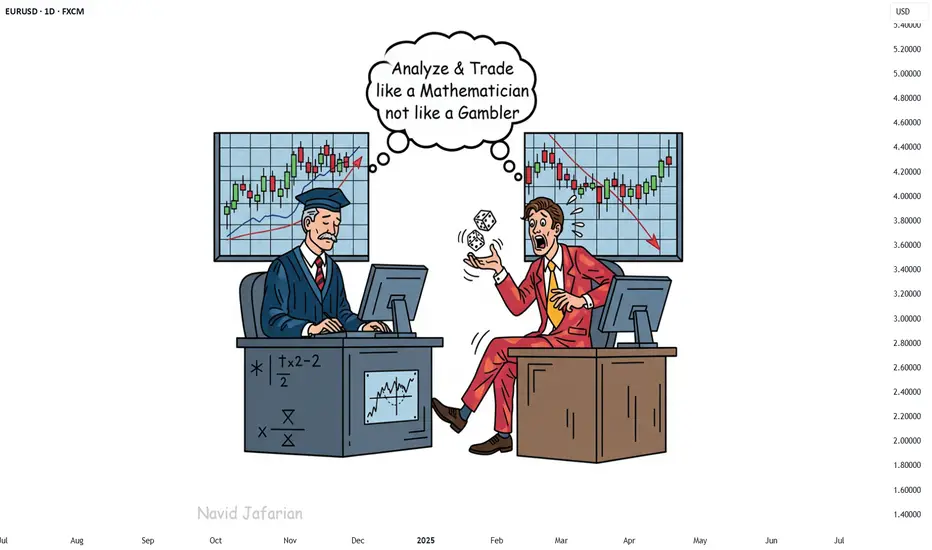
"Analyze with the precision of a mathematician and trade with the fighting spirit of a mathematician 👨🏻🎓,
not with the excitement of a gambler 🎲. "
Navid Jafarian
Every tip is a step towards becoming a more disciplined trader.
Look forward to the next one! 🌟
Negative Risk/Reward: Hidden Edge or Hidden Danger?It’s a topic that sparks plenty of debate.
👉 Can a negative risk/reward ratio actually be part of a winning strategy?
Here’s our take, split between intraday trading and swing trading:
📉 Intraday Trading
☑️ Pros:
• Can work in high‑probability setups (mean‑reversion, range scalps)
• Quick targets often get hit before stops
• Stops can sit beyond liquidity grabs to protect the trade
⚠️ Cons:
• Needs a consistently high win rate
• Prone to slippage and fast spikes
• Can lead to over‑trading if discipline slips
If used, risk must always be pre‑defined — not adjusted mid‑trade.
⏳ Swing Trading
☑️ Pros:
• Occasionally helps avoid being stopped on deeper pullbacks
• Gives breathing room in trending markets
⚠️ Cons:
• Smaller targets vs bigger stops rarely pay off over time
• Lower win rate on higher timeframes makes it hard to sustain
• Exposed to news gaps & weekend risk
Overall, swing trading works best with positive R/R setups (e.g., 2:1 or higher).
☑️ Summary:
Negative R/R can work — but only if:
• The setup is statistically proven & high probability
• You keep risk strictly pre‑defined
• It fits the pair, timeframe & volatility
Most traders are better off sticking to positive R/R — but for experienced scalpers, negative R/R can be a tool rather than a trap.
💭 Do you use negative risk/reward in your strategy?
Only intraday, or do you apply it to swing trades too?
Drop your thoughts below —we're curious to hear how others approach it! 👇
Thanks again for the likes, boosts, and follows — really appreciate the support!
Trade safe and all the best for the week ahead!
BluetonaFX

Mastering Risk Management: The Trader’s Real EdgeYou’ve all heard it,
“Cut your losses and let your winners run.”
Simple words — but living by them is what separates survivors from blown accounts.
Here’s some tips on how to approach risk management when trading:
☑️ Risk is always predefined: Before I click Buy or Sell, I know exactly how much I’m willing to lose. If you don’t define risk upfront, the market will do it for you.
☑️ Position sizing: Never risk more than 1–2% of your account per trade. Small losses mean you can keep taking high‑probability setups without fear.
☑️ Always use a stop‑loss: No stop? You’re not trading — you’re gambling.
☑️ Stop‑loss discipline: Place stops where the market proves you wrong — not where it “feels comfortable.” Then leave them alone.
☑️ Focus on risk/reward, not win rate: A 40% win rate can still be profitable if your average reward outweighs your risk.
☑️ Risk/reward ratio: Only take trades with at least a 2:1 or 3:1 potential. You don’t need to win every trade — your winners should pay for your losers (and more).
Remember:
“It’s not about being right all the time. It’s about not losing big when you’re wrong.”
Risk management won’t make your trades perfect — but it will keep you trading tomorrow.
And in this game, staying in the game is everything.
💭 How do you handle risk in your trading? Drop your strategy or tip in the comments — let’s share and learn together! 👇
Thanks again for all the likes/boosts, we appreciate the support!
All the best for a good week ahead. Trade safe.
BluetonaFX

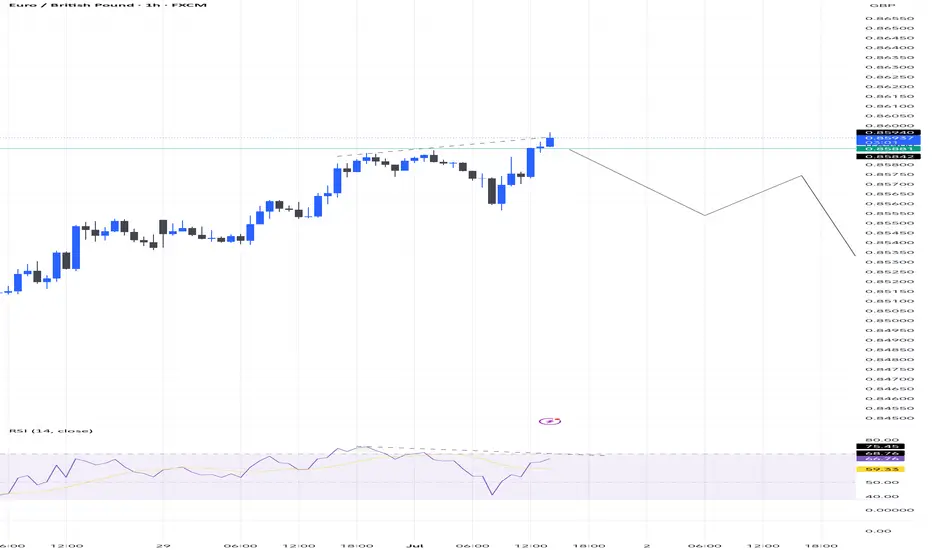
EURGBP short trade Idea with divergence 💶 EURGBP SHORT SETUP – Clean Supply Rejection 📉🔥
Looking at a fresh opportunity to short EURGBP based on recent price action and structure:
🔹 Market Context:
Price recently pushed into a key supply zone or resistance around 0.84800–0.85000.
Multiple rejections spotted at that level – suggesting weak bullish momentum and engineered liquidity.
🔹 Setup Bias: Bearish
We’re anticipating a short-term correction or continuation to the downside, targeting recent demand zones or imbalances.
🔹 Trade Setup (Example):
Entry: ~0.84800
Stop Loss: ~0.85100 (above supply wick)
Take Profit: ~0.84100 (demand/imbalance fill area)
Risk to Reward: ~1:3 potential
🔹 Confluences:
Rejection candle at supply
Divergence
Price broke structure (BOS) to the downside earlier
Overbought signals (if using RSI/Stoch)
Clean imbalance zone below
📊 Execution Tip:
Wait for confirmation (M15 bearish engulfing / lower high break) to avoid early entries.
Risk and Probability in Trading — Why Risk Assessment MattersRisk and Probability in Trading — Why Risk Assessment Matters More Than Chasing the “Holy Grail”
In trading, most participants and analysts are focused on finding the so-called “Holy Grail” — the perfect entry point where the price moves in the desired direction and yields profit. However, few actually assess the risks involved, as if success is possible without factoring them in. Market reviews are often filled with levels, forecasts, and price directions, but rarely include probability estimates or potential losses.
In my view, the real Holy Grail isn't a guaranteed profitable entry, but a scenario where the market offers a position with minimal risk relative to historical context. To identify such setups, we need a risk scale based on historical data — how favorable the current risk-to-reward ratio is compared to the past.
It’s also crucial to understand that no one can predict price direction with certainty. The key to opening a position is not hope, but evaluating all possible scenarios — upward, downward, or sideways — and knowing the outcome in each case. Risk management is more than just placing a stop-loss; it’s a structured approach that should be central to any trading strategy.
What Are Minimal Risks?
“Minimal risk” is a relative concept — it only makes sense when measured against a defined scale. Building such a scale requires historical statistics: what were the maximum and minimum losses and profits for similar positions in the past?
Profit-to-Loss Ratio
The idea behind the search for the “Holy Grail” is to find moments when the market offers the best possible profit-to-risk ratio. For example, if the current ratio is 10, and historically it has ranged from 0 (low risk) to 100 (high risk), then 10 may be a good entry point. If the ratio approaches 80–90, it signals that the position is extremely risky.
Why Are Probability and Risk Assessment Important?
Market reviews often talk about resistance levels, volatility, and price direction — but rarely address the risks of different scenarios. No expert can predict market movements with certainty — if they could, they’d be billionaires. Opening positions without accounting for risks and scenario probabilities is extremely dangerous.
How to Factor in Risks When Entering a Position
The key question is: what will the profit-to-loss ratio be after entering a position, depending on whether the price goes up, down, or stays flat? It’s important to understand the consequences of each case and make decisions based on risk assessment.
Risk Management Must Account for the Inability to React Instantly
Conventional tools like stop-losses and limit orders often fail to protect capital effectively during sudden price spikes. These tools are particularly vulnerable when market makers or high-frequency algorithms trigger stop levels en masse.
This highlights the need for more resilient risk management instruments — ones that can respond to volatility instantly and automatically. Options are one such tool, capable of limiting losses regardless of market dynamics.
Without robust risk management, long-term profitability becomes statistically unlikely. Sooner or later, the market will present a scenario that can wipe out your capital — unless you’re properly protected.
Important note: this is not an endorsement of options or any specific broker. It’s simply a conclusion based on the logic of building effective capital protection. If a broker only provides access to linear instruments (futures, spot, stocks) without the ability to hedge, it will inevitably lead to capital erosion — even for systematic traders.
And if this article gets more than 100 rockets, I’ll continue sharing specific examples of low-risk trading assessments.

-0.5% Week | A Tough Reminder: Risk Management is EverythingFirst trade hit 2R , exited early due to the bank holiday.
Next day, I gave it all back. 3 stop-losses. Poor risk management .
I got overconfident after being in profit and paid the price.
Also realized mobile tools (like SL placement on TradingView app) can hurt if not set up right.
Last week was +6% with strict risk rules.
This week? A reminder that trading is 90% mindset and discipline.
Lessons:
• Protect your capital, always.
• Don’t loosen your rules after a win.
• Your edge only works if you follow your plan.
Stay disciplined. Survive the noise. Let your edge play out.

Rising Geopolitical Tension (Iran Conflict) Signals Market RiskMoving Partially to Cash (VEA, QQQ, TQQQ, SPY, TECL, SOXL)
The global market is entering a high-risk environment. Geopolitical escalation, particularly the growing threat of direct US involvement in a military conflict with Iran, is pushing global uncertainty to new highs. Tensions in the Middle East, rising oil and gold volatility, and increased friction between major world powers all point toward a potential market breakdown. On the chart, VEA ETF is showing signs of topping out within a rising wedge pattern. Meanwhile, institutional funds are starting to reduce exposure to high-risk assets. I'm taking partial profits and shifting to cash across VEA, QQQ, TQQQ, SPY, SOXL, and TECL to preserve gains. Buy-back zones are set around 53.00, 48.00, and 44.00. In an environment of global escalation and rapid risk-off sentiment, active portfolio defense is more important than passive hope.

XAUUSD - Risk Management - How much % do you risk daily?⭐It’s not about how much you know. It’s about how much you risk.⭐
The lesson you only learn after blowing up your account.
You’ve read hundreds of articles, watched countless hours of YouTube.
Joined 5 groups.Subscribed to 10 channels.
Maybe you even tried a prop firm challenge and failed it in two days.
Paid for mentorship.
Kinda know structure. See price action.
And yet… your account still shrinks faster than your patience.
Because at the end of the day:
It’s not about what you know. It’s about how much you risk.
⚠️ The trade was right. Your lot size wasn’t.
You had a good setup.
Price reached your zone. There was confluence.
Everything looked clean — until your lot size showed up to ruin everything.
Example: You entered with 0.50 lots on a $200 account, using a 40-pip stop loss.
Let’s break it down:
• $0.50 per pip × 40 pips = $200 loss
• You lost 100% of your account on a single trade
The strategy didn’t fail.
The size did.
💡 Why “risking 1%” works on paper — but not on XAUUSD
Every trading book, coach, and Twitter guru screams:
“Just risk 1-3% per trade.”
Cool. Sounds disciplined.
But in Gold, most traders use tight stop losses — 20, 30, maybe 50 pips.
To stay within 1% risk with such a small SL, your lot has to be bigger.
And that’s where accounts explode.
Gold doesn’t move like EURUSD.
It spikes, wicks, manipulates, and throws fakeouts for fun.
Experienced traders know that sometimes a 150–180 pip SL isn’t weak — it’s smart.
It’s not about “being wrong.” It’s about giving the setup room to breathe.
📌 What actually works
Instead of risking 1-3%, many experienced traders manage risk more conservatively:
• 0.25%–0.35% per trade is more sustainable
• 0.50% is rarely reserved for highly valid, high-confluence setups only
This allows for:
• More breathing room
• Emotional control
• Less panic during drawdown
• And more trades that survive manipulation
🧠 Your position size is your psychology, exposed.
Most traders don’t lose because they picked the wrong zone.
They lose because they sized their trade like they were trying to get rich overnight.
You want to measure discipline?
Forget strategy.
Look at how much someone risks per trade.
A 0.10 lot on a $500 account means control.
A 1.00 lot on the same account means desperation or showoff.
🧮 A quick example to make it real
You have a $1,000 account.
You risk 0.20% — that’s $2/pip.
Your stop loss is 50 pips.
That means you can trade 0.10 lot safely.
Now you’re giving the trade room to work — and if it fails, you’re still in the game.
That’s the difference between blowing up and showing up.
📉 Bonus risk reminder: Daily exposure ≠ per-trade risk
If you’re taking 2–3 trades per day, don’t risk 0.30% on each one. That’s not low risk — that’s stacking exposure. ✅ What you should do: Decide your daily risk limit (let’s say 0.30%), then split it across your planned entries. 2 trades? → 0.15% each 3 trades? → 0.10% each
🎯 Final thoughts
Your setup doesn’t need to be perfect.
You do.
→ Risk according to volatility, not emotion
→ Respect your stop loss, and scale your lot size to match
→ Don’t try to force profits out of every candle
The best traders aren’t always right —
they just size smart enough to be wrong and still come back.
If this lesson helped you today and brought you more clarity:
Drop a 🚀 and follow us✅ for more published ideas.

TradeCityPro | LINKUSDT Chart Primed for a Big Move! 👋 Welcome to TradeCityPro Channel!
Let’s dive into analyzing one of the market’s most popular coins, LINK, which continues to hold its key supports in higher timeframes and is poised for strong moves during a market uptrend.
🌐 Overview Bitcoin
Before starting the analysis, I want to remind you again that we moved the Bitcoin analysis section from the analysis section to a separate analysis at your request, so that we can discuss the status of Bitcoin in more detail every day and analyze its charts and dominances together.
This is the general analysis of Bitcoin dominance, which we promised you in the analysis to analyze separately and analyze it for you in longer time frames.
📊 Weekly Timeframe
On the weekly timeframe, LINK has been one of the cryptocurrencies that remained in a range for 500 days. After breaking out, we have seen the beginning of an uptrend.
This is exactly what I mean by avoiding capital lock-up. We waited weeks for the 8.06 trigger to break, allowing us to buy with momentum confirmation rather than buying inside the range and waiting in a high-risk market.
You might say, "Why not buy inside the range to avoid missing the 8.06 breakout?" My answer is that hundreds of coins are still stuck in similar ranges without showing any bullish moves, and even now, they could trap your capital for a long time, causing frustration!
Currently, we can say that after a price rejection at 18.10, we’ve pulled back, and if selling volume increases, we’ll go to test the 9.06 level, but if we form a higher low, we’ve created a good trigger for a buy!
📈 Daily Timeframe
On the daily timeframe, LINK is one of the few cryptocurrencies that, after recent corrections, did not return to lower levels. Instead, it bounced off the 0.382 Fibonacci level, increasing the bullish bias.
After breaking 12.96, LINK had a strong rally up to 29.07, where resistance was observed.
Instead of considering 29.07 as resistance, I prefer to buy after a breakout of 26, as this level was previously a pullback zone and had multiple rejections.
On the daily timeframe, we’ve also been rejected from a strong resistance, which further emphasizes the importance of this daily resistance, and it’s better to say that as long as we’re above the 11.99 support level, the 17.45 resistance will be the best trigger for a spot buy and our entry!
📝 Final Thoughts
Stay calm, trade wisely, and let's capture the market's best opportunities!
This analysis reflects our opinions and is not financial advice.
Share your thoughts in the comments, and don’t forget to share this analysis with your friends! ❤️

TradeCityPro | Comprehensive Bitcoin Analysis for 2025👋 Welcome to TradeCityPro Channel!
Let's go for the most complete BINANCE:BTCUSDT Bitcoin analysis you can see. In this analysis, we are going to examine the data from monthly to weekly to daily time frames and more in the most complete way possible!
🌐 Monthly Timeframe
In the monthly timeframe, as you can see, Bitcoin is positioned between two curved trendlines and has reacted to these zones multiple times.
The last time the price hit the bottom of this channel, it recorded a low of 16,000, after which the crypto bull run began. The top of this channel also coincided with the 69,000 peak in the previous bull run, allowing us to identify the end of that bull run.
One key point about this channel is that the slope of its trendlines is decreasing, and overall, a weakening trend in Bitcoin is observed, which is logical. This is because every time Bitcoin has made an upward leg, a massive amount of capital has flowed into it, so it naturally moves less in the subsequent leg.
This point might seem negative to newer market participants, as Bitcoin’s bull runs used to happen faster in the past, and the price moved more significantly in percentage terms. For example, the 2017 bull run saw Bitcoin grow by nearly 7,000%, while in the 2019 bull run, it grew by about 1,500%.
However, within this seemingly negative point, there’s a positive aspect: this reduction in volatility indicates Bitcoin’s maturity and that of the broader crypto market. When an asset has a large amount of capital invested in it, its volatility naturally decreases, but this also reduces the risk of investing in that asset.
For instance, gold currently holds the top spot globally with a market cap of 21 trillion dollars, while Bitcoin’s market cap is around 2 trillion dollars. This gap makes Bitcoin appear as a better investment choice at first glance, as its lower market cap suggests greater growth potential.
On the other hand, the risk of investing in Bitcoin is higher because it has less capital invested in it, and large institutions like governments prefer to invest in gold, earning lower returns over time compared to Bitcoin. For these institutions, the most important factor is risk optimization, and gold has proven itself as the lowest-risk asset over centuries.
So, overall, we can conclude that the more capital flows into Bitcoin, the lower its volatility becomes. As volatility decreases, it becomes a safer asset for investment, attracting more interest from large institutions.
Additionally, we should consider that if Bitcoin isn’t destroyed or proven to be a scam, it could become a safe-haven asset like gold in the future. Its supply is well-optimized, and due to the halving mechanism, its issuance is tightly controlled, which gives it an inherently bullish nature like gold.
Note that when I say Bitcoin’s movements are slowing down and more capital inflow reduces its volatility, I don’t mean it will stop moving upward. Rather, it means its cycles will take longer, and its movements will be heavier. For example, gold, despite its high market cap, still moved upward last year.
Currently, Bitcoin has started a new upward leg after rising from the 16,000 zone. It first reached the previous high, then, after reacting to the 0.5 Fibonacci Extension level (which overlapped with the 71,000 zone), it pulled back to the 57,000 zone and has now moved to the 0.618 level near 101,000.
Based on the candles formed in the monthly timeframe, it seems the upward movement is ongoing. If the 0.618 level is broken, the price could see a few more bullish candles. The next Fibonacci level is 0.786, near 165,000, and if the price movement extends a bit longer, this level could also overlap with the top of the curved channel.
In my opinion, the maximum potential for Bitcoin in this bullish cycle is between 160,000 and 180,000. However, keep in mind that this is just my personal view, and I’m not making decisions based solely on this analysis or planning to sell if Bitcoin reaches this range. This is merely a mental target, and if I see Bitcoin reaching this range with strong bullish momentum, there’s a chance it could break through.
In that scenario, if Bitcoin reaches this range without any trend weakness and with high momentum, I’ll update the analysis for you and examine higher targets Bitcoin could reach.
On the other hand, if I see Bitcoin’s momentum weakening and showing trend deterioration before reaching the resistance zone, I’ll adjust my perspective. If the trend reversal triggers I’ll discuss later are activated, I’ll exit the market.
In the RSI oscillator, we have very important zones that can help us assess the trend’s health. A ceiling at 77.65 has formed, which, if reached by RSI, could indicate a momentum-based market top. However, if this level is broken, the bullish scenario I mentioned is highly likely to occur, and the price could move beyond our expected target.
On the other hand, there’s a support floor at 58.90, and I believe the confirmation of the end of Bitcoin’s bull run will come with a break of this level in RSI. If RSI consolidates below this zone, bullish momentum will weaken, and the price will gradually enter a corrective phase.
Regarding volume, I should note that the decreasing volume in this timeframe isn’t reliable data because Bitcoin’s volume is spread across various exchanges, and comparing volume at this scale isn’t accurate or useful.
I have nothing more to say about the monthly timeframe. Let’s move to lower timeframes.
📊 Weekly Timeframe
Let’s dive into the weekly timeframe, where we can observe price movements in greater detail.
As you can see, after being supported at the 16,000 zone, Bitcoin faced a significant resistance at 31,000. Breaking this level kicked off the bullish trend. In the first leg, the price moved from 16,000 to 31,000, and after breaking 31,000 in the second leg, the upward move continued to 72,000.
One of the main reasons for this bullish cycle was the U.S. interest rate. Simultaneously with the breakout of the 31,000 zone, the U.S. Federal Reserve changed its policies and began lowering interest rates. This triggered a massive capital inflow into Bitcoin, initiating its bullish move.
During the corrective phase, the price oscillated between the 72,000 and 55,000 zones for several months. After breaking the 72,000 ceiling, another bullish leg took the price to 105,000.
One of the reasons for this bullish move was Trump’s strong support for crypto during the U.S. election. He frequently mentioned Bitcoin positively in his speeches and considered it part of his policies.
However, after Trump was elected president, he didn’t fully deliver on his promises. The imposition of tariffs not only impacted Bitcoin but also significantly affected the U.S. dollar, major company stocks, and indices like the S&P. As a result, Bitcoin dropped back to near the 72,000 zone.
Additionally, for the past few months, the U.S. Federal Reserve has not changed interest rates due to these tariffs. In all its statements, it has indicated that it’s waiting for the tariffs to be finalized and is in no rush to make decisions regarding monetary policy. Thus, in recent months, the interest rate variable has been effectively neutral, with the most significant fundamental news being the U.S. tariffs against China and Europe.
After Bitcoin’s drop to near 72,000, news of a 90-day agreement between China and the U.S. emerged, stating that tariffs would be lifted for 90 days to allow negotiations. This news was enough to restart the bullish move for Bitcoin and stocks like the S&P. As you can see, Bitcoin has now surpassed the 105,000 ceiling and is currently deciding its next move above this zone.
Looking at RSI, there’s a key support level at 44.75, where every time the price has hit this level, a new bullish leg has started. This level accurately indicated the 55,000 and 72,000 bottoms and has been very reliable.
However, there’s a clear divergence in RSI between the 72,000 and 105,000 peaks. The current peak above 105,000 is higher, but RSI is still forming lower highs, which could strengthen the divergence.
Currently, RSI is near the overbought zone and appears to be rejecting from the 70 level. If RSI is rejected from this zone, the price might fake out the 105,000 breakout and drop below it. If this happens, it would signal a significant trend weakness, greatly increasing the likelihood of a trend reversal.
However, if RSI consolidates above the 70 level and the price makes another bullish leg, we’ll still have divergence, but the trend weakness will be much less severe than in the fake-out scenario. If the price makes another bullish leg, our targets based on Fibonacci are the 130,000 and 160,000 zones.
In any case, if RSI forms a lower high compared to its previous peak and the price enters a corrective phase, I believe the 44.75 level will break, activating the divergence. If this happens, we’ll get a momentum-based confirmation of the bull run’s end, and we’ll then need to wait for a price-based confirmation.
Currently, the price confirmation for a trend reversal would first be a fake-out of the 105,000 breakout, with the main trigger being a break of the 72,000 level. If the price forms a higher high, we’ll need to wait and identify the trend reversal trigger based on market structure and conditions.
Personally, I believe Bitcoin will have another bullish move to the 130,000 zone, and simultaneously, dominance will move upward again. After this move, as Bitcoin consolidates or corrects, dominance will drop, leading to an altcoin season for a few months. After Bitcoin’s consolidation and the end of the altcoin season, the market’s bearish phase will begin, which I’ll discuss further if it occurs.
If you’ve bought Bitcoin at lower levels and are holding, I think you can continue holding, as there’s a high chance of another bullish leg, and we don’t yet have any confirmation of a trend reversal. I suggest continuing to hold until we get a clear reversal signal.
For buying Bitcoin on the spot market in this timeframe, it’s not possible to provide a trigger right now, as we’re at the end of a bullish leg, and the upward trend from 16,000 has been very prolonged. I believe we’ll see at most one more bullish leg, so if you’re skilled at trading, I suggest using this capital to open positions in futures to maximize profits.
Be cautious—I’m saying this only if you have trading skills, not to blindly open positions with all your capital without a trigger. That would only lead to losses.
If you haven’t bought any Bitcoin in this bullish trend yet, you can wait for the potential altcoin season. I suggest starting now to identify good projects so that when Bitcoin dominance shows bearish confirmation, you can buy the altcoins you’ve researched and profit from that market phase.
📈 Daily Timeframe
In the daily timeframe, as you can see, Bitcoin underwent a corrective phase, dropping to the 76,000 zone. After forming a base at this level, a bullish leg to 106,000 was triggered at 87,700.
Currently, the price is above the 106,000 zone but hasn’t consolidated above it yet. The reason I say it hasn’t consolidated is that market volume is decreasing after the breakout. Additionally, when the price breaks through a supply zone like an all-time high, significant momentum is required, but that hasn’t happened, and the price is ranging above this zone without significant movement.
If Bitcoin consolidates above this zone, the bullish move could continue. The targets we can consider are the 116,000 and 130,000 zones.
The RSI oscillator has a critical support at 59.78, which is a very important momentum level. If this level is broken, this bullish leg could end, and the market might enter a corrective phase. Volume is also slightly decreasing and showing some divergence with the trend, which is another sign of trend weakness.
If the price consolidates below 106,000, we’ll get confirmation of a fake-out of this breakout, and the price could move downward again. The lower support zones are 102,600 and 92,300.
If the price forms a lower high and low below 106,000, we can confirm a trend reversal. Breaking the 76,000 level would be the main confirmation of a trend change.
💼 4-Hour Timeframe
In the 4-hour timeframe, Bitcoin entered a corrective phase after reaching the 111,700 zone and has formed a descending triangle between the 106,000–107,000 range and a downward trendline.
The 106,000–107,000 range is a very strong support zone, and the price has tested this level multiple times but keeps forming lower highs compared to 111,700, increasing the likelihood of breaking this support zone.
On RSI, there’s a support level at 35.94, which is a very strong momentum zone. Breaking this level could confirm the entry of bearish momentum, increasing the likelihood of breaking the support zone.
With a break of the support zone and the 35.94 level in RSI, we can enter a short position. If the price forms a lower high and low below this support zone, we can confirm a trend reversal. The next key support zones are 101,600 and 93,700.
For the bullish trend to continue, breaking the downward trendline would confirm an upward move. If the trendline is broken, the price could rise to 111,700. Breaking the 111,700 level would be the main confirmation of the bullish trend’s continuation, activating the trendline breakout as the primary trigger.
🔍 Binance Open Interest is Surging as BTC Regains Bullish Momentum
Tracking what’s happening in the derivatives market has become essential, given the current market structure.
Derivatives volumes are significantly higher than those on spot markets or ETFs, especially on Binance, which ranks just behind the Chicago Mercantile Exchange in terms of volume.
As a result, derivatives activity can have a major impact on Bitcoin’s price, making on-chain data related to derivatives extremely valuable to monitor.
This has clearly been the case since BTC resumed its bullish trend, reflected in the rising Open Interest on Binance. It jumped from $7.5B on April 8th to over $11.2B today. We can also note that the 30-day and 50-day SMAs have just crossed back above the 100-day average. Derivatives activity has clearly helped fuel the price move, even though many short positions were opened along the way.
Seeing Open Interest climb is generally a good sign, as it gives the market momentum and can lead to strong upward moves. However, this kind of push tends to be fragile.
At the moment, we haven’t yet returned to a new Open Interest ATH on Binance, which may suggest that we’re not in a full-blown euphoric phase on derivatives markets just yet.
📊 Minimal Sell Pressure Despite STH & LTH Deposits on Binance
Keeping an eye on STH (Short-Term Holders) and LTH (Long-Term Holders) behavior gives us valuable clues about market sentiment.
In this update, we’re focusing on Bitcoin inflows to Binance from both STHs and LTHs. These flows help us measure selling pressure and get a feel for how price action might unfold.
Let’s start with STHs the group that tends to react quickly and emotionally to market shifts.
🧠 We’ve seen their behavior play out clearly in the past:
During the August 2024 correction, they sent over 12,000 BTC to Binance.
Then again, around late February to early March, during the tariff news-driven panic that pushed BTC below $80K, they dumped over 14,000 BTC.
But here’s the good news: right now, STH inflows are still moderate only about 8,000 BTC has been sent to Binance so far, which is roughly in line with the last correction.
🔍 As for LTHs, the numbers are even calmer.
Currently, just 86 BTC has flowed in from long-term holders—far lower than the 254 BTC seen before the last major top and way below the 626 BTC peak back in 2024.
📊 Bottom line?
Whether we’re looking at STHs or LTHs, there’s no real sign of strong selling pressure at the moment. Still, it’s worth watching in the context of ongoing demand—which remains relatively healthy for now.
Coinbase Premium Signals Strong Institutional Demand
There’s no doubt institutions are stepping in and no, it’s not just because of ETFs.
💡 Why not ETFs?
Because spot Bitcoin ETFs aren’t exclusive to institutions. Retail investors can access them just as easily, and in terms of raw volume, ETFs still don’t come close to the spot or futures markets.
That said, the inflows are still impressive: the 30-day average daily inflow is now over $330 million, and that trend is holding strong.
🚀 The Real Signal? The Coinbase Premium Gap
This metric tracks the price difference between Coinbase Pro (favored by U.S. professional/institutional investors) and Binance. Right now, the 30-day moving average of the premium gap is 55 a clear sign of heightened U.S. investor activity, which strongly points to institutional participation.
💰 Futures Activity Surges as Spot Demand Fades on Binance
Futures volume on Binance has been rising, while spot volume has dropped significantly in recent days even as Bitcoin broke into price discovery. This shift in volume composition is worth watching closely, as it provides important clues about the market’s internal strength.
Volume isn’t just a number—it reflects the type of demand driving the market. When demand comes from spot markets, it often suggests long-term conviction. In contrast, demand driven by futures markets tends to reflect short-term speculation, which can introduce instability.
Since May 5, we’ve seen futures activity increase modestly, while spot volumes have clearly declined. This suggests that the current price action may be fueled more by leverage and short-term bets than by solid, long-term buying.
Without strong spot support, trends powered by derivatives are more fragile and prone to sharp reversals. This environment calls for increased caution, especially for those considering new entries or leveraged positions.
⚡️ BTC Gains Bullish Momentum as Binance Open Interest Rises
Tracking what’s happening in the derivatives market has become essential, given the current market structure.
Derivatives volumes are significantly higher than those on spot markets or ETFs, especially on Binance, which ranks just behind the Chicago Mercantile Exchange in terms of volume.
As a result, derivatives activity can have a major impact on Bitcoin’s price, making on-chain data related to derivatives extremely valuable to monitor.
This has clearly been the case since BTC resumed its bullish trend, reflected in the rising Open Interest on Binance. It jumped from $7.5B on April 8th to over $11.2B today. We can also note that the 30-day and 50-day SMAs have just crossed back above the 100-day average. Derivatives activity has clearly helped fuel the price move, even though many short positions were opened along the way.
Seeing Open Interest climb is generally a good sign, as it gives the market momentum and can lead to strong upward moves. However, this kind of push tends to be fragile.
At the moment, we haven’t yet returned to a new Open Interest ATH on Binance, which may suggest that we’re not in a full-blown euphoric phase on derivatives markets just yet.
🔄 Bitcoin Heatmap Analysis
Let’s move on to the Bitcoin heatmap analysis, which was missing from this analysis and completes the most comprehensive data for these days. I hope it’s useful for you.
In the 6-month timeframe, Bitcoin has had a good upward trend but experienced a rejection after hitting orders in the 110,000–113,000 range. It’s currently in the 104,000 zone, with the most important support zone at 92,000, which is likely to hold.
In the monthly timeframe, we’ve broken through the 106,000 zone, which was a strong support level based on orders, but there isn’t a strong support zone immediately below. The next support level is 100,000–102,000, which could be a solid level, while the 110,000–112,000 zone is currently the most valid resistance level for Bitcoin.
In the weekly timeframe, a similar event has occurred. We’ve been rejected from the significant 110,000 resistance zone and are heading for further downside, but at a slow pace. In this timeframe, no specific support orders have been registered yet, and it will take some time for traders to place their buy orders on exchanges. However, even if we bounce from this level, we shouldn’t underestimate the 110,000 resistance.
📝 Final Thoughts
This is the most comprehensive Bitcoin analysis for the community.
We’ve done our best to collect the data comprehensively in this post for your awareness and present it to you in this analysis, hoping it has been useful for you!
Our team has worked on this analysis for several days, so we’d be thrilled if you boost, comment, and share the analysis with your friends.

How to Use Stop Losses in TradingViewThis video covers stop loss orders, explaining what they are, why traders use them, and how to set them up in TradingView.
Disclaimer:
There is a substantial risk of loss in futures trading. Past performance is not indicative of future results. Please trade only with risk capital. We are not responsible for any third-party links, comments, or content shared on TradingView. Any opinions, links, or messages posted by users on TradingView do not represent our views or recommendations. Please exercise your own judgment and due diligence when engaging with any external content or user commentary.
The placement of contingent orders by you or broker, or trading advisor, such as a "stop-loss" or "stop-limit" order, will not necessarily limit your losses to the intended amounts, since market conditions may make it impossible to execute such orders.

The Biggest Turning Point Isn’t in the Market — It’s in YouHard truth:
No new strategy, indicator, or tool will work until you change how you operate.
Here’s why:
Strategy hopping is fear wearing a costume.
If you keep switching tools after every loss, you’re not refining — you’re running.
You don’t need more — you need fewer, better decisions.
Simplifying your process is harder than adding new ideas. But that’s where edge lives.
Belief is the multiplier.
Without conviction, you’ll quit before any system has time to work.
🚀 The shift?
For us, it was trusting what we built — TrendGo.
When we finally stopped tweaking and started trusting the system, everything changed: our mindset, our consistency, our results.
The best tool is worthless if you don’t believe in your process.
🧠 Start there.

TradeCityPro | ADAUSDT Is It Time to Buy Cardano?👋 Welcome to TradeCityPro Channel!
Let’s dive in and analyze one of the market’s favorite coins, Cardano (ADA), which is in a strong position compared to most altcoins and is holding at higher resistance levels.
🌐 Overview Bitcoin
Before starting the analysis, I want to remind you again that we moved the Bitcoin analysis section from the analysis section to a separate analysis at your request, so that we can discuss the status of Bitcoin in more detail every day and analyze its charts and dominances together.
This is the general analysis of Bitcoin dominance, which we promised you in the analysis to analyze separately and analyze it for you in longer time frames.
Bitcoin Chart
📊 Weekly Timeframe
On the weekly time frame, ADA, like SOL, SUI, XRP, and most of the top ten coins in the market, is still in a better situation, with the price fluctuating at higher levels.
After being rejected at 1.1983 and losing support at 0.7959, we experienced a sharp drop to 0.50, driven by panic in the market due to Trump and U.S. tariffs on other countries.
Currently, in the weekly time frame, we’re still at higher levels compared to most of the market, and we can expect a strong move going forward. It’s worth noting that breaking 1.1988 will provide the best trigger for a buy.
📈 Daily Timeframe
Interesting things are happening on the daily time frame, and we’re clearly still at higher levels than other altcoins. If the market itself undergoes a trend change, we can be ready for a long trigger sooner.
After breaking 0.8204 and losing the 0.236 Fibonacci level, we experienced a sharp decline that also saw high volume. I expected that after this volume, we’d transition from volatility to forming a range box, and that’s exactly what’s happening. We’re forming a box between 0.6777 and 0.8204, but if today’s daily candle closes as it is, the downtrend will continue!
Additionally, after this event, we had a break of the support floor that turned out to be a fakeout, leading us to establish a new support level. Currently, our most important support is 0.6090, and we’re moving along a daily trendline. If we bounce from this trendline and break the 0.8419 resistance, it will be the best trigger for a buy. On the other hand, if the support breaks and we lose the 0.7417 low, we can go for a short position.
📝 Final Thoughts
Stay calm, trade wisely, and let's capture the market's best opportunities!
This analysis reflects our opinions and is not financial advice.
Share your thoughts in the comments, and don’t forget to share this analysis with your friends! ❤️

TradeCityPro | CFXUSDT A Wild Week of Volatility Ahead?👋 Welcome to TradeCityPro Channel!
Let’s dive in and analyze another altcoin in the market, CFX, which is likely to experience a highly volatile week ahead, offering great trading opportunities.
🌐 Overview Bitcoin
Before starting the analysis, I want to remind you again that we moved the Bitcoin analysis section from the analysis section to a separate analysis at your request, so that we can discuss the status of Bitcoin in more detail every day and analyze its charts and dominances together.
This is the general analysis of Bitcoin dominance, which we promised you in the analysis to analyze separately and analyze it for you in longer time frames.
🕒 Weekly Time Frame
CFX stands out as an older coin with prior bull-run experience. It’s trading above last year’s lows and hasn’t experienced steep declines.
Yesterday, we analyzed this coin briefly, but today, we’ll go into more detail. Unlike most altcoins that began their bullish moves from their lowest levels, CFX has already started its upward trajectory from 0.1219.
Fibonacci analysis shows that 0.1219 aligns with the 50% retracement level—a significant support both in Fibonacci terms and Dow Theory. After forming a range around this level and breaking the 0.1810 trigger, the coin moved toward its first target at 0.2596.
However, we were rejected at 0.2596 and even lost the critical support at 0.1087, dropping to the next support at 0.0647. Currently, it appears we’re pulling back to the key 0.1087 level.
📊 Daily Time Frame
On the daily chart, CFX was in a ranging box, forming higher lows. A breakout above 0.1851 was accompanied by a strong entry candle with buyer momentum, an RSI entry signal, and volume confirmation. Stop-loss was set at the daily low of 0.14.
If you followed this trigger, you’re likely in profit despite the current red daily candle. This correction is healthy, as an uptrend without pullbacks or red candles is often unsustainable.
After breaking the daily box between 0.1046 and 0.1230 and losing its support with an engulfing candle, we experienced a downward move to 0.0647. From there, sellers effectively exited the market, and buyers showed strength. After breaking 0.0823, we formed higher highs and lows. Now, after breaking 0.1046, we can consider buying for spot, with the main trigger being a break of 0.1230.
✍️ Final Thoughts
Stay level headed, trade with precision, and let’s capitalize on the market’s top opportunities!
This is our analysis, not financial advice always do your own research.
What do you think? Share your ideas below and pass this along to friends! ❤️

TradeCityPro | BCHUSDT Bitcoin Fork Ready to Hit New Highs?👋 Welcome to TradeCityPro Channel!
Let’s dive in and analyze the Bitcoin fork, BCH, to understand why this altcoin is performing much better than the broader market and is being supported at higher levels.
🌐 Overview Bitcoin
Before starting the analysis, I want to remind you again that we moved the Bitcoin analysis section from the analysis section to a separate analysis at your request, so that we can discuss the status of Bitcoin in more detail every day and analyze its charts and dominances together.
This is the general analysis of Bitcoin dominance, which we promised you in the analysis to analyze separately and analyze it for you in longer time frames.
📊 Weekly Time Frame
In the weekly time frame, we see that BCH is in a much better position compared to other altcoins and continues to form higher highs and higher lows!
After hitting the 707 resistance and getting rejected, we’ve been ranging in a large box. However, it’s fair to say that buyers have the upper hand in this box because, after touching the critical 268 support, we engulfed the previous three weekly candles and experienced a sharp move up to 424.
Currently, we’re at a critical point: we could either form a lower high relative to the previous resistance or undergo a mid-term correction and re-enter after breaking 424!
📉 Daily Time Frame
In the daily time frame, the situation is similarly favorable, and BCH is continuing its trend with good momentum. The formation of higher highs and higher lows provides a sense of calm to the uptrend.
After the heavy decline in February, it was natural for us to enter a ranging period before forming a new structure. This happened, and after retesting the 268 support, we started forming higher highs and lows, with our first entry at the 345 level.
Currently, after a rejection from 435, we’ve corrected to 386, which was a low-volume move, technically considered a pullback. If we see a supportive candle at this level, it’s a trigger for a buy, and breaking 435 will be the next trigger!
✍️ Final Thoughts
Stay level headed, trade with precision, and let’s capitalize on the market’s top opportunities!
This is our analysis, not financial advice always do your own research.
What do you think? Share your ideas below and pass this along to friends! ❤️

TradeCityPro | INJUSDT Best Position Among Altcoins! 👋 Welcome to TradeCityPro Channel!
Let’s dive in and analyze one of my favorite coins in the cryptocurrency space, INJ, which is showing strong potential. We’ll check the new entry triggers together.
🌐 Overview Bitcoin
Before starting the analysis, I want to remind you again that we moved the Bitcoin analysis section from the analysis section to a separate analysis at your request, so that we can discuss the status of Bitcoin in more detail every day and analyze its charts and dominances together.
This is the general analysis of Bitcoin dominance, which we promised you in the analysis to analyze separately and analyze it for you in longer time frames.
📊 Weekly Time Frame
On the weekly time frame, I see that the seventh period is stable, INJ, and compared to the majority of altcoins that have their own low price levels, it is in a better space and is engaged in its own supports!
After breaking the primary trend ceiling, namely 9.28, we experienced a sharp upward movement and formed a historical ceiling at $53, and after forming a distribution box and breaking the important floor of 16.20 and pulling back to it, we experienced a continued decline.
Currently, we’ve bounced from the key support at 6.54 and experienced a 90% move, which highlights the importance of this resistance. If we form a higher low above 6.54, the 13.54 trigger will be excellent for a spot buy, and I’ll personally add another buy position at that level.
📉 Daily Time Frame
On the daily time frame, our trend is completely bearish as you can see, and the events are completely accompanied by the formation of a downward bottom and top, but we are likely to suffer for a while.
After getting rejected from 34.16 and forming a box between 20.16 and 25.93 and losing the bottom, it made a move and then while pulling back with low volume and the next conversion to red, it became an inverted Sharpe, we experienced a decline!
After breaking the daily trendline and activating its trigger at 8.54, we saw a move and got stuck at the 10.32 resistance. After forming a higher low, we moved up to 13.76. Currently, the 13.76 trigger, and even better, 16.25, can serve as our futures long and spot long triggers, respectively. We’re still holding the position opened at 10.32.
✍️ Final Thoughts
Stay level headed, trade with precision, and let’s capitalize on the market’s top opportunities!
This is our analysis, not financial advice always do your own research.
What do you think? Share your ideas below and pass this along to friends! ❤️
