TradeCityPro | MNTUSDT Effects of Bybit Hack👋 Welcome to the TradeCityPro channel!
Let's analyze and examine the main chain mantle coin and examine the effects of the Bybit hack last month
🌐 Overview Bitcoin
Before starting the analysis, I want to remind you again that we moved the Bitcoin analysis section from the analysis section to a separate analysis at your request, so that we can discuss the status of Bitcoin in more detail every day and analyze its charts and dominances together.
This is the general analysis of Bitcoin dominance, which we promised you in the analysis to analyze separately and analyze it for you in longer time frames.
📊 Weekly Timeframe
On the weekly time frame, this coin was in good condition and was near its new high and could even break this resistance level well!
But the continuous events of the crypto market caused a deep correction of 50% of this chart, from Trump's tariffs to the Bybit hack, and since the MNT coin was one of the main Bybit holding coins, it caused its recent fall.
In this timeframe, we made our purchase for DeFi at the level of 0.6577 and now it is only a little in profit, although we took out some with the weekly engulfing candle, but I will continue to hold and if we lose 0.5457, I will exit completely.
📈 Daily Timeframe
In the daily timeframe, after the daily box between 0.5457 and 0.6622 broke and momentum entered, we started our move and reached a very important resistance level of 1.3947 and after that we recorded a lower ceiling.
After breaking the important bottom of 0.9311, the exit trigger It was our spot that became active and after pulling back to it, we experienced a continued decline and now we are back to important support which was previously the ceiling of our ascending box and is an important level for us!
It is not a good time to buy again right now and we need to form a new structure, but the fact that we have a weak downtrend can be a good sign in itself, but we still need to create new space for now. For selling, I will wait and cash out my coins below 0.5457 and say goodbye to this coin without bias :))
📝 Final Thoughts
Stay calm, trade wisely, and let's capture the market's best opportunities!
This analysis reflects our opinions and is not financial advice.
Share your thoughts in the comments, and don’t forget to share this analysis with your friends! ❤️
Riskmangement

TradeCityPro Academy | Dow Theory Part 3👋 Welcome to TradeCityPro Channel!
Welcome to the Educational Content Section of Our Channel Technical Analysis Training
We aim to produce educational content in playlist format that will teach you technical analysis from A to Z. We will cover topics such as risk and capital management, Dow Theory, support and resistance, trends, market cycles, and more. These lessons are based on our experiences and the book The Handbook of Technical Analysis.
🎨 What is Technical Analysis?
Technical Analysis (TA) is a method used to predict price movements in financial markets by analyzing past data, especially price and trading volume. This approach is based on the idea that historical price patterns tend to repeat and can help traders identify profitable opportunities.
🔹 Why is Technical Analysis Important?
Technical analysis helps traders and investors predict future price movements based on past price action. Its importance comes from several key benefits:
Faster Decision-Making: No need to analyze financial reports or complex news—just focus on price patterns and trading volume.
Better Risk Management: Tools like support & resistance, indicators, and chart patterns help traders find the best entry and exit points.
Applicable to All Markets: Technical analysis can be used in Forex, stocks, cryptocurrencies, commodities, and even real estate.
In the previous session, we explained Principles 3 and 4 of the Dow Theory. Be sure to review and study them, and if you have any questions, let us know in the comments.
📑 Principles of Dow Theory
1 - The Averages Discount Everything (Not applicable to crypto)
2 - The Market Has Three Trends
3 - Trends Have Three Phases
4 - Trend Continues Until a Reversal is Confirmed
5 - The Averages Must Confirm Each Other
6 - Volume Confirms the Trend
📈 Principle 5: Trends Persist Until a Clear Reversal Signal Appears
Full Explanation:
Dow Theory says that once a market picks a direction—like going up (bullish trend) or down (bearish trend)—it keeps moving that way until something big and obvious says, “Nope, we’re turning around!” Think of it like momentum: the market’s lazy and sticks to its path unless it gets a solid reason to switch.
What’s a Trend? It’s the market’s overall direction. Uptrend means higher highs and higher lows (prices keep climbing). Downtrend means lower highs and lower lows (prices keep dropping). Sideways means it’s stuck in a range.
What’s a Reversal Signal? In an uptrend, if prices stop making new highs and start forming lower highs and lows, plus break a key level (like support), that’s a sign the trend’s flipping. In a downtrend, it’s the opposite—higher highs and lows plus breaking resistance mean it’s turning up.
Why Does This Happen? Markets reflect crowd behavior. When everyone’s buying or selling, the trend builds steam and doesn’t stop until the crowd’s mood shifts big-time.
Key Point: Small dips or spikes don’t count. A little drop in an uptrend? Normal. You need a clear pattern or a big break to call it a reversal.
Practical Use: Traders use this to avoid panic-selling on tiny moves and wait for strong signals before jumping ship.
Simple Example:
It’s like riding a bike downhill—you keep rolling fast until you hit a wall or slam the brakes.
📊 Principle 6: Trends Must Be Confirmed by Volume
Full Explanation:
This principle says a trend isn’t legit unless trading volume backs it up. Volume is how much is being bought or sold. If the trend’s real, volume should match it—high volume means lots of people are in on it, low volume means it might be fake or weak.
Uptrend: Prices rising with growing volume? That’s a strong bull run—buyers are all in. Prices up but volume’s tiny? Could be a fluke or manipulation.
Downtrend: Prices falling with big volume? Sellers mean business—bear trend’s solid. Falling prices with low volume? Might just be a quick dip, not a real crash.
How Volume Confirms: It’s like a lie detector for trends. Big volume says, “This move’s for real!” Low volume says, “Eh, don’t trust it yet.”
Extra Detail: In an uptrend, if volume starts dropping, it’s a warning—buyers might be losing steam. In a downtrend, low volume could mean sellers are running out of ammo, hinting at a bounce.
Why It Matters? Dow believed volume shows the market’s true energy. No crowd, no power—simple as that.
Practical Use: Traders check tools like OBV (On-Balance Volume) or volume bars. If a stock jumps but volume’s dead, they might skip it it’s a trap.
Simple Example:
It’s like a party if tons of people show up dancing, it’s a real vibe. If just two guys are there, it’s probably lame.
🎉 Conclusion
We’ve reached the end of today’s educational segment! We’ll start by explaining all of Dow Theory’s principles, and in the future, we’ll move on to chart analysis and the strategy I personally use for trading with Dow Theory. So, make sure you fully grasp these concepts first so we can progress together in this learning journey!
💡 Final Thoughts for Today
This is the end of this part, and I must say we have a long journey ahead. We will continually strive to produce better content every day, steering clear of sensationalized content that promises unrealistic profits, and instead, focusing on the proper learning path of technical analysis.
⚠️ Please remember that these lessons represent our personal view of the market and should not be considered financial advice for investment.

TradeCityPro | Bitcoin Daily Analysis #31Welcome to TradeCity Pro!
Let's move on to Bitcoin analysis and important crypto indicators. In this analysis, as usual, I want to review the triggers of the New York Futures Session for you.
1-hour time frame
In the 1-hour time frame, after the price reached 77598, the fall ended and we witnessed an upward correction to the 83281 area.
The 83281 area has become a very important resistance and the price is reacting well to it. A reverse head & shoulder pattern is visible on the chart that has not yet been activated, and with the failure of the 77598 area, we will confirm the activation of this pattern.
If 77598 is broken, the price can move at least to the 83281 area. The next resistances are also within reach of the price, and if strong momentum enters the market, the price can register higher targets.
The buying volume in the market is much less than the selling volume, and the sellers' power is still greater than the buyers'. However, if the 83281 area is broken, this volume can be more in favor of the buyers and the price can move up.
For a short position, if the price rejects the 83281 area or if the failure of this resistance is faked, you can enter a short position with the trigger 81466 to the target 77598.
I have no more talk about Bitcoin, let's move on to the analysis of the indicators so that we can also check the conditions of the altcoins.
BTC.D Analysis
Let's move on to the analysis of Bitcoin Dominance, Dominance has finally stabilized above the 61.61 area and reached the 62.19 area. If this area is broken, Dominance can start its new upward leg.
If Dominance rejects this important ceiling, Dominance's downward leg can continue to 61.61. Dominance's main support is currently 61.08.
Total2 Analysis
Let's move on to Total2 analysis, as you can see, this indicator is at a lower level and has not yet reached the ceiling in the 1.04 area and has recorded its new resistance in the 1.01 area.
The reason for this is Bitcoin's dominance, which has become bullish and more money has entered Bitcoin than altcoins. However, if Dominance breaks 1.01, you can enter a position if Dominance falls.
For short, the first trigger is 984 and the main trigger is 953.
USDT.D Analysis
Let's move on to the Tether Dominance analysis, as you can see, Dominance has broken the trend line it had and is now ready to fall. If it breaks 5.30, you can get confirmation of Tether's Dominance falling.
To confirm Dominance's bullishness, we can get confirmation if it breaks 5.49, which means the market can fall and if these triggers overlap with the Total2 trigger, you can find an altcoin and open a position.
📝 Final Thoughts
Stay calm, trade wisely, and let's capture the market's best opportunities!
This analysis reflects our opinions and is not financial advice.
Share your thoughts in the comments, and don’t forget to share this analysis with your friends! ❤️

TradeCityPro | HBARUSDT Better Condition Than the Market!👋 Welcome to the TradeCityPro channel!
Let's go together and examine one of the popular coins in the market that has experienced less correction recently and is in better condition than other altcoins!
🌐 Overview Bitcoin
Before starting the analysis, I want to remind you again that we moved the Bitcoin analysis section from the analysis section to a separate analysis at your request, so that we can discuss the status of Bitcoin in more detail every day and analyze its charts and dominances together.
This is the general analysis of Bitcoin dominance, which we promised you in the analysis to analyze separately and analyze it for you in longer time frames.
📊 Weekly Timeframe
We go to the weekly time frame and see that hbar's condition is much better than other altcoins, and this is precisely due to the entry of momentum and Bitcoin's bullishness!
After we broke through the support at 0.04339 and engulfed the previous weekly candle, it was a bullish sign, and after the trigger at 0.06219 was activated, we broke this resistance and momentum entered this coin!
If you made your purchase in the spot section from this level, the situation is okay for now, but you can save profit or withdraw the principal capital. If you want to re-enter, you can make your purchase after the 0.33056 break.
📈 Daily Timeframe
In the daily time frame, we have higher levels and a better situation than the rest of the coins, and in a situation where most altcoins are forming lower bottoms, this has not even lost its main level.
After the 0.06470 and daily box break, we experienced a movement of about 500%, and if we draw a Fibonacci, we are currently at the 0.382 level, and this in itself increases the importance of this level! If the 0.37350 ceiling is broken, it shows us that we are going to experience a new movement!
This daily candle can be a good trigger to buy again, and the reason is that we are rising from a good support level and it is also a good Fibonacci level, but this trigger is risky and after the break of 0.26486 it will be a better trigger to welcome, and for a temporary exit, you can also temporarily exit with a break of 0.18653.
📝 Final Thoughts
Stay calm, trade wisely, and let's capture the market's best opportunities!
This analysis reflects our opinions and is not financial advice.
Share your thoughts in the comments, and don’t forget to share this analysis with your friends! ❤️

TradeCityPro | APTUSDT Market Drop on Trump News?👋 Welcome to the TradeCityPro channel!
Let's analyze and review one of the popular tier-2 coins together and take a look at this recent Trump news regarding the economic record
🌐 Overview Bitcoin
Before starting the analysis, I want to remind you again that we moved the Bitcoin analysis section from the analysis section to a separate analysis at your request, so that we can discuss the status of Bitcoin in more detail every day and analyze its charts and dominances together.
This is the general analysis of Bitcoin dominance, which we promised you in the analysis to analyze separately and analyze it for you in longer time frames.
📊 Weekly Timeframe
APT remains inside its large, volatile range, frequently bouncing between its highs and lows. However, this time, it has formed a lower high, which is not a positive sign.
Additionally, after breaking $7.78, sellers completely engulfed the weekly candle, and for the past five weeks, all candles have been red with high selling volume, confirming the downtrend.
There is no buy trigger at the moment, and I cannot recommend a buying opportunity until the market forms a new structure.
For selling, if APT drops below $4.97, it makes sense to exit and accept the loss instead of holding onto a losing position.
📈 Daily Timeframe
On the daily timeframe, APT failed to break the $14.61 resistance. Even worse, it couldn't even reach the previous high before getting rejected earlier, signaling weakness.
After breaking below $8.46, the market entered an MWC (Market Weakness Confirmation) downtrend.
Following the breakdown, a pullback retest occurred, and the daily candle engulfed the previous two days' candles, leading to further decline. Currently, APT is at $5.70, with RSI in the oversold zone, suggesting a possible short-term slowdown in selling pressure.
I personally feel that APT’s drop is sufficient for now, and we might enter a range here before a final move toward the $4.95 support. However, this does not mean it’s a buy signal. We need to wait for a new market structure before considering spot entries.
In the current situation, the market is really not very analytical and Bitcoin is likely to hit the $72,000-$74,000 level and then go for a break or bullishness, and you should pay attention to these market times! Don’t be FOMO!
📝 Final Thoughts
Stay calm, trade wisely, and let's capture the market's best opportunities!
This analysis reflects our opinions and is not financial advice.
Share your thoughts in the comments, and don’t forget to share this analysis with your friends! ❤️

TradeCityPro | FILUSDT Continuing the Analysis of U.S. Coins👋 Welcome to TradeCityPro Channel!
Let’s analyze another coin with a U.S. base, which has the potential to be listed in ETFs in the future, as the U.S. currently has the most influence on the market!
🌐 Overview Bitcoin
Before starting the analysis, I want to remind you again that we moved the Bitcoin analysis section from the analysis section to a separate analysis at your request, so that we can discuss the status of Bitcoin in more detail every day and analyze its charts and dominances together.
This is the general analysis of Bitcoin dominance, which we promised you in the analysis to analyze separately and analyze it for you in longer time frames.
📊 Weekly Timeframe
We are still within the weekly box, and the coin’s situation is not very favorable, as it is currently fluctuating around its most important support level.
After failing to reach the top of the weekly box and facing an early rejection, the market has experienced a decline in recent price corrections. Currently, the price is fluctuating around 3.139, which is the most crucial support level at the moment.
From a price perspective, this is a good buying zone, but since the market is highly bearish, I personally wouldn't buy without confirmation. I'd prefer to let the price range a bit and form a structure, or wait for a strong green candle. Otherwise, my buy trigger would be a breakout above 9.899.
📈 Daily Timeframe
The main trend is still bearish, meaning we continue forming lower highs and lower lows. Currently, the price is ranging between 2.995 and 3.753.
After a rejection from 8.051, the price formed a support level at 4.836. However, after breaking this support and retesting it (which has now turned into resistance), the price engulfed the previous three candles, leading to a drop to 2.995.
If the price breaks above 3.573, the Fibonacci levels that we have drawn will act as strong resistance zones for further upward movement. The most important of these levels is 4.836, which previously caused a significant rejection.
For buying, the more the price ranges within the 2.995 - 3.573 box, the stronger the 3.573 breakout trigger will be. For selling, I recommend exiting below 2.995. If the price moves back above 3.573, you can reinvest with the same USDT amount, but in a smaller quantity of FIL, to manage your risk.
📝 Final Thoughts
Stay calm, trade wisely, and let's capture the market's best opportunities!
This analysis reflects our opinions and is not financial advice.
Share your thoughts in the comments, and don’t forget to share this analysis with your friends!

TradeCityPro Academy | Dow Theory Part 2👋 Welcome to TradeCityPro Channel!
Welcome to the Educational Content Section of Our Channel Technical Analysis Training
We aim to produce educational content in playlist format that will teach you technical analysis from A to Z. We will cover topics such as risk and capital management, Dow Theory, support and resistance, trends, market cycles, and more. These lessons are based on our experiences and the book The Handbook of Technical Analysis.
🎨 What is Technical Analysis?
Technical Analysis (TA) is a method used to predict price movements in financial markets by analyzing past data, especially price and trading volume. This approach is based on the idea that historical price patterns tend to repeat and can help traders identify profitable opportunities.
🔹 Why is Technical Analysis Important?
Technical analysis helps traders and investors predict future price movements based on past price action. Its importance comes from several key benefits:
Faster Decision-Making: No need to analyze financial reports or complex news—just focus on price patterns and trading volume.
Better Risk Management: Tools like support & resistance, indicators, and chart patterns help traders find the best entry and exit points.
Applicable to All Markets: Technical analysis can be used in Forex, stocks, cryptocurrencies, commodities, and even real estate.
📚 Recap of the Previous Session
In the previous session, we explained the first two principles of Dow Theory. Make sure to review and study them, and if you have any questions, feel free to reach out to us in the comments.
📑 Principles of Dow Theory
1 - The Averages Discount Everything (Not applicable to crypto)
2 - The Market Has Three Trends
3 - Trends Have Three Phases
4 - Trend Continues Until a Reversal is Confirmed
5 - The Averages Must Confirm Each Other
6 - Volume Confirms the Trend
🌟 Principle 3: Trends Have Three Phases
In Dow Theory, the primary trend (which can be a Bull Market or Bear Market) is divided into three distinct phases. These phases reflect market behavior and investor psychology over time. Here’s a detailed explanation:
📉 Accumulation Phase
Definition: This phase begins when the market is at its lowest point (in a bull trend after a bear market) or when general pessimism prevails. Smart investors, professionals, and those with a long-term vision (like large funds or experienced traders) start buying.
Characteristics:
Prices are still low, and economic news is typically negative (e.g., recession, high unemployment).
Trading volume is low because the general public lacks confidence and doesn’t participate.
Price changes are small and gradual, making the market seem "lifeless" or directionless.
Psychology: This phase marks a transition from despair to hope. Smart investors recognize that the worst is over and that the real value of assets exceeds their current price.
Example: Imagine after a major crash like 2008, some big companies stabilize their prices, but the media still talks about "collapse." Professionals step in here. Or with Bitcoin at $16K, most people thought it was heading to zero and were hopeless!
📈 Public Participation Phase
Definition: This phase occurs when the primary trend is clearly established, and the market starts moving more strongly. Economic news improves, and the general public (retail investors) enters the market.
Characteristics:
Prices rise quickly (in a bull market) or fall sharply (in a bear market).
Trading volume increases significantly as participation grows.
Analysts and media begin confirming the trend with positive reports.
Psychology: Confidence in the market grows, and greed (in a bull market) or fear (in a bear market) gradually takes over. This is where market momentum accelerates.
Example: In a bull market, you might see indices like the Dow Jones hitting new records weekly, with ordinary people buying tech or industrial stocks.
💰 Distribution Phase
Definition: This is the end of the primary trend. In a bull market, smart investors who bought during accumulation start selling to take profits. In a bear market, panic selling subsides, and some buy in hopes of a recovery.
Characteristics:
Prices may still be high, but volatility increases, and signs of weakness emerge.
Trading volume might remain high, but discrepancies between volume and price (e.g., price drops with high volume) appear.
News is still positive, but professionals know the market is overvalued.
Psychology: In a bull market, excessive optimism (Euphoria) dominates; in a bear market, complete despair sets in. This is where the trend reverses.
Example: At the peak of the dot-com bubble (2000), tech stocks kept rising, but professionals began exiting, and then the crash followed.
Key Note: These three phases occur in sequence, and understanding them helps analysts identify the market’s position in the larger cycle. In a bear market, the phases reverse: panic selling (like distribution), temporary recovery (like participation), and final capitulation (like accumulation).
🔍 Principle 4: The Averages Must Confirm Each Other
Charles Dow believed that for a primary trend to be confirmed, two key market indices—the Dow Jones Industrial Average (DJIA) and the Dow Jones Transportation Average (DJTA)—must move in the same direction. This principle stems from economic and logical significance in Dow’s time and is still considered a key metric. Here’s the full explanation:
📊 Economic Logic:
Industry and Transportation: In Dow’s era (late 19th and early 20th centuries), the U.S. economy relied heavily on industrial production and transportation (e.g., railroads). If industrial companies (producers of goods) were growing, demand for transportation (moving goods) should also rise.
Thus, aligned movement in these indices signaled a healthy economy.
Mutual Confirmation: If only one average rises (e.g., industrials go up but transportation doesn’t), Dow saw it as a sign of weakness or an unsustainable trend.
🤑 Practical Application:
Bullish Trend: In a bull market, both averages should reach new highs (Higher Highs). If the DJIA hits a new record but the DJTA fails to confirm and stays lower, the uptrend is questionable.
Bearish Trend: In a bear market, both should hit new lows (Lower Lows). Lack of confirmation (e.g., industrials fall but transportation doesn’t) might signal the end of the downtrend.
Divergence: If the averages diverge (one rises while the other doesn’t), Dow viewed it as a warning of a potential trend change.
⚖️ Technical Details:
Timing: Confirmation doesn’t need to be simultaneous but should occur within a reasonable timeframe (e.g., weeks or months).
Volume: Though not directly mentioned in this principle, handbooks emphasize that high volume during confirmation adds credibility to the trend.
Classic Example: In 1929, the industrial average began falling, but transportation initially resisted. When transportation also dropped, the bearish trend was confirmed, leading to the Great Depression.
🎉 Conclusion
We’ve reached the end of today’s educational segment! We’ll start by explaining all of Dow Theory’s principles, and in the future, we’ll move on to chart analysis and the strategy I personally use for trading with Dow Theory. So, make sure you fully grasp these concepts first so we can progress together in this learning journey!
💡 Final Thoughts for Today
This is the end of this part, and I must say we have a long journey ahead. We will continually strive to produce better content every day, steering clear of sensationalized content that promises unrealistic profits, and instead, focusing on the proper learning path of technical analysis.
⚠️ Please remember that these lessons represent our personal view of the market and should not be considered financial advice for investment.

TradeCityPro | SUIUSDT Is the best time to buy ?👋 Welcome to TradeCityPro Channel!
Let's analyze and review one of the most popular coins in the market, sui, and update our previous analysis and find new triggers
🌐 Bitcoin Overview
Before starting today's altcoin analysis, let's look at Bitcoin on the 1-hour timeframe. Since yesterday, Bitcoin experienced a correction, which was necessary for the market, and it pulled back to the 102135 range. The next trigger for a long position will be a breakout above 104714.
Yesterday's correction, coupled with an increase in Bitcoin dominance, caused noticeable declines in some altcoins. This highlights the importance of monitoring BTC pairs in your checklist these days.
📊 Weekly Timeframe
In the weekly time frame, it is one of the coins that is in good condition, it is really in the market and is still fluctuating on the high support levels.
After hitting 5.24, we made a new ceiling or ATH, and after that, due to recent market news, we experienced some drops, and this has also caused the price correction of this coin.
For re-buying, if we make a good support candle at this level 2.4, it will be a good trigger and the main trend will start again after we break 5.24. Also, after breaking 1.77, we can temporarily exit this coin and cash out!
📈 Daily Timeframe
In the daily time frame, it has been in relatively good conditions compared to other coins in the market and has experienced fewer declines and still has a lot of support to lose!
After breaking the 1.0333 level, which was our trigger spot, we made our purchase and experienced a move after its failure with the entry of momentum and recorded a new ceiling with this event!
Along with this trend, we can draw our Fibonacci levels, which are currently involved in the important level of 0.382, and after it rises and breaks the ceiling of 5.24, we can experience a powerful move!
If this level is broken, we can also hit the support levels of 1.7702 and 1.3859 and we need to form a structure to buy now, but after breaking the trend line and the 3.65 trigger, it can be a good point! For selling, I will continue to hold for now!
📝 Final Thoughts
Stay calm, trade wisely, and let's capture the market's best opportunities!
This analysis reflects our opinions and is not financial advice.
Share your thoughts in the comments, and don’t forget to share this analysis with your friends! ❤️

Todays Gold Market Update.Gold Market Analysis:
The gold price is currently trading within a weekly bearish Falling Volume Gap (FVG) pattern. A break below the 50% level of this FVG has occurred, and the market is now testing a critical resistance zone.
Key Levels to Watch:
- Resistance: $2893.500
- Support: $2887.500
- Potential target (bullish): $2900
- Potential target (bearish): $2873
Trading Strategy:
A close above $2893.500 on the 4-hour chart, confirmed by a 4-hour candle close above this level, may indicate a bullish breakout. Conversely, a break below $2887.500, followed by a 4-hour candle close below this level, may confirm a bearish downtrend.
Investors are advised to closely monitor these key levels for trade confirmation and adjust their strategies accordingly.

TradeCityPro | BIGTIMEUSDT Final Downtrend?👋 Welcome to TradeCityPro Channel!
Let's analyze and review the new gaming coin BIGTIME and see what the market is going to be like. I feel like we're going to see the final downtrend.
🌐 Bitcoin Overview
Before starting today's altcoin analysis, let's look at Bitcoin on the 1-hour timeframe. Since yesterday, Bitcoin experienced a correction, which was necessary for the market, and it pulled back to the 102135 range. The next trigger for a long position will be a breakout above 104714.
Yesterday's correction, coupled with an increase in Bitcoin dominance, caused noticeable declines in some altcoins. This highlights the importance of monitoring BTC pairs in your checklist these days.
📊 Weekly Timeframe
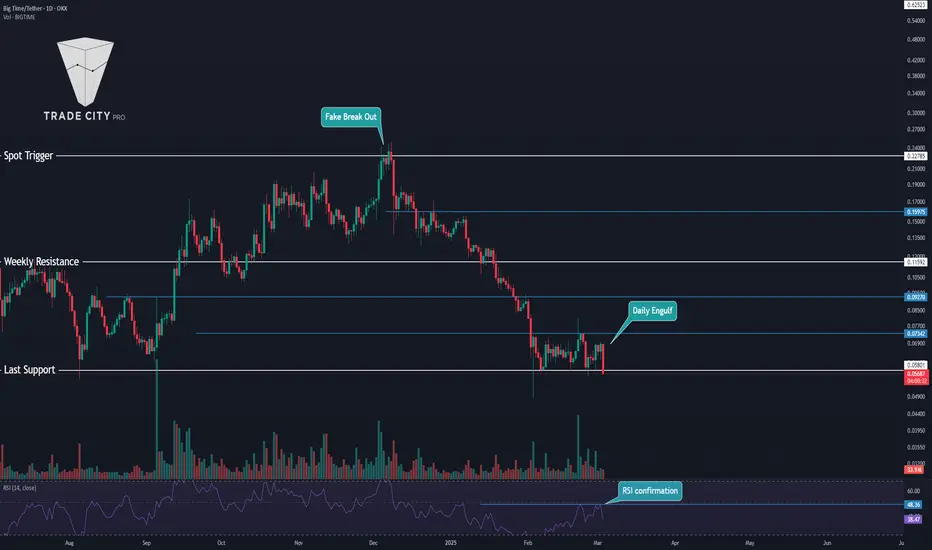
This coin is not in an interesting situation on the weekly time frame and after being rejected from the resistance of 0.22109, it is continuing its downward trend and is recording a lower high and low
If the weekly candle closes like this and we lose the support of 0.06479, the declines will continue and if you are holding this coin, I suggest you exit temporarily and if it enters again, you will simply enter with a smaller number of this coin and your number of Tethers will be preserved
They are not really in good conditions for buying right now, but if the support is faked, we can get a trigger from them, but normally the best trigger is after the failure of 0.22109, but I repeat, the fake of this support can form a new trend!
📈 Daily Timeframe
The situation is the same on the weekly time frame and the probability of a fall is higher than ever, and after the rejection of this important resistance at 0.22785, we have experienced a 75% drop so far!
After this drop, we went into the range box between 0.05801 and 0.07342, and it is natural to suffer a little until our RSI rejected the middle line of 50, which again increased the probability of a fall.
Also, today's daily candle is very important, and if it closes like this, we are engulfing a few of our previous candles and the probability of a support floor breakdown is higher than ever, so you can open a short position and exit the spot, and your second entry for the spot breakdown will be 0.09270!
📝 Final Thoughts
Stay calm, trade wisely, and let's capture the market's best opportunities!
This analysis reflects our opinions and is not financial advice.
Share your thoughts in the comments, and don’t forget to share this analysis with your friends!
BTC UPDATE!!BTC Update:
The current Bitcoin price has entered a critical selling pressure zone. To maintain a bullish outlook, a break above the $99.5k-$100k resistance level is necessary.
Failure to do so may result in the formation of lower highs on the daily time frame, potentially leading to another downward move towards the FWB:73K -$72k support zone.
On the weekly time frame, Bitcoin has left a wick downside without closing below it, which is a positive sign. However, the next candle is crucial, and a close above the $99.5k-$100k zone is needed to maintain bullish momentum.
A close below the $90k- GETTEX:89K zone would likely confirm another downward move towards the lower low structure of FWB:73K -$72k.
As indicated by the chart, failure to break above the $99.5k-$100k zone may result in the formation of lower highs, potentially leading to another downward move.
Investors are advised to exercise caution and not be swayed by market noise. The chart is indicating a potential move towards lower lows if the resistance level is not broken.
To manage risk, consider booking short-term profits and implementing stops on the profit side. Always prioritize risk management and adjust positions accordingly.
Key levels to watch:
- Resistance: $99.5k-$100k
- Support: FWB:73K -$72k
- Critical zone: $90k- GETTEX:89K

EUR/USD Technical Analysis: Bearish Momentum with 2.04R ShortEUR/USD Technical Analysis: Bearish Momentum with 2.04R Short Opportunity
Current Market Structure
The EUR/USD is displaying a clear bearish trend across multiple timeframes, with price action showing lower highs and lower lows since late 2024. Analysis of the charts reveals:
Daily timeframe: Sustained downtrend since October 2024, with price currently testing resistance near 1.0380
4-hour timeframe: "Confirmed" bearish alignment with both the 8 EMA and 21 EMA positioned below the 55 EMA
1-hour timeframe: Similar bearish configuration, reinforcing the short bias
EMA System Confirmation
The proprietary EMA System Status indicator demonstrates strong bearish conviction:
240 Signal: Bearish
240 Trend: Bearish
Alignment: Confirmed
This triple confirmation suggests high-probability conditions for short entries.
Key Technical Levels
Support Levels:
1.0300: Psychological round number
1.0230: Recent swing low and profit target
1.0200: Major psychological support
Resistance Levels:
1.0400: Key resistance zone with 200 EMA confluence
1.0430: Stop placement zone above recent swing high
1.0500: Major psychological resistance
Correlation Analysis
Supporting the bearish thesis, the DXY (Dollar Index) shows a complementary bullish structure with:
Confirmed bullish alignment on the 4-hour timeframe
Recent break above the 107.00 resistance level
Bullish momentum in MACD
This inverse correlation adds significant weight to the EUR/USD short setup.
Trade Parameters
Entry Strategy:
Short at 1.03632
Stop Loss at 1.04287 (65.5 pips)
Profit Target at 1.02296 (133.6 pips)
Risk/Reward Ratio: 2.04
Risk Management:
1% account risk allocation
0.5 lot position size
$500 risk per trade (on $50,000 account)
Potential profit: $1,019.85
Technical Confluence Factors
Several factors align to support this trade setup:
Price rejecting at 55 EMA resistance on multiple timeframes
MACD showing bearish momentum and alignment
Weekly and daily session boundaries reinforcing resistance zones
Recent higher timeframe rejection of the 200 EMA
Market Timing Considerations
The European and US economic calendars should be monitored for:
ECB monetary policy statements
Federal Reserve commentary
US dollar-impacting economic data releases
Conclusion
The EUR/USD presents a high-probability short opportunity with a favorable risk-reward ratio of 2.04. All key technical indicators align bearishly across multiple timeframes, with strong correlation confirmation from the DXY. This setup fits the criteria for a "Confirmed" signal within our trading system, meeting our standards for trade execution.
Trade management will follow our established protocol with potential scaling out at interim support levels and trailing stops implemented once price moves beyond the 1:1 risk-reward ratio point.

TradeCityPro | MKRUSDT 70% Move?👋 Welcome to TradeCityPro Channel!
Let's analyze and review one of the best coins in the DAo area together and find another entry point together and update our previous triggers
🌐 Overview Bitcoin
Before starting today's altcoin analysis, let's look at Bitcoin on the 1-hour timeframe. Since yesterday, Bitcoin experienced a correction, which was necessary for the market, and it pulled back to the 102135 range. The next trigger for a long position will be a breakout above 104714.
Yesterday's correction, coupled with an increase in Bitcoin dominance, caused noticeable declines in some altcoins. This highlights the importance of monitoring BTC pairs in your checklist these days.
MakerDAO’s sharp increase in fees and growth in Total Value Locked (TVL) has fueled demand. On February 20, $156.77 million of MKR was burned, reducing supply. Growth in active addresses and trading volume has driven the price higher. Strong resistance at $1,800 may limit further growth. MakerDAO’s emergency offering has raised concerns about $3.1 billion USDC exposure.
📊 Weekly Timeframe
In the weekly timeframe, the token has seen a 95% gain on the coin, which is a good sign in these market conditions!
Also, in this timeframe, we are in an opening triangle, which is characterized by high volatility, and we are constantly moving towards the bottom and top of this triangle, regardless of the ceiling and floor or support and resistance, and the exit from this triangle will also be sharp.
In this timeframe, we did not have a trigger in advance to say that we could buy or anything else, and it moved very sharply. If you lose, it is normal and do not blame yourself and your strategy.
After exiting this triangle and breaking 2.182, we can have a good trigger to buy, and for now, if you bought and held during this fluctuation and are in profit above 50%, it is logical to save profit, but if you did FOMO and bought, it is better not to continue trading and be busy watching the tutorial for now.
📝 Final Thoughts
Stay calm, trade wisely, and let's capture the market's best opportunities!
This analysis reflects our opinions and is not financial advice.
Share your thoughts in the comments, and don’t forget to share this analysis with your friends!

How To Manage Your Risk In Trading?Beginner!
Chasing profits is not the only purpose of smart trading. It is also about managing risk correctly. Every trade comes with uncertainty, and without a solid strategy, even the best opportunities can turn into costly mistakes. That’s where the 3-5-7 Rule comes in.
Think of it as a built-in safety net for your trades, a simple yet powerful guideline that helps you balance risk and reward. By setting clear limits on your exposure per trade, per market, and across your portfolio, the 3-5-7 Rule keeps you in control, protecting your investments from unexpected losses.
In this guide, we’ll break it all down: how the rule works, why it’s effective, and how you can apply it to your own trading strategy. Plus, we’ll walk through real examples to make it practical and easy to follow. By the end, you’ll be trading with more confidence, better discipline, and a clear plan to keep risk in check.
What is the 3 5 7 Rule?
The 3 5 7 rule works on a simple principle: never risk more than 3% of your trading capital on any single trade; limit your overall exposure to 5% of your capital on all open trades combined; and ensure your winning trades are at least 7% more profitable than your losing trades. It’s simple in theory, but success depends on discipline and consistency.
TradeCityPro | LTCUSDT Let's go for spot buying?👋 Welcome to TradeCityPro Channel!
Let's go together to analyze and review Litecoin analysis, one of the oldest coins in the market, and let's go to update the triggers of the previous analysis!
🌐 Overview Bitcoin
Before starting today's altcoin analysis, let's look at Bitcoin on the 1-hour timeframe. Since yesterday, Bitcoin experienced a correction, which was necessary for the market, and it pulled back to the 102135 range. The next trigger for a long position will be a breakout above 104714.
Yesterday's correction, coupled with an increase in Bitcoin dominance, caused noticeable declines in some altcoins. This highlights the importance of monitoring BTC pairs in your checklist these days.
📊 Weekly Timeframe
On the weekly time frame, it is one of the coins that is in a good position compared to the coins and has had the least correction in recent declines and is in this position due to the possibility of ETF approval
There is no need to complicate things in this time frame and after the break of 136.45, we will buy and be above 98.44. This trigger is valid and we do not have much of an exit trigger for the conditions of these days on this chart and for now it is better to continue holding
📈 Daily Timeframe
On the daily time frame, we are also in a good position and we had a good return after the recent market decline due to the Bybit hack and Trump's tariffs and this is a good thing!
After breaking the 75.01 level and exiting the daily box and breaking its ceiling, we moved up to the resistance of 136.45 and are now fluctuating between the 98.44 to 136.45 boxes.
We also had a curve line in this time frame that was a good support for this event and every time we hit it, we made a good move upwards, but after its failure, it can be said that the upward trend moved into the range and went to form a new structure.
To buy spot after the 136.45 trigger is broken, we can buy for spot with a stop loss of 98.44 and as long as we are above 114.38, the 136.45 trigger is very important for us and it shows us more the strength of buyers and in case of a 98.44 break, we will go for 89 and 80 and we will have a price correction.
📝 Final Thoughts
Stay calm, trade wisely, and let's capture the market's best opportunities!
This analysis reflects our opinions and is not financial advice.
Share your thoughts in the comments, and don’t forget to share this analysis with your friends!

CHFJPY POSSIBLE NEXT MOVE!CHFJPY currently break down of traingle and trade and down side of traingle now market will going to retest this traingle resistance and make any candle that show bearish momentum and break thier low so we will see downward market will going.
Remember! The result of your past trades, whether they were winning or losing ones, shouldn’t affect how you handle your next positions.

EUR/JPY – High-Probability Short Setup 1️⃣ Market Overview – Bearish Bias Confirmation
EUR/JPY remains in a strong downtrend, forming lower highs and lower lows. Currently, the price is retracing into a critical Fibonacci resistance zone, making this a prime opportunity to short the pair in line with institutional sentiment and seasonality trends.
2️⃣ Fibonacci Levels – Identifying Key Resistance
The Fibonacci retracement is drawn from the most recent bearish impulse.
Resistance Zone: 0.5 (156.888) to 0.786 (157.107) – a high-probability rejection area.
If price fails to break above this zone, a continuation to the downside is expected.
Prime Seasonality Insights – Historical Data Supports the Short Bias
📊 Seasonality trends over 15 years indicate that EUR/JPY historically declines in late February and early March.
🔻 February seasonality performance: -0.7% average return
🔻 Next 3-5 day forecast: Bearish probabilities (-0.06% to -0.21%)
🔻 Seasonality prediction candles show a short-term retracement, followed by downside continuation.
💡 This aligns with the technical setup, reinforcing a short bias.
4️⃣ Retail Sentiment – Smart Money Edge
🚨 79% of retail traders are LONG on EUR/JPY – a contrarian signal for a short trade.
🔻 Institutions (Smart Money) are aggressively shorting EUR/JPY, as seen in COT data.
🔻 Commitment of Traders (COT) Report shows increased institutional short positioning.
🔻 Retail traders trapped in longs will likely get stopped out, fueling further downside.
5️⃣ Technical Confirmation – Trendline & Indicators
✅ Price is below all major EMAs (6, 24, 72, 288) on the 4-hour chart.
✅ Supertrend remains bearish on the 4-hour timeframe.
✅ A downward sloping trendline aligns with the Fibonacci resistance zone.
💡 I will wait for confirmation (rejection wick, bearish engulfing candle) before entering a short position.
6️⃣ Conclusion – Trade Plan for EUR/JPY
🔹 Bias: Bearish due to downtrend, Fibonacci resistance, seasonality, and institutional short positioning.
🔹 Trade Setup:
Sell EUR/JPY at 156.88 - 157.10 (Upon rejection)
Stop Loss: Above 157.26
Take Profit Targets: 156.30, 156.04, 156.00
🔹 Key Confirmation: Retail traders are trapped in longs, seasonality supports further downside, and institutions are short.
🚀 This is a prime example of how combining Seasonality, Smart Money Positioning, and Technicals can create a powerful trade setup.
📌 What’s your outlook on EUR/JPY? Let’s discuss in the comments!

What Is Accumulation Manipulation Distribution - ICT Power Of 3 Accumulation Manipulation Distribution Helps Retail Traders To Follow The Moves Of "Smart Money" Large Financial Institutions.

TradeCityPro | ENSUSDT Better Status Than Altcoins👋 Welcome to TradeCityPro Channel!
Let's go together with one of the popular layer two coins that works in domain and address naming services for wallets and recently announced that it will launch layer two soon
🌐 Overview Bitcoin
Before starting the analysis, I want to remind you again that we moved the Bitcoin analysis section from the analysis section to a separate analysis at your request, so that we can discuss the status of Bitcoin in more detail every day and analyze its charts and dominances together.
This is the general analysis of Bitcoin dominance, which we promised you in the analysis to analyze separately and analyze it for you in longer time frames.
📊 Weekly Timeframe
On the weekly time frame, ENS is one of the bullish coins in the market that has a good situation ahead and has started its main upward movement before the start of 2025 and in late 2023
After the start of the main movement after the 9.99 break, we started our main upward trend and we can say that we broke our ceiling in terms of market cap and made a new ATH market cap
We are also on a curve line that is bullish and supportive in nature and if this line is broken, it shows us that the main upward trend has weakened and if we go below 15.90, we will see a trend change in MWC
For re-entry, the 47.68 break is an interesting trigger and you can buy again and if the exit trigger is below 15.90, you can exit and for now, I recommend You can't buy in this time frame
📈 Daily Timeframe
In the daily time frame, however, it has held its own more than the rest of the altcoins and is suffering in its daily box between 24.78 and 27.55, which happened after the rejection at 47.68.
Also, in this time frame, we have a trend line that if the price reaches it, we will have the possibility of reacting and we will use it as a tool to save profit in the lower time frame if we react to it.
Also, the rejection candle that closes from this resistance at 27.55 in the same way, we will have the possibility of continuing the downtrend, and if 24.78 is broken, we can move towards 20.81 and 15.90. And for buying, if this support is faked or the 35.98 trigger is activated, I will buy, and in this box, I will only I trade in futures
⏱ 4-Hour Timeframe
In the four-hour time frame, what happened is that we faked the resistance above the box, which increases the probability of breaking the support floor
📉 Short Position Trigger
you can open a position with this four-hour candle as a guide, but on the other hand, it is better to wait for the support to reach 24.79 and the reaction from it and then follow its breakdown
📈 Long Position Trigger
we need to return to the ceiling again for now, and if we return above the support level sooner, we can think more about breaking 27.91 and open a more confident long position
📝 Final Thoughts
Stay calm, trade wisely, and let's capture the market's best opportunities!
This analysis reflects our opinions and is not financial advice.
Share your thoughts in the comments, and don’t forget to share this analysis with your friends!

TradeCityPro | STXUSDT Reached Weekly Support👋 Welcome to TradeCityPro Channel!
Let's go together to analyze and review one of the popular cryptocurrency coins and Bitcoin's second layer and update our triggers
🌐 Overview Bitcoin
Before starting the analysis, I want to remind you again that we moved the Bitcoin analysis section from the analysis section to a separate analysis at your request, so that we can discuss the status of Bitcoin in more detail every day and analyze its charts and dominances together.
This is the general analysis of Bitcoin dominance, which we promised you in the analysis to analyze separately and analyze it for you in longer time frames.
📊 Weekly Timeframe
On the weekly time frame, stx is one of the coins that started its upward trend before the start of 2024, which caused the formation of its ATH and new ceiling
You can also see one of the best weekly trends in this coin, which is that after each time we hit this support trend line, we rose and made a sharper move.
Also, when this trend line was broken, we made a pullback to it and as we had given the weekly exit trigger with a break of 1.299 in the previous analysis, after the break of the trigger of the trend line, we experienced a sharp decline and reached the support level of 0.796 and now we need to form a structure.
📈 Daily Timeframe
On the daily time frame, but after the rejection of the important weekly resistance 2.745 and getting rejected, we started to correct the price and fall until this price correction turned into a trend change in the daily time frame
After forming the lower ceilings and floors, we reached important support and the trigger for the spot exit, which after the daily failure and pullback to that daily candle, engulfed the previous 3 candles and caused further decline, which led to us reaching the important support of 0.859
Currently, after hitting the support of 0.859 twice, our fall volume has not increased much and it can be said that the sellers do not intend to take the price below 0.859 for the time being, and this will cause us to go into the range and form a new structure. However, I will open a short with a failure of 0.859, but there is no buying at the moment.
⏱ 4-Hour Timeframe
We suffered enough in the four-hour time frame and formed a structure and we are in a range box that we can take a position from both sides
📉 Short Position Trigger
For my short position I open a position with a break of 0.859 and accept the stop loss. Since it is an important support, I try to place my stop loss in a logical space and not make it small.
📈 Long Position Trigger
For the long position, we have two triggers, one risky and one somewhat certain. You can open a position with a break of 0.953 and 1.005, respectively. The difference is that with a break of 0.953, the possibility of a stop loss is higher, and with a break of 1.005, the possibility of losing the position is higher. I choose to take the stop loss myself.
📝 Final Thoughts
Stay calm, trade wisely, and let's capture the market's best opportunities!
This analysis reflects our opinions and is not financial advice.
Share your thoughts in the comments, and don’t forget to share this analysis with your friends!

TradeCityPro Academy | Risk to Reward👋 Welcome to TradeCityPro Channel!
Let’s dive into another educational segment. After discussing capital management and risk management, we now turn to one of the most crucial concepts before entering technical analysis: Risk to Reward!
📌 Understanding Risk-to-Reward in Real Life
Before we start, let me give you an example of risk to reward from the real world, outside of financial markets. Imagine you are considering investing in a startup technology company that has launched a new product.
Risk: You estimate that you might lose $500 of your investment due to uncertainty about the product's success and intense market competition.
Reward: However, if the product succeeds and the company grows, you could make a profit of up to $2000.
In this example, the risk-to-reward ratio is 1:4, meaning for every $1 at risk, you could earn $4 in reward. This ratio can help you decide if this investment is appealing. If you believe the risk is acceptable and the potential reward is valuable, you might choose to invest.
⚠️ The Reality of Risk-to-Reward in Trading
In the real world, if you are a logical person, we all adhere to risk to reward principles. However, it’s puzzling how, in financial markets, you often close your profitable trades as quickly as possible while staying in losing trades for months. This indicates a failure to adhere to risk to reward principles.
Before I explain risk management and related concepts, make sure you've viewed the previous sections on risk management and capital management. Remember, if you're not setting stop-loss orders, this lesson might not be very useful for you.
🔍 What is Risk-to-Reward in Trading?
In financial markets, risk to reward refers to the ratio between the level of risk an investor takes with a specific investment and the potential reward from that investment. This concept helps investors evaluate whether a particular investment is worth the risk.
When trading, if you are about to open a position, set a stop-loss. If your stop-loss is triggered, resulting in a $10 loss, your target profit should be at least $20, creating a risk to reward ratio of 2. I won’t open a position with less than this!
It's important to note that risk to reward alone doesn't hold much meaning. It gains significance when considered alongside win rate. The chart I will share clarifies the relationship between win rate and risk to reward.
Look at the chart below. If your risk to reward is 1 and your win rate is 50%, you are breaking even—neither gaining nor losing. For risk to reward ratios below 1, you need a win rate of 100% to break even. Our logical risk to reward ratio is 2, where a 40% win rate keeps you profitable. We should allow our minds room for error rather than always striving for accuracy.
🛠️ Understanding Trading Tools
Let’s take a simple look at our tools. The chart showcases two types of tools: short position and long position, applicable for both falling and rising markets. The tool displays your risk to reward ratio in the middle, with the stop-loss percentage below and the profit percentage above for long positions, and vice versa for short positions.
📈 Why Should You Use a Risk-to-Reward of 2?
Why do you implement a risk to reward of 2? Consider this: if I opened 10 positions this week, with 6 hitting stop-loss and 4 reaching targets, my total loss would be $60. However, due to adhering to a risk to reward ratio of 2, my total profit would be $80, resulting in a net gain of $20!
This illustrates the importance of adhering to risk to reward principles. Even if we lose more trades than we win, we can still be profitable in the end. The key is to focus on the overall outcome rather than individual battles.
❌ What Happens If You Don’t Maintain a Standard Risk-to-Reward?
Now, consider what happens if I don’t maintain a standard risk to reward. For instance, if I open a position with a risk to reward ratio of 0.5, even if I make a profit, a subsequent loss could negate that gain.
If you are involved in financial spaces, you may have encountered signal channels that share their positions, encouraging you to follow for profitable outcomes. For example, if they claim to profit from 95 out of 100 positions, you might feel that winning sensation. But what is their risk to reward ratio? A ratio of 0.1 means that if they hit just a few stop-losses, you could end up in a loss.
Be cautious of misleading advertisements and high-return claims. If you manage to achieve a 5% to 10% profit monthly and sustain it for a year, even starting with $100, your trading record will be respected, leading to more funding opportunities. Avoid falling into traps set by opportunistic individuals.
🚀 Practical Trading Considerations
Consider this: if you want to open a position but your target is above a major resistance level, and the likelihood of reaching it seems slim, I personally prefer not to open that position. It indicates that my entry point may not be optimal.
❤️ Friendly Note
In closing, I encourage you to keep your positions until you reach your risk to reward target. Avoid checking the chart until you hit that point. Set alerts and make decisions only then. Always adhere to these rules for all your positions, not just one. Don’t worry about losing out on profits; instead, approach trading with calmness.
Finally, remember that a profit in a position is not truly realized until it is closed and transformed into something tangible—food, clothing, a house, or a car.

TradeCityPro | ADAUSDT Is the Downtrend Continuing?👋 Welcome to TradeCityPro Channel!
Let's take a look at one of the most popular cryptocurrency coins, review our previous analysis on this coin, and find our triggers!
🌐 Overview Bitcoin
Before starting the analysis, I want to remind you again that we moved the Bitcoin analysis section from the analysis section to a separate analysis at your request, so that we can discuss the status of Bitcoin in more detail every day and analyze its charts and dominances together.
This is the general analysis of Bitcoin dominance, which we promised you in the analysis to analyze separately and analyze it for you in longer time frames.
🕵️♂️ Previous Analysis
In the previous analysis, we had already identified our analytical levels and said that after the break of 0.8360, we would have the possibility of a sharp decline, and that is what happened, and after the decline, we are currently in a pullback to this level!
📊 Weekly Timeframe
On the weekly time frame, ADA, like sol, sui, xrp and most of the top ten coins in the market, is still in a better situation and the price is fluctuating at higher levels
After being rejected at 1.1983 and losing support at 0.7959, we experienced a sharp drop to 0.50, and this was the result of Trump and the US tariffs on other countries and caused panic in the market!
The buy trigger is still above 1.1983, but because it is in a better situation, I will give you a trigger for this coin in lower time frames, but I had said that selling below 0.7959 was a temporary sale and I do not have a trigger to exit at the moment!
📈 Daily Timeframe
But interesting things are happening on the daily time frame and we are still clearly at higher levels than other altcoins and if we have a trend change in the market itself, we can be careful for a long trigger sooner
After breaking 0.8204 and losing the 0.236 Fibonacci level, we experienced a Sharpe decline that also became high and I myself expected that after this volume we would go from volatility to forming a range box and this is also happening and we are forming a box of 0.6777 to 0.8204, but if today's daily candle closes like this, we will continue the downtrend!
The spot purchase trigger if we are in this space more in this box that I have specified for you will be after the break of 0.8204 or the formation of a higher ceiling and floor in this box, but your next exit trigger if you do not exit at 0.8204, if it breaks at 0.6777, it is recommended to exit or at least save profit!
⏱ 4-Hour Timeframe
In the four-hour time frame, the conditions of this coin are such that you can open both short and long positions, and it is one of the coins that you should have on your watchlist for this period and watch!
📈 Long Position Trigger
it is quite clear and after the break of 0.8204, I will open a futures position myself and it will probably be so that I continue to hold it and open it long-term
📉 Short Position Trigger
today's trigger was activated earlier and 0.7681, I opened a low-risk short position myself, but the main trigger after the break will be 0.6806 and try to have a short position before that break
📝 Final Thoughts
Stay calm, trade wisely, and let's capture the market's best opportunities!
This analysis reflects our opinions and is not financial advice.
Share your thoughts in the comments, and don’t forget to share this analysis with your friends! ❤️

Daily Market Outlook: BTC, DXY & Gold – Key Trade Setups (#5)The market still seems indecisive , but I’m here to find the best trade triggers for BTC and Forex. Let’s break it down.
📊 DXY – Breaking Key Support
DXY has entered a corrective phase after breaking below the 107.335 support.
🔹 Key Support Levels:
105.656 (Aligned with the 30% Fibonacci retracement)
103.367 (Aligned with the 60% Fibonacci retracement)
💡 106.602 could act as a short-term support, and if it breaks, it might be time to focus on USD pairs for potential setups.
🟡 XAU/USD (Gold) – Retesting ATH?
Gold rejected its all-time high at 2937.91 and now seems to be retesting this major resistance.
📊 What’s happening?
Gold is still in an uptrend, but momentum is fading.
Smaller bullish candles vs. larger bearish candles indicate possible exhaustion.
A correction could be healthy, but shorting remains risky in an uptrend.
📌 Trade Triggers:
✅ Long Entry: After a confirmed breakout above 2940
❌ Short Entry: Below 2879.74 (High risk due to trend direction)
📉 BTC – 95K Support Breaking?
BTC is attempting to break below the 95K support. If this level is lost, we could see a move toward 92K, 85K, and even 82K.
📌 Strategy:
✅ Short Trigger (Activated): 95245 (Yesterday’s signal)
✅ If You Missed It: Wait for a pullback or a new structure before entering.
Final Thoughts
⚠ This is a highly volatile market – avoid chasing trades and wait for confirmations.
⚠ If you’re not using risk management, these setups may not be suitable for you.
I’m Skeptic , see you tomorrow with another market breakdown! <3
