USDCHF LONG Swing Trade Executed. Price Aiming For 1.03000!Have a look at the attached link below for the full analysis behind this trade setup
ENTRY LEVEL: AT AROUND 1.01300
STOP LOSS: 0.99600
TAKE PROFIT: 1.03000
RR: 1:1
SHALL THERE BE ANY UPDATES I WILL UPDATE THEM IN THIS THREAD. CHEERS
Riskoff

forexTrdr USDCHF - RE SHORT ON RISK OFF AGAINMorning traders,
Similar to our Euro versus Japanese Yen trade we are looking to get short US dollar against Swiss Franc on expectation of a risk off tone into next week from a combination of price action on equity indexes as well as what we have highlighted here on our trading view chart work. A combination of price action and trendlines is coming together to point towards a turn lower on USD versus Swiss Franc.
Another clean and simple trade
Good luck trading
from the Team at forexTrdr
find us on instagram, twitter and Alexa flash briefings

GBP/JPY - Neutral (Risk Off) Downward wedge 4 HR ChartWaiting on Japanese session reaction to GBP pullback. (PatiencePays)
If there is a breakout off the downward wedge (Long position)
Take profit 1: 140.000 (Resistance & just below 50% Fibonacci Retracement)
Take Profit 2: 142.650 (fibonacci Retracement 61%)
Fundamentals affecting decision:
Long Position positive news on trade war negotiations and continuation in reversal of the DOW/S&P 500.
Short position wedge continuation (Risk Off) Safe Haven Currency considering the uncertainty in the market.

GBPJPY - Get Short on Pullbacks!Risk off is definitely the theme today.
Asian stocks and U.S. futures tumbled on Trump’s
Mexico tariff surprise, while reports of Beijing’s plan
to restrict exports of rare earths to the U.S. if needed
added to ongoing trade war angst globally. Data also
showed China’s manufacturing sector slowed more than
expected in May.
JPY crosses have been sold aggressively. Today we
favour only pullbacks in order to get acceptable
risk:reward.

ANALYSIS- RISK OFF SENTIMENT CONTINUESLooking to the US stock markets we can see that the risk off sentiment continues.
Price has recently broken the weekly lows and we should expect this to continue
until the market shows otherwise. We could see this sentiment continue to the lows
of 23560.00. If this happens we could see GOLD and JPY continue to rally. Keep
an eye on the stock markets as they will be key in seeing long term moves.

COTD - 9th April GoldAfter a softer day for the U.S. Dollar yesterday we saw risk-off assets catch a bid, one of those being gold.
Since February highs at 1346.74, we have seen the safe haven asset sell off and make lower highs, which have formed the declining trendline (seen by the black dashed line). However, in recent days with the U.S. Dollar softening, Gold has found some support on the $1280 handle and trade higher.
Looking at the hourly chart at the moment it looks like we are finding some support on the daily pivot level at $1297.61, and we have just pushed through the shorter-term resistance of the previous high that coincides with the daily R1 pivot level at £1303.66 as the U.S. Dollar continues to soften into the afternoon.
Something to be wary of is that of the potential head & shoulders formation that can be seen on the 4-hour or Daily chart for Gold. If we see Gold soften & the U.S. Dollar strengthens alongside the pair failing to push higher through the declining trendline and make a new high, then we could see it break the neckline of the head & shoulders as well as the 1280 support and trade lower.
For the time being this remains purely on the watchlist as we wait for something to catalyse a move out of the safe-haven asset and give us a direction, but we remain primed with both bullish & bearish setups.
FOREXCOM:XAUUSD FX_IDC:XAUUSD OANDA:XAUUSD

Bears holding the highs in USDJPYThe most recent break below 110.5 indicates that this sell-off towards the end of the Fiscal year is looking impulsive in nature. This is a result of combination of flows from Yen repatriation for the FY end and risk-off via Central Bank uncertainty, Brexit and Meuller (now cleared).
Any pullbacks towards 110.2 and 110.5 should be considered corrective and countertrend offering great opportunities on the sell-side. The targets below for shorts come into play at 109.3.
I am actively adding exposure on all pullbacks as mentioned. Best of luck for those joining.

SPX500USD D1Price has made a bearish engulfing off strong resistance at the 2860 region, breaking price back into the range. Will be watching for additional downside if price can find resistance at the 2815 region. More downside would cause "Risk Off" in the forex market leading to a stronger JPY & CHF..

Short USD/JPY via risk=> Here we are isolating the Yen once more and expecting a worsening outlook of US assets to continue which will raise the prospect of asset repatriation out of the US.
Whilst risk may be rebounding temporarily as the FED attempts a dovish shift, and US-China trade tensions are likely to continue de-escalating, USDJPY will still like remain on offer amid broader USD weakness.
Here we also expect the rebound in risk sentiment to be temporary rather than fixed, meaning JPY will see some inflows. If Japanese banks tighten conditions further we will have a greater incentive for real money to reduce their exposure in the US.
The only risk here is if risk on sentiment stays supported and the US macro outlook improves.
For those interested in more details on the "flash crash" please see our previous USDJPY weekly chart!
Good luck and all the best for those invested in the US.

CHFJPY Confined in A Weekly wedge. Awaits breakout Momentum!The blue lines represents the support and resistance levels drawn from the monthly charts. If the price breakouts of the triangle in either direction the support or resistance levels next to them needs to be broken decisively in order for the technical aspects to be in our favour of the trade.
shall there be any updates i will post them in a new thread. this just represents my outlook and analysis on this pair. if the technical aspects of this trade meets, i will post the entry and exit details in a new thread. cheers

Bears (almost) ready to attack again... getting ready to swingAfter the flash crash we have continued to trade within a wide range. An important and very significant point is the recent euro strength after a dovish ECB is corrective following the completion of a large bearish triangle pattern.
Support can be found at 124 and then 123.40. Below here would imply another top is in and add weight to the view that risk is entering back into the room. We are eyeballing a move eventually towards 122.75 which is the 38.2% retracement (not marked on the chart) of this most recent correction.
To the upside, for those who believe in the immediate Euro bull story (not our view) we can see resistance at 124.6 and 125.10. Both of which are necessary to be taken in order to suggest a continuation pattern and imply a deeper recovery.
Summarising, the range 125.10 - 123.40 is crystal clear and we see an opportunity in selling this correction as we believe there is still further downside to come in Europe before bulls come in towards the end of 2019.
Best of luck to all those in positions here.

EUR/JPY Possible Sell Setup
To start the new year off the Eur/Jpy cross confidently broke through well defined horizontal support and an ascending trendline. The pair then moved down to a low of 123.529 the day before the Yen flash crash. After the flash crash the pair put in a timid rebound that has stalled just below previous support turned resistance and consolidated into a tight range between the 50% fib retracement of the June 2016 low to January 2018 high, and the 38.2% retracement of the December 2014 high to June 2016 low. I stated in a previous idea that should the Eur/Jpy pair break through the support mentioned at the start of this post my bias would shift short, and nothing has changed. A break above this range will not prompt a trade as technically the trend appears confidently lower and fundamentally the recent data and sentiment out of Europe has been disappointing. In addition to this a risk off mood seems to be creeping back into the market as trade war concerns continue and global growth slows. With all this in mind there seems to be a definite lop sided risk to the down side in this cross with a defined technical pattern that we can use to take advantage of it with. The attached image shows potential stops and take profits, ideally a break lower occurs, followed by a rebound that enables us to enter our short positions.
*This is not a recommendation to buy or sell, it is for educational purposes only*

GOLD Facing Descending Trendline resistance. Likely to Break ItOh the crucial 1370 level that is preventing the yellow metal from going any further up. already tested more than 8 times in the monthly this barrier remains a concrete resistance for the yellow metal rally. Now looking at this, GOLD is most likely set to accelerate towards that crucial resistance again, but will it break it this time and rally northwards? it remains to be seen but at the moment we have a strong feeling that the 1370 level will be tested again in the near coming weeks and so why not take the advantage of this available chance first
Have a look at the main chart that displays the weekly charts for the yellow metal. The price seems to be stuck in a triangle AGAIN and its facing the descending trendline resistance that needs to be broken so the price can go towards the 1370 level. Fundamentally this has high chance of happening as the pressure on USD mounts and SAFE HAVEN assets such as gold itself are being sought out heavily during this period. Technically however its best to wait until the price convincingly breaks the trendline and slightly retrace it before we opt to go LONG on this pair
The above chart snapshot represent the yellow metal daily chart. as it can be seen there is a broadening top forming on daily charts and the price is already at the top ascending trendline suggesting that its ready to pull slightly down before making its move up again. taking all this into consideration we will patiently wait for the technical analysis to be in our favour before executing this trade.
shall there be any trade entries i will post in a new thread with all the details. This is just purely analysis for the purpose of future signal.


EURUSD opportunitySell zone holds and shows sellers coming in. With Brexit and renewed trade tensions with China, HUAWEI scandal, expected risk off mood to strengthen the dollar. Unless Brexit miracle happens...

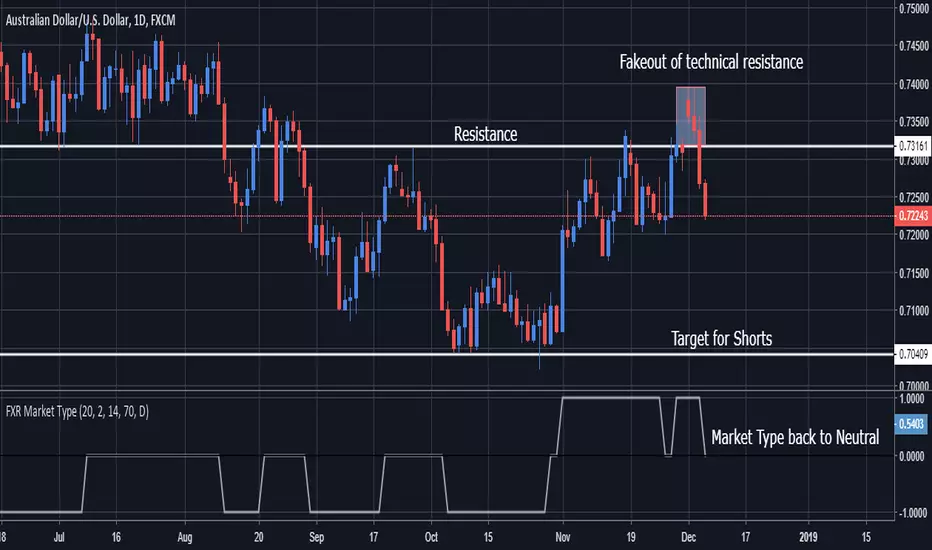
AudUsd - Shorts in Play after Fakeout of 0.7300Worse AU Data alongside broader risk-off sentiment has turned AudUsd 180° and we are now in a decline. We effectively faked out 0.7300/technical resistance and are headed towards 0.7040s.
SPX500USD (H4)After price formed a double bottom at key level support, a strong bullish impulse took place breaking all barriers of the downtrend structure. Price closed this Friday with a bullish engulfing candlestick breaking above resistance along with the major descending trendline. Will be anticipating a slight pullback to retest broken resistance (61.8 fib) as new support for a further push to the upside.
This pair is important to watch as it has a strong correlation to the forex market. When price pushes up, AUD & NZD gain strength. When price moves lower on the SPX, this causes fear in the market & people move their money to safe haven assets like the CHF & JPY.

Short GBP/JPY Over the weekend, the major news has been centered around Brexit and the situation in the Ukraine / Russia. With May's Divorce deal likely to be rejected by the house in the weeks to come. (This is my primary trade to end 2018) The market is focused on all things brexit. With Russia detaining Ukrainian vessels and injuring Ukrainian servicemen in the Process. The Ukrainian defense Minister has referred to this as an act of war.
My Feeling is with the addition of the US / Mexico border Closure there will be slight risk off. I like GBPJPY to be drivin lower through London.

EURJPY (1D): EUR Weakness Not Done?EURJPY
Timeframe: 1D
Direction: Short
Confluences for Trade:
- Stochastic Overbought momentum (1D, H4, H1)
- Reversed against the Fibo Retracement 50% line
- Fundamentally, Italy's budget story has yet to be solved, EU-Italy discussion continues this week; expecting further volatility. In addition to that, higher chance of Democrats taking over the House will add political uncertainty and lead the EURJPY down with this pair normally being a risk off pair.
Suggested Trade:
Entry @ Area of Interest 129.45 - 129.90
SL: 130.38
TP: 128.32
RR: Approx. 2.27 (Depending on Entry Level)
May the pips move in our favor! Good luck! :D
*This trade suggestion is provided on an advisory basis. Any trade decisions made based on this suggestion is a personal decision and we are not responsible for any losses derived from it.

EURJPY (H4): Tensions Brewing for Risk Off PlayEURJPY
Timeframe: H4
Direction: Short
Confluences for Trade:
- Price Action at Resistance of Parallel Channel
- Price Action bouncing off 50 EMA line
- Stochastics close Overbought momentum
- Fundamentally, jittery concerns about EU's disapproval of Italy's budget plan; JPY likely to gain with such issues and adding on Jamal Khashoggi's death creating tension between USA and Saudi.
Suggested Trade:
Entry @ Area of Interest 129.55 - 130.23
SL: 130.54
TP: 127.52
RR: Approx. 2.05 (Depending on Entry Level)
May the pips move in our favor! Good luck! :D
*This trade suggestion is provided on an advisory basis. Any trade decisions made based on this suggestion is a personal decision and we are not responsible for any losses derived from it.

USD/JPY - Rising Wedge - Day TradeFundamentally JPY looks extremely strong as usually it counts as a safe haven when the risk-off scenario prevails in the market. Indices falling sharply and my personal view is that there is still room to go down taking into account all of the latest fundamenal developments.
Technically, JPY has formed a rising wedge and looks like it is ready to break it in the upcoming hours. As a result for me, it looks like an ideal day-trade with a pretty good RRR of over 2.
The idea is to trade the break-down with the SL above the recent high and TP based on the M.P.O. projection. There is a high possibility that the price action will demonstrate an even more severe drop, thus am going to trail the stop after my initial TP level will be reached.
The break of the wedge should occur in the next 4-5 hours in order the pattern and the overall trade set-up to be valid.
Wish all a great trading day! Check my other ideas, and support me with likes, please.

Roadmap For the EurusdThe Eurusd has been hovering around a tight range between 1.1460 and 1.1550. All the prices are entrapped within a bigger range at 1.16
Is this the consolidation before the downmove or otherwise? The market will show us where it wants to go eventually.
Attached is Revelation Trading's roadmap for trading the Eurusd.
Who says trading has to be complicated?
