DXY $Index Cup & Handle Pattern H2 Chart Target 94.40(23.6%Fib.)INDEX:DXY
Update for DXY...After "No Stimulus 'til after Election" triggers market to buy $Index(DXY).
Previously, as linked ideas, I had called for a DXY bounce at beginning of September. DXY proceeded to bounce from its 2011 Long Term upwards trendline, retracing to the 23.6% Fibonacci level($94.40) of the March to September drawdown. From there I forecasted that DXY would come back to test the 14% Fib. area and the local trendline(blue dotted upward sloping). The news of no stimulus conveniently triggered "Risk-Off", subsequently turning the market to the safety of US Dollars(DXY).
On the 2-Hour Chart I see a cup & handle formation. The handle retracement looks complete at 50% Fibonacci retracement, subsequently reclaiming the(blue dotted) upward trendline.
The target for the measured move is back to the 23.6% Fib. area of $94.40....
Again, I maintain my stance regarding the DXY as I will copy paste my previously published analysis statement:
Oct 1
INDEX:DXY
I had been calling for DXY to retrace after reaching the 23.6%($94. 40 ) back to local trendline and 14% Fib.
The DXY pulled back to $93.53, just shy of the 14%, as well as the local trendline(blue dotted line).
Now we find DXY regaining its corrective momentum to the upside.
I still contend that the 138.2%($95.39) Fibonacci extension of correction is in play, and perhaps the 38.2% Retracement ($96.04)!
Perhaps the final corrective wave(call it "C" or "Y") will end in a 5 wave diagonal, not impulse?
To reiterate;
I believe DXY is following a similar trend as in 2016 during the election period in the USA! In 2016 $Index was able to rally through the election into early January, 2017. It was at that point that the DXY began to breakdown for one year. During this time Bitcoin (& Crypto) inversely correlated, and of course was able to rally to its ATH as the $Index found a bottom in January, 2018. From there the Dollar has rallied up until March of this year(2020), at which point the Dollar again broke down, and has found support on its Long Term trendline. I believe a similar pattern will play out, give or take a month or three, and DXY will eventually break below the 2011 trendline. Let's see how it all goes....
Riskoff

10 yrLooks like bond yields have gone risk on but the stock market hasn't caught onto this quiet yet. Heavy resistance incoming, break .79 and the bulls will party

Risk off sentiment ( Buy U.S Dollars & Japanese Yen ) We have Risk-off sentiment in today's markets as Trump catches Covid-19
If stocks continue to decline, we have a strong bias to sell AUD/JPY, AUD/USD, NOK/JPY, CAD/JPY RUB/JPY

RidetheMacro| RISK REWARD PATTERN EXPLAINED (PART 1)Risk Reward Pattern (PART 1) Explained fully.
Please for (PART 2) Check the link Below.
Don't forgot to add your comments to make things more better and better.
Thank you

EURUSD - key spot to determine next moveKey spot for FX:EURUSD right now. 1.17 and watch out for risk-off move in all assets being started on dollar strength.

NASDAQ100 (H8) Price this previous week has made a nice correction that was overdue.. Price reached the bottom of the ascending channel, & rejected off structure support (Green zone). Unless that region is broken, I will remain bullish on this pair & will be looking for price to move towards the top of the channel once again.


AUDJPYLooking for short-term entry on AUDJPY. Retracement probable, with ~even risk:reward. For improved entry, wait for consolidation/chop between 75.3 and 76.3.
Risk-off sensitive. Manage exposure accordingly.


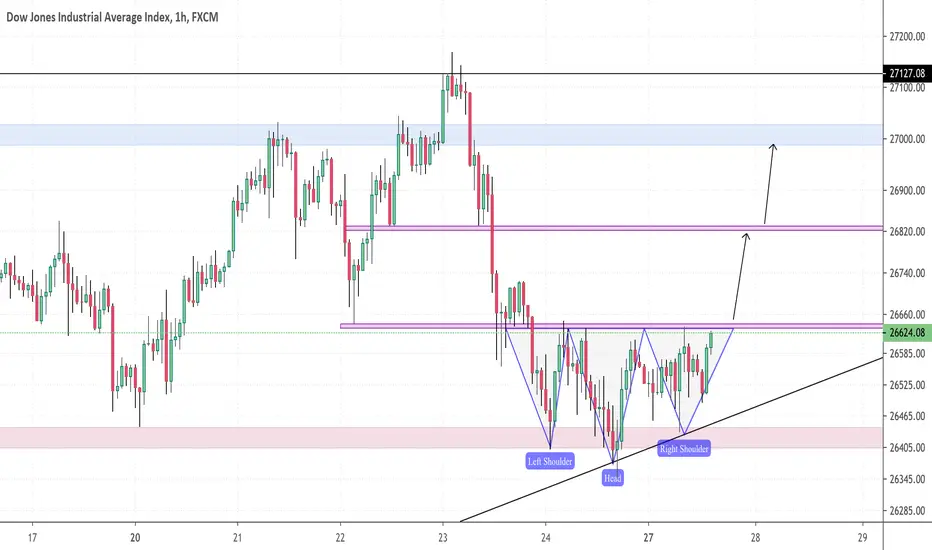
US30 H1Inverse head on shoulders formation, as price has rejected off support along with the ascending trendline. Will be looking for a break of the neckline for a continuation higher.
US 10 BondsThe US 10 Year Bond is probably the most watched metric used to determine the health of the markets. A drop in yields denotes fear and all risk assets are being sold off. The current chart for the 10 Year Bond looks pretty ugly, but it might make the bears quite happy. We are in a giant descending triangle. The formation within the triangle is a very ugly topping pattern.
The chart below is the price action of the 10 Year Bond and it is even more defined and clear. We are approaching the end of the formation.
Currently we stand at the edge and a single big red day may mean a continuation of the down trend. Oil and stocks seem to be topping or at meaningful resistance. Does this mean an imminent drop? No. I am no bear and I frankly don't care which way the markets go, but caution is very much advised. A daily close past the respective resistance/support lines will be a giant red flag for risk assets. Precious metals will likely also drop in such a situation as they have been trading similarly to stocks. However, the drop will likely be far less severe than the last one.
This is not trading advice, but purely my personal opinion.

EUR/JPY Short Hello traders !
I have this trade for you, on higher time frames, daily and weelky we are on a down trend, using this information and combining with that highlighted zone on the chart we discover a zone of resistence.
We have also a risk on sentiment on the market that give us an extra pro argument to take this short.
We can get 3+ R/R that is nice for us !
You can enter in this trade right now and put your SL at 124.150, yout TP at 123.450 and wait to make money !
Also during nights and when Sydney and Tokyo will open up theyr markets and New York will close the market, during this time this pair is losing some price ! use that wisely !
Have a good night !

US30 (H1) Price today has rejected off strong resistance at the top (blue zone), where a lot of bearish pressure occurred to break price below support structure. Price is now pulling back to the previous support where I will be looking for a new lower high / retest of broken support as new resistance to be made. Looking left, you can see how powerful moves occurred off this level in the past, & may do the same again now.


S&P 500 (2 Hour)Price is in a rising channel at resistance that was rejected today. Will be watching for a breakout of the channel along with structure to confirm a move to the downside will occur.

ridethepig | Delights and Torments📍 By now I am sure you all have grasped the basic premise: from the very start of the March dead cat bounce we are calling bluff and looking to play the fade, fighting the Fed does work on occasion despite the rumours, and lastly have formed enough energy after this quarter for a huge swing down in global equities as Long bonds complete the cycle.
Most recessions typically take 5 Quarters to play out, with the study of history it is not a bad thing to introduce one or two of those five quarters are retracements to introduce concepts of the trap. One must act in their best interest, recognise straightaway that this is a game of risk flows and stimulus which are both possible and likely via combinations of further lockdowns and coordinated CB intervention.
The only thing to result from all these demonstrations will be a massive breakup in Gold: the last three iterations have been natural; of course all exclusively live on tradingview. How can we continue to load?
📌 => Delights and Torments of Adding to Swing Positions
The typical retail error is over committing in size to positions; of course the fact that the first three entries are all sitting heavy in profit we are entitled to an ideal privilege. For, me the breakup is an active confirmation of momentum in the spirit of risk via Covid , Brexit and the pending Sovereign Debt Crisis.
Measures like this cannot be left out. Event risk must be taken and played with. Quite naturally, these bear character and influence. There is cause for hurry to occupy the $1,900 target within a few days and weeks. A journey where we can seek to settle and thus take profits before reloading without any effort for $2,000 and beyond in 2021. A huge economic shock... with VIX still sitting above Lehmen levels try as you may to believe this is a V shape recovery... I am not buying it.
As usual thanks for keeping the feedback coming 👍 or 👎

GBPJPY BEARISH SIGNAL ACTIVATEDThe pair is currently in wave 4 formation in a down trend movement. There is a chance for advancement in wave 5.
Sell below: 132.70
Stop loss: Above 134:35 (The setup will be invalid at price beyond this level)
Take profit (At wave 5): 129:50
Fundamentals
Sentiment is currently in risk off which favor strength in YEN against other major pairs.

EURJPY BEARISH SIGNALThe rate is currently at wave 4 in a downward trend, there is a possibility of some advance in wave 5 .
Sell below: 120.00
TP: 118.50
Fundamentals
The market sentiment is currently in risk-off mode which implies the YEN will be strong against other major pairs like EUR, USD, AUD, NZD, CAD, and GBP.

EURJPY BEARISH SIGNAL ACTIVATEDThe price is currently at the wave 4 in a downward trend with expected move to wave 5.
Sell below 120.00
TP 118.50
Fundamentals
The market is currently experiencing some sort of Risk-off sentiment which implies potential strength in Yen against major pairs.

10 yrH4 on ten year is holding overbought while H1 ping pongs between the 2 zones of over sold overbought.
Daily is still way oversold.
The blue line is SP500.
Analysis we r in the melt up of this bull market since march. Trade quick take profits buy the big dip coming

GBPJPY bearish continuation (100+ pips opportunity)Pound, unlike other currencies that enjoy appreciation vs safe havens under times of sentiment improvement and risk assets bull market has other economical and fundamental problems. Still, the big issue is coronavirus but Brexit uncertainties are weighing on Pound heavily. BOE didn't change rates but left the same as before, plus adding some more stimulus which markets didn't 'cheer' as enough questioning BOE's support to the economy.
JPY appreciated the most last week vs majors and on secular performance as well on the latest Coronavirus fears. Indices and metals were lower as well giving risk-off signals toward the investors.
GBP is still the best candidate to depreciate vs other currencies, but given the mentioned sentiment fact safe havens might hurt Pound more than risk-on currencies. As June is coming near its end sentiment shift might stay for a while and further corrections could keep ongoing.
Technically this pair is bearish from higher timeframes (looking from monthly, weekly, daily) and broke its key near term support levels.
131-133 range might be in-play if we form support on 131, but even lower levels like 130-129 are not excluded due to strong momentum at the moment.
IDEAS:
Any pullback towards 133 as long as the price stays under and doesn't close green daily candle above is a selling opportunity. The best way to enter a sell would be to wait this pullback under these circumstances and enter on last known support breakout. I consider this the safest way to enter the continuation trend market.
By doing it this way you simply eliminate the risk of fakeouts, early entries, and the most important counter-trend trap (bull traps).
Trade at your own risk!

USDCAD: possible long opportunityUSDCAD is breaking the trendline formed since the beginning of this week.
On the chart you can see some support/resistance areas + RSI divergence + price above all moving averages and not too far away...
Stocks and oil are under pressure, thus risk-off is favorable for USD bulls.
Another USD long already opened.
Entering the position around 1.3560 (current level) with 1.3780 T/P and 1.35 S/L provides decent R:R=3.
Wait for confirmation and relevant price action on the lower time-frame before entering the position.
//
Make your own analysis before entering position.
Feel free to share your opinion/position via comment and follow me to stay updated + support my work by hitting like.)

EURUSD: possible short scenarioThe main fundamental risk is continuation of the risk-on in equities, otherwise we can expect another strengthening of the dollar, which proved to be a risk-off instrument.
From techincal POV:
-H&S chart pattern
-RSI divergence
Joining EURUSD bears from around 1.1262 price with S/L above 1.1360 and T/P around 1.1000 level provides decent R:R.
//
Make your own analysis before entering position.
Feel free to share your opinion/position via comment and follow me to stay updated + support my work by hitting like.)
