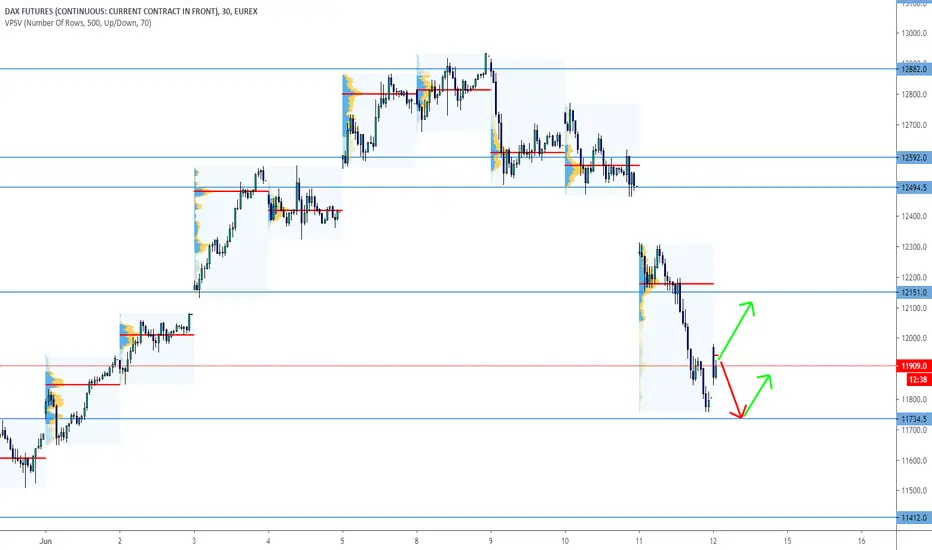
Dax daily: 12 Jun 2020We mentioned it in our analysis yesterday that previous days signalled a bearish correction and could further support sellers. This turned out valid and Dax headed south. The price even broke the support at 12 151 and almost reached the next support at 11 734.
Important zones
Resistance: 12 151
Support: 11 734
Statistics for today
Detailed statistics in the Statistical Application
Macroeconomic releases
NIL
Today's session hypothesis
Dax opened the day with 166 points gap, correcting portion of yesterday's fall. We don't plan to trade the gap situation. The price is midway through yesterday's session and it doesn't provide good hints now. We are not fully clear about the direction, S/R zones are defined so we'll be eying either of those, depending on the initial momentum. Global Indices, including Dax, feared a second wave of pandemic yesterday and chances are that this market mood could further play a role in the upcoming days.
Riskoff
Dax daily: 11 Jun 2020Yesterday's session started with another sell-off and market participants closed the gap and retested the support at 12 494. The price then bounced back up but buyers were not strong enough to take Dax higher. The session closed at its daily low, right at the support zone of 12 494.
Important zones
Resistance: 12 494
Support: 12 151
Statistics for today
Detailed statistics in the Statistical Application
The gap is sized 217 points with low closing probability
Macroeconomic releases
NIL
Today's session hypothesis
Dax opens the session with 217 points sized descending gap. It is apparent that yesterday's bearish day sparked the downside momentum, propelled by the FOMC. After two weeks of growth, it is now clear the bullish trend ended. Dax is now priced 12 300 and the support of 12 151 is in the near vicinity and this is the first interesting S/R zone to take into account. As the resistance, we can mark the 12494 zone which is yesterday's support and the closing price of the session. The statistical probability of retesting this area today is low, yet this scenario can actually happen.

VIXBlue line is the 10 yr, they should start to diverge as yields rise and VIX falls. (in the perfect bull world)

EUR/NZD - Long - Bearish Reversal I always like too think the charts don't lie and with the ECB meetings tomorrow all signs point upwards.
Although, despite short term success in this diverging channel for NZD that is largely due to the risk on tone across the markets.
The top tier 1.82000 resistance is a potential TP with both 100 & 200 day MA looking to diverge for potential change of direction to either side the ECB news could prove a 100+ pip winner by US session.
For you oscillator fans the RSI indicates its oversold but further risk on tone could see us move into range from the upside breakout earlier this year. The bearish reversal touching the bottom of the channel points to a test upside.

#DXY To 109 By #2023 Forecast!Almost a 2 years forecast for TVC:DXY which is currently creating a super massive cup and handle pattern on Quarterly chart, Price tend to meet the rising wedge that extends since 2011 and was touched twice in 2014. The analysis is based on Supply, Demand, wedges and channels. Anticipating this to hit 109 at some point...
Follow for more forecasts...
#AHMEDMESBAH

GJ upcoming short Coming up to this minor supply zone and 132.500 psych level, also the third tap on trend line, once price action rejects and confirms could be a nice short after NY open
want to see rejection from 132.600-800

#AUDJPY [4H] Risk-OFF Alert. [85% : 15%] A fall Anticipated...SAXO:AUDJPY Has failed several times last couple of weeks to break through the 70 mark. As risk aversion kicks in including recent tensions between US and China. A risk off mode might be brought into the market. This can reflex in a big way into SAXO:AUDJPY as AUD is 4th most expensive currency at the moment and kind of over bought considering the slow economy looming.
Here is a short setup for the upcoming week with a ratio of 85% to 15% in favor of short over long.
Follow for more ideas...
AHMEDMESBAH


EURCAD Higher levels to come / Buy dips with 1,59 as tgtHi Traders,
We have seen some stable price action from the begining of the March .
Bears failed lately and prices are rising since.
Oil fireworks adding to negative CAD picture.
Im discussing possible entry, stop and targets
Good Luck

GBPJPY - Short - Take Profit 130.000Short trade recommended with a take profit of 130.000
Fibonacci Retracement at 0.382 struggling to break through the past 10+ days to the 0.5 retracement level.
The real test of this trade once reached is the 132.500 level which has proven extremely difficult to break over the past 10 days.
The upside today was based on a wave of fundamental news (Postive) and strong index performance across the globe seeing between 5% - 8% gains across the globe weakened the YEN. The evening seen a snap downwards due to minister being admitted to ICU.
I expect to see downside in Asian session tonight (Provided no positive news moving futures upwards).

10 yr10 year looks ready to break up which could be signaling risk on will be back over the next 2-3 years Fam

AUDJPY Possible Bearish Continuation Price floating below the long period SMA 200 (red) and trading under the weekly and daily pivot point already indicting bearish sentiment for this pair. Comdolls aren't doing well and the risk bets are not good so far which we can see from the price action in most of comdolls related pairs like au,uc,nu. Yen and dollar ruling over the market this week so far which let me think that this pair might drop further lower if market mode are in risk off.

Strong resistanceIf you are not willing to risk the usual you will have to settle for the ordinary. ~Jim Rohn

Gold-Stocks Ratio Brakeout - A Historic Risk-off FlagThe Gold-to-Stocks ratio breaking above the 200-week moving average.
The last time this occurred was 2001, and for more than a decade investors were better avoiding stocks and holding gold.

USDOLLAR Slides to 61.8% Fibonacci LevelFurther to yesterday's article , the USDOLLAR has continued to decline. It now finds itself at the 61.8% Fibonacci level of its previous impulse move. This level overlaps with price support (green shaded horizontal) around the 12,290 level. The rotation of capital into bonds as well as short term notes is putting pressure on yields. This is the the catalyst for the lower USD. We note the positive correlation between the 2 Yr Treasury Bill and the USDOLLAR (red rectangle areas). However, we again reiterate that the RSI for the T-Bill is oversold (blue rectangle) and that it will need to normalize soon. This is likely to provide support for the greenback, which may provide a floor to further greenback weakness in the near term.

USDJPY - SHORT - RISK OFF - NEW WAVE COUNTTECHNICAL STRATEGY
I am looking to take this short (after a pullback) after this has been rejected from the top side of this descending triangle.
I am also anticipating a new wave count and hoping to catch the 3rd wave.
DESCENDING TRIANGLE
RISK OFF SENTIMENT
Another thing that drove me to sell this pair is the fact that the CBOE Volatility Index has spiked it to level after a very long time which is initiating that we are currently risk-off.

THE GOLD RUSH (shooting up) - Why? And how can I get involved?Gold is setting record new highs with no sign of slowing.
This is due to gold being a "safe heaven", e.g when there is uncertainty in the market, large investors move to safer options such as resources with limited availability. This is because due to there only being a certain amount of gold on earth at any given time it always retains value. Gold being the favourite.
Due to the Corona virus large uncertainty in many countries currency has impacted the market.
So how can I get involved and make some profit?
We know fundamentally gold is long, so now to the charts for the technical's.
Looking back on the WEEKLY we can see there is no real structure to slow down the price of gold, so go long on the pullbacks or break of new highs.(Basic trend trading skills required, just have a search online it's fairly simple to learn).
High impact corona virus news will fuel the move upwards, but also be weary any news that stabilises the market will make gold plummet.
Fun fact: Did you know if you collected all the worlds gold and made it into a cube, you could have an approximate 20m x 20m x 20m cube that would fit under the Eiffel tower!
Get gold, not Corona!

USDJPY Will AAPL warning wake the bears up ? ShortsHi Traders,
all details ( entry,s top, targets ) recorded
Enjoy and GL

Live Positioning in GBPJPY !!!A round of GBP chart updates after the latest cabinet reshuffle. A nice sweep of the highs and we are set to go with the fiscal taps set to rain down and attempt to offset the impact via brexit.
On the other side we have risk taking the spotlight again with coronavirus flows not abating. JPY is set to outperform over the coming sessions with a soft selloff in global equities and with GBPJPY at the top in the range we are sitting at good value levels to recycle shorts.
For the map:
Highs 143.25 <=> Mid 142.25 <=> Lows 141.25
Expecting a red asian session with more risk clearing to be complete, I am taken back by how complacent that many markets have been able to try looking through the outbreak. We have a few reasons to remain on high alerts, uncertainty around the 2s5s:
Notice how the inversions are ahead of recessions, while the press reports all is well there are downside risks building and playable across many markets. If we see an improvement in sentiment around the coronavirus I will lighten up. I will not be stubborn and hold on. Keep it simple and trade the driver!
Don't forget to keep the likes and comments coming!!

USDJPY: possible scenario for joining bullsThe market calmed down, so Japanese yen is weakening.. i am waiting for better price to join bulls between 109.15-108.95 zone with 109.8 T/P (R:R 3.25).
Keep in mind that this idea might be realized in several days and opening long position in USDJPY results positive swap.
//
Feel free to share your opinion/position via comment and follow me to stay updated.

AAPL: Puts might pay off...I'm posting this one as an update to my broad stock positions outlook. For now I've moved to cash in all positions, and bought some energy, gold/mining/oil and added to my #Bitcoin holdings with proceeds. I also have some bearish bets in #AAPL, might be a good idea to reduce risk. My bullish posts for stocks might end up resulting in a failed signal, or maybe they endure a large drop before going back up over time.
Be safe out there!
Cheers,
Ivan Labrie.

Huge monthly divergence DOW30 -- and ALL risk ASSETS
this could be the long-awaited top.
All risk assets (USD, JPY, gold, and SPX/US30)
have now confirmed a possible top.
Short fade ins.
Price: 28980
TP1: 25700
TP2: 20460
SL: 29900
