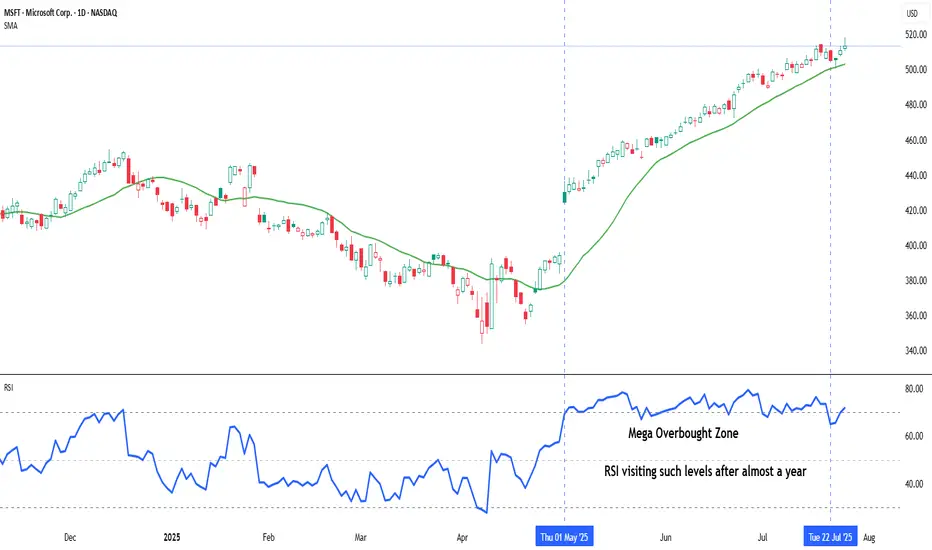
Indicator Decoded: RSI Mega Zones: Signals from the EdgeMost traders are familiar with the textbook RSI levels—70 indicating overbought and 30 indicating oversold. But markets, especially in strong momentum phases, do not always obey these boundaries. That is where the concept of Mega Overbought and Mega Oversold zones becomes vital. These are not fixed thresholds, but adaptive zones often beyond 80 and below 20, where the RSI reflects extreme strength or weakness. Rather than acting as reversal points, these levels often signal trend continuation.
A reading above 80 is typically seen during powerful uptrends or post-breakout rallies. It indicates not just buying, but unhesitating, aggressive demand, especially after key resistance zones have been cleared. Such RSI levels have often not been seen in several months—if not more than a year—making their appearance especially significant. Rather than a signal of exhaustion, this may be the start of a major trend, suggesting that the broader structure of the stock or index has shifted decisively. Traders who misinterpret this as a reversal signal often find themselves fighting momentum. Instead, price tends to grind higher, sometimes pausing briefly before further gains. This is why the chapter suggests using Mega Overbought zones as confirmation of bullish control, not a trigger for counter-trades.
The inverse applies to the Mega Oversold zone—RSI falling below 20. This is usually not a buy-the-dip moment, especially if the broader trend and chart structure are bearish. Such readings typically accompany panic-driven breakdowns, where sellers dominate without any counterforce. These extreme values are often rare and may not have appeared for months or even over a year, marking a moment where the market’s character may be undergoing a structural change. As with Mega Overbought, context is critical. If RSI hits such depths after prolonged distribution or a topping pattern, it does not indicate value—it confirms that the tide has turned, and a strong downtrend may be setting in.
Both Mega zones are best used in conjunction with structure—trendlines, volume shifts, anchored VWAP zones, or price patterns. The RSI alone is not enough. But when it aligns with other technical signals, a Mega Overbought or Oversold status becomes a momentum amplifier, not a contrarian prompt. In fact, your RSI chapter rightly warns that entering against such zones can be fatal unless clear divergences, climax patterns, or volume exhaustion are also present. Think of these extremes not as ceilings or floors, but as accelerators when backed by structure.
A word of caution: These signals are rare and often widely spaced. The real challenge lies in managing risk–reward, as strong momentum and shallow pullbacks can make it difficult to find entries with favourable R:R ratios.
Chart: Microsoft Corp. (MSFT) – Daily Chart with 20-DMA and RSI (as on July 25, 2025)
Microsoft continues its strong upward trajectory, with price action staying well above the rising 20-day simple moving average. The recent surge in RSI into the mega overbought zone marks a significant shift in momentum, as the indicator revisits such elevated levels after nearly a year—an occurrence that often coincides with extended bullish phases.
Riskreward
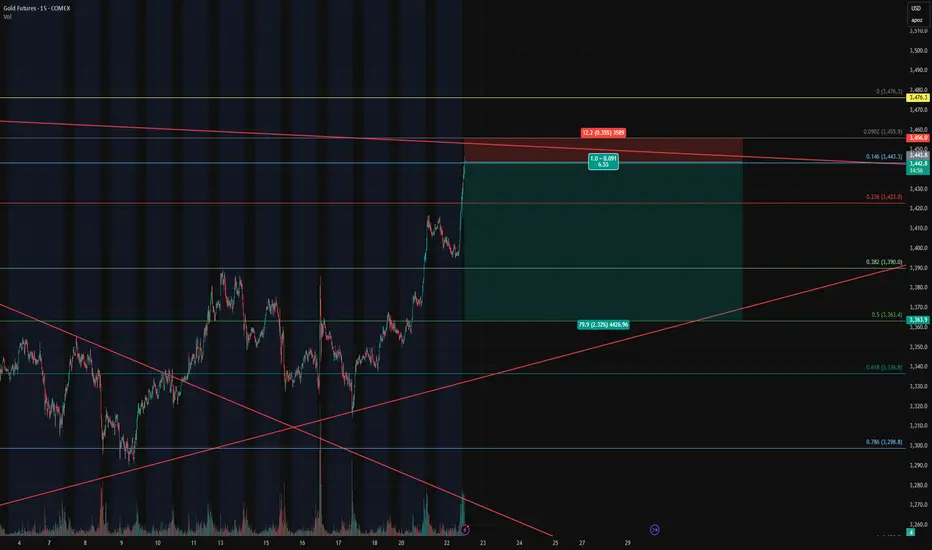
Gold Futures – Closing Longs and Flipping Short at Key Fib🔴 Gold Futures – Closing Longs and Flipping Short at Key Fib Confluence
Instrument : Gold Futures – COMEX ( COMEX:GC1! )
Timeframe : 15-Minute
New Position : Short
Entry Zone : ~3442
Target : ~3362
Stop Loss : ~3458
Risk/Reward : Approx. 6.5+
Setup Type : Reversal from Overextension / Fib Resistance
💡 Trade Recap & Strategy Shift
We’ve officially closed both our recent long entry and our larger swing long position, locking in substantial profit on this move off the 0.618 retracement.
Now, we’re flipping short based on the following:
Price reached the 0.146 Fib extension from the previous retracement leg, a level often overlooked but powerful when confluence lines up.
Trendline resistance from the upper channel has been tagged.
Momentum is showing early signs of stalling after a strong vertical push — textbook overextension.
The rally into this level lacked divergence or structural buildup, increasing the chance of a snapback.
🛠️ Short Setup Details
Entry: 3442 (after signs of exhaustion near Fib confluence)
Target: 3362 (prior structure + 0.382 retracement)
Stop Loss: 3458 (just above high / resistance zone)
Risk/Reward: 6.5:1 — excellent profile for a countertrend play.
📌 Watch For
A break below 3390 will be key confirmation of momentum shifting back down.
Failure to hold 3442 on a retest will invalidate the short and re-open the door for a squeeze higher to 3476/3480.
With trend exhaustion in sight and high confluence resistance overhead, we’re taking the opportunity to pivot short — fully aware of the volatility this region can bring.
Why I Went Long on AMD Near the 2025 Lows🔍 Reason for the Trade
This wasn’t just a “buy the dip” setup — this was a calculated trade based on strong confluence:
✅ Multi-Year Demand Zone
Price returned to a massive support level that’s held since 2020. This zone had previously triggered multiple large bullish reversals.
✅ Falling Wedge Breakout
A textbook falling wedge pattern formed during the pullback. Once price broke out, the momentum confirmed a structural reversal.
✅ Risk/Reward Optimization
I positioned my stop just under key support, with targets set at prior structure highs. The setup offered a clean 2.5:1+ R/R ratio, perfect for swing conviction.
✅ Institutional Accumulation Area
The volume and wick rejections in this zone screamed smart money stepping in. It was a classic sign of fear-based selling into patient buyers.
🧠 Lessons Reinforced
- Wait for the Zone, Then Act: Patience paid off — the best trades come from the best levels.
- Structure Over Emotion: I trusted the technical, not the bearish headlines.
- R/R Always Wins: You don’t need to be right every time, but when you’re right — let it run.
#AMD #SwingTrade #TechnicalAnalysis #SupportAndResistance #WedgeBreakout #RiskReward #PriceAction #StockMarket #TradingView #TradeRecap

Gold (XAUUSD) – 21 July | M15 Pullback Within Bearish Structure🟠 Gold (XAUUSD) – 21 July Analysis | M15 Pullback in Bearish Trend
Gold is currently in a pullback phase within a bearish M15 trend .
The market structure is defined between the M15 lower high at 3377.650 and the previous low at 3310 .
On Friday, price retested the M15 supply zone near the lower boundary, and again today, it has reacted from the same area. This repeated rejection suggests that sellers are still defending this level.
🔍 Trend Context:
– M15: Bearish (Lower High → Lower Low structure intact)
– H4: Currently in a pullback phase
Unless the price breaks above the key 3377.650 level, the bearish structure remains valid. As such, our directional bias continues to favour shorts.
🟥 Key Supply Zone: 3358–3377.650
– Recent rejections seen from this zone
– Acts as the active short-term supply zone
– Watching for internal M15 bearish shift for possible entry
Preferred Scenario:
As price has already retested the M15 supply zone, if we now see a downside shift in internal M15 structure (e.g., ChoCH + BoS), we will look for a potential short entry aligned with the dominant M15 trend .
No confirmation, no entry. Always follow structure.
Alternate Scenario:
If the market breaks above the 3377.650 lower high, it would signal a potential bullish structure shift . In that case, we will step back from the short bias and re-evaluate long opportunities accordingly.
📌 Trade Plan:
– Wait for M15 internal structure to shift (ChoCh) bearish, followed by a Break of Structure (BoS)
– On the retest, mark the Point of Interest (POI) for potential short setup
– Only act on confirmation (e.g., M1 ChoCH + BoS)
– SL: 40 pips | TP: 120 pips | Risk-Reward: Always 1:3
Summary:
– Gold is in a pullback phase within a bearish M15 trend
– Key levels to watch: 3377.650 (lower high) and 3310 (previous low)
– Bias remains bearish unless structure flips
– Watch for internal structure shift for short opportunity
– Stay patient and aligned with the dominant trend
📘 Shared by @ChartIsMirror

123 Quick Learn Trading Tips - Tip #7 - The Dual Power of Math123 Quick Learn Trading Tips - Tip #7
The Dual Power of Math: Logic for Analysis, Willpower for Victory
✅ An ideal trader is a mix of a sharp analyst and a tough fighter .
To succeed in the financial markets, you need both logical decision-making and the willpower to stay on track.
Mathematics is the perfect gym to develop both of these key skills at the same time.
From a logical standpoint, math turns your mind into a powerful analysis tool. It teaches you how to break down complex problems into smaller parts, recognize patterns, and build your trading strategies with step-by-step thinking.
This is the exact skill you need to deeply understand probabilities and accurately calculate risk-to-reward ratios. 🧠
But the power of math doesn't end with logic. Wrestling with a difficult problem and not giving up builds a steel-like fighting spirit. This mental strength helps you stay calm during drawdowns and stick to your trading plan.
"Analyze with the precision of a mathematician and trade with the fighting spirit of a mathematician 👨🏻🎓,
not with the excitement of a gambler 🎲. "
Navid Jafarian
Every tip is a step towards becoming a more disciplined trader.
Look forward to the next one! 🌟
C98USDT – Potential Impulse Wave 3 in Progress? | Elliott WaveHello traders! 🚀
Sharing a fresh Elliott Wave setup I'm currently monitoring on C98USDT (4H TF). The price structure is unfolding clearly and may be in the early phase of a classic 5-wave impulse.
After an impulsive move up completing Wave (1), the market corrected in a textbook ABC pattern down into a key demand zone, finishing Wave (2). We’re now seeing strong bullish momentum suggesting the beginning of Wave (3) – the longest and most aggressive wave in Elliott theory. ⚡
Trade Setup:
🟢 Entry Zone: 0.043 – 0.046
🔴 Stop Loss: 0.03913
🎯 Target Price: 0.05955
💡 Note: Always manage your risk and confirm with your own analysis before entering any trade.
Let me know your thoughts and wave count below! 👇
Happy trading! 🚀

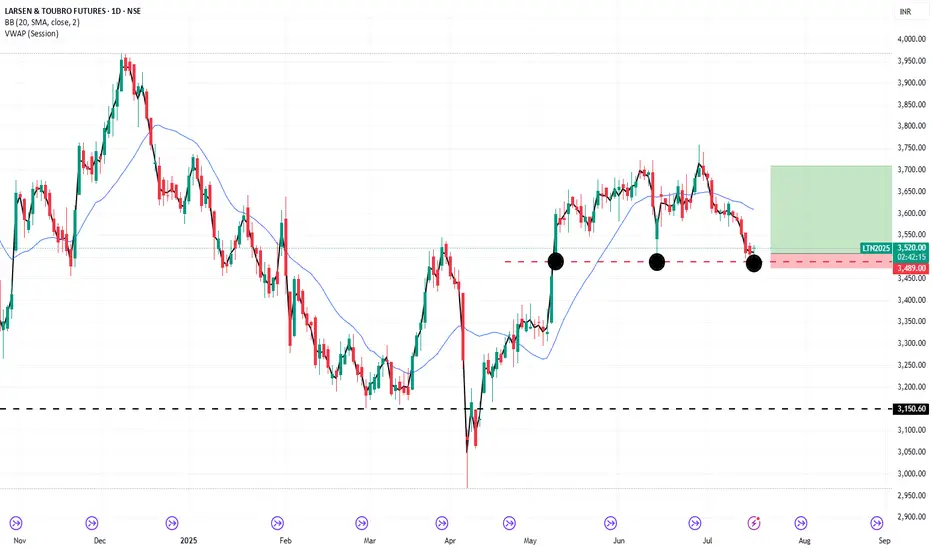
0.5:2 = risk:rewardIts third time LT is taking support @ 3480 & bouneing back, if it sustains & close above 3525 then it ll target 3700.
Very good Risk:Reward Ratio.
Could b bought @ cmp Wih Stoploss of 3475 & target of 3700
GBPUSD Week 29 Swing Zone/LevelsAfter 7 straight weeks of profitable gold trading, we’re shifting gears to GBPUSD.
Why this pair? It’s offering a classic low-risk, high-reward setup that many traders appreciate:
🔒 Stop Loss: 10–15 pips
🎯 Take Profit: 50–100 pips
We’re analyzing price action using a simple but powerful concept:
Each zone is drawn based on how the high and low of one day compares with the next. For example:
Monday’s high/low vs Tuesday’s range
Tuesday’s vs Wednesday’s, and so on
This method helps spot potential continuation zones as market structure unfolds across the week.
👉 The key? Patience, and letting the levels tell the story.
As always price action determines trades

Negative Risk/Reward: Hidden Edge or Hidden Danger?It’s a topic that sparks plenty of debate.
👉 Can a negative risk/reward ratio actually be part of a winning strategy?
Here’s our take, split between intraday trading and swing trading:
📉 Intraday Trading
☑️ Pros:
• Can work in high‑probability setups (mean‑reversion, range scalps)
• Quick targets often get hit before stops
• Stops can sit beyond liquidity grabs to protect the trade
⚠️ Cons:
• Needs a consistently high win rate
• Prone to slippage and fast spikes
• Can lead to over‑trading if discipline slips
If used, risk must always be pre‑defined — not adjusted mid‑trade.
⏳ Swing Trading
☑️ Pros:
• Occasionally helps avoid being stopped on deeper pullbacks
• Gives breathing room in trending markets
⚠️ Cons:
• Smaller targets vs bigger stops rarely pay off over time
• Lower win rate on higher timeframes makes it hard to sustain
• Exposed to news gaps & weekend risk
Overall, swing trading works best with positive R/R setups (e.g., 2:1 or higher).
☑️ Summary:
Negative R/R can work — but only if:
• The setup is statistically proven & high probability
• You keep risk strictly pre‑defined
• It fits the pair, timeframe & volatility
Most traders are better off sticking to positive R/R — but for experienced scalpers, negative R/R can be a tool rather than a trap.
💭 Do you use negative risk/reward in your strategy?
Only intraday, or do you apply it to swing trades too?
Drop your thoughts below —we're curious to hear how others approach it! 👇
Thanks again for the likes, boosts, and follows — really appreciate the support!
Trade safe and all the best for the week ahead!
BluetonaFX

Mastering Risk Management: The Trader’s Real EdgeYou’ve all heard it,
“Cut your losses and let your winners run.”
Simple words — but living by them is what separates survivors from blown accounts.
Here’s some tips on how to approach risk management when trading:
☑️ Risk is always predefined: Before I click Buy or Sell, I know exactly how much I’m willing to lose. If you don’t define risk upfront, the market will do it for you.
☑️ Position sizing: Never risk more than 1–2% of your account per trade. Small losses mean you can keep taking high‑probability setups without fear.
☑️ Always use a stop‑loss: No stop? You’re not trading — you’re gambling.
☑️ Stop‑loss discipline: Place stops where the market proves you wrong — not where it “feels comfortable.” Then leave them alone.
☑️ Focus on risk/reward, not win rate: A 40% win rate can still be profitable if your average reward outweighs your risk.
☑️ Risk/reward ratio: Only take trades with at least a 2:1 or 3:1 potential. You don’t need to win every trade — your winners should pay for your losers (and more).
Remember:
“It’s not about being right all the time. It’s about not losing big when you’re wrong.”
Risk management won’t make your trades perfect — but it will keep you trading tomorrow.
And in this game, staying in the game is everything.
💭 How do you handle risk in your trading? Drop your strategy or tip in the comments — let’s share and learn together! 👇
Thanks again for all the likes/boosts, we appreciate the support!
All the best for a good week ahead. Trade safe.
BluetonaFX

AMGN : Long with Good RR We are above the 200-period moving average on the 1-hour chart.
And the trend line has been broken.
There is a good risk - reward ratio. Approximately : 2.48
Small position sizes can be tried.
Entry : 287.38 (Now)
Stop - Loss : 276.28
Take Profit Level : 315.0
Regards.

Bitcoin Tests Key Support-Healthy Correction Within Bull MarketHealthy Pullback, Strong Structure:
Bitcoin’s recent dip is a constructive correction within a broader bull trend, as it tests the critical $100,000–$105,000 support zone—a former resistance area from early 2025.
Institutional Demand Holds the Line:
Maintaining levels above the psychologically important $100,000 mark highlights continued institutional accumulation and reinforces the underlying strength of the trend.
Momentum Reset, Base Building:
This pullback has helped reset overbought conditions from the prior rally, laying the foundation for the next potential leg higher.
Key Levels to Watch:
Support: $100,000–$105,000
Breakout Trigger: A close above $108,000 would confirm uptrend continuation
Outlook: Bullish bias remains valid as long as support holds
Investor Opportunity:
With structure intact and downside contained, this consolidation presents a favorable risk-reward setup for long-term investors looking to position ahead of a potential breakout.
#Bitcoin #BTC #CryptoMarket #TechnicalAnalysis #SupportAndResistance #BullMarket #RiskReward #InstitutionalBuying #MarketOutlook #PriceAction

Good move is expected soonhi fellas,
The Weekly trend of cochin shipyard is solid and bullish.
At daily timeframe there is a swing whose target can be till the weekly resistance level as mentioned in the chart.
The risk : reward ratio is 1:3.87
Enter after the daily candle closes above 2243.70
SL and target is mentioned in the chart.

Crude Oil Futures: Navigating Geopolitical Risk and VolatilityMarket Context:
NYMEX:CL1! COMEX:GC1! CBOT:ZN1! CME_MINI:ES1! CME_MINI:NQ1! CME:6E1!
Implied volatility (IV) in the front weeks (1W and 2W) is elevated, and the futures curve is in steep backwardation. This indicates heightened short-term uncertainty tied to geopolitical tensions, particularly in the Middle East involving Iran and Israel. The forward curve, however, suggests the market is not fully pricing in sustained or escalating conflict.
We evaluate three possible geopolitical scenarios and their implications for the Crude Oil Futures market:
Scenario 1: Ceasefire Within 1–2 Weeks
• Market Implication: Short-term geopolitical premium deflates.
• Strategy: Short front-month / Long deferred-month crude oil calendar spread.
o This position benefits from a reversion in front-month prices once the risk premium collapses, while deferred months—already pricing more stable conditions—remain anchored.
o Risk: If the ceasefire fails to materialize within this narrow window, front-month prices could spike further, causing losses.
Scenario 2: Prolonged War of Attrition (No Ceasefire, Ongoing Missile and Air War)
• Market Implication: Front-end volatility may ease slightly but remain elevated; deferred contracts may begin to price in more geopolitical risk.
• Strategy: Long back-month crude oil futures.
o The market is currently underpricing forward-looking risk premiums. A persistent conflict, even without full-scale escalation, may eventually force the market to adjust deferred pricing upward.
o Risk: Time decay and roll costs. Requires a longer holding horizon and conviction that the situation remains unresolved and volatile.
Scenario 3: Full-Scale Regional War
• Market Implication: Severe market dislocation, illiquidity, potential for capital flight, and broad-based risk-off sentiment across global assets.
• Strategy: Avoid initiating directional exposure in crude. Focus on risk management and capital preservation.
o In this tail-risk scenario, crude oil could spike sharply, but slippage, execution risk, and potential exchange halts or liquidity freezes make it unsuitable for new exposure.
o Alternative Focus: Allocate to volatility strategies, defensive hedging (e.g., long Gold, long VIX futures), and cash equivalents.
o Risk: Sudden market shutdowns or gaps may make exit strategies difficult to execute.
Broader Portfolio Considerations
Given the crude oil dynamics, there are knock-on effects across other markets:
• Gold Futures: Flight-to-safety bid in Scenarios 2 and 3. Long positioning in Gold (spot or near-month futures) with defined stop-loss levels is prudent as a hedge.
• Equity Index Futures (E-mini Nasdaq 100 / S&P 500): Vulnerable to risk-off flows in Scenarios 2 and 3. Consider long volatility (VIX calls or long VX futures) or equity index puts as portfolio hedges. In Scenario 1, equities could rally on resolution optimism—especially growth-heavy Nasdaq.
• Currency Futures: USD likely to strengthen as a safe haven in Scenarios 2 and 3. Consider long positions in Dollar and Short 6E futures.
• Bond Futures: Risk-off flows theoretically should support Treasuries in Scenarios 2 and 3. Long positions in 10Y or 30Y Treasury futures could serve as a defensive allocation. Yields may retrace sharply lower if escalation intensifies. However, given the current paradigm shift with elevated yields, higher for longer rates and long end remaining high, we would not bet too heavily on Bond futures to act as safe haven. Instead, inflows in Gold, strengthening of Chinese Yuan and Bitcoin will be key to monitor here.
Scenario-based planning is essential when markets are pricing geopolitical risk in a non-linear fashion. Crude oil currently reflects a consensus expectation of de-escalation (Scenario 1), which opens the door for relative value and mean-reversion strategies in the front-end of the curve.
However, given the asymmetric risks in Scenarios 2 and 3, prudent exposure management, optionality-based hedges, and a flexible risk framework are imperative. A diversified playbook; leveraging volatility structures, calendar spreads, and cross-asset hedges offers the best path to opportunity while managing downside risk.

The Bitcoin Manipulation Trick - How They Lure You Into the Trap📉 Bitcoin spends more time in deep drawdowns than at its peaks. Historically, BTC has spent over 80% of its existence trading 80-90% below its all-time highs, yet people keep falling for the illusion of wealth.
🧐 Here’s how the cycle works:
1️⃣ They drive up the price to make it enticing for new buyers.
2️⃣ You FOMO in at the highs, believing in the "next big wave."
3️⃣ Then they crash it, wiping out weak holders.
4️⃣ They keep it suppressed for years, forcing everyone out, via margin calls, financial strain, or sheer exhaustion.
5️⃣ When enough have capitulated, they restart the cycle.
📊 Historical Evidence:
- 2013 Crash: Over 400 days down 80%+ before recovery.
- 2017 Crash: Nearly 3 years below 80% of ATH.
- 2021 Drop: More than a year stuck 75% below peak.
🔎 If you’re buying now, be ready to:
⛔ Lose access to your money
⛔ Keep covering margins
⛔ Wait years for recovery, if it ever happens …
They play the same trick, every time. If you don’t recognize it, you’re just another part of the cycle. 🚀🔥
INDEX:BTCUSD NASDAQ:MARA NASDAQ:COIN NASDAQ:TSLA TVC:GOLD TVC:SILVER NASDAQ:MSTR TVC:DXY NASDAQ:HOOD NYSE:CRCL

XAUUSD - Risk Management - How much % do you risk daily?⭐It’s not about how much you know. It’s about how much you risk.⭐
The lesson you only learn after blowing up your account.
You’ve read hundreds of articles, watched countless hours of YouTube.
Joined 5 groups.Subscribed to 10 channels.
Maybe you even tried a prop firm challenge and failed it in two days.
Paid for mentorship.
Kinda know structure. See price action.
And yet… your account still shrinks faster than your patience.
Because at the end of the day:
It’s not about what you know. It’s about how much you risk.
⚠️ The trade was right. Your lot size wasn’t.
You had a good setup.
Price reached your zone. There was confluence.
Everything looked clean — until your lot size showed up to ruin everything.
Example: You entered with 0.50 lots on a $200 account, using a 40-pip stop loss.
Let’s break it down:
• $0.50 per pip × 40 pips = $200 loss
• You lost 100% of your account on a single trade
The strategy didn’t fail.
The size did.
💡 Why “risking 1%” works on paper — but not on XAUUSD
Every trading book, coach, and Twitter guru screams:
“Just risk 1-3% per trade.”
Cool. Sounds disciplined.
But in Gold, most traders use tight stop losses — 20, 30, maybe 50 pips.
To stay within 1% risk with such a small SL, your lot has to be bigger.
And that’s where accounts explode.
Gold doesn’t move like EURUSD.
It spikes, wicks, manipulates, and throws fakeouts for fun.
Experienced traders know that sometimes a 150–180 pip SL isn’t weak — it’s smart.
It’s not about “being wrong.” It’s about giving the setup room to breathe.
📌 What actually works
Instead of risking 1-3%, many experienced traders manage risk more conservatively:
• 0.25%–0.35% per trade is more sustainable
• 0.50% is rarely reserved for highly valid, high-confluence setups only
This allows for:
• More breathing room
• Emotional control
• Less panic during drawdown
• And more trades that survive manipulation
🧠 Your position size is your psychology, exposed.
Most traders don’t lose because they picked the wrong zone.
They lose because they sized their trade like they were trying to get rich overnight.
You want to measure discipline?
Forget strategy.
Look at how much someone risks per trade.
A 0.10 lot on a $500 account means control.
A 1.00 lot on the same account means desperation or showoff.
🧮 A quick example to make it real
You have a $1,000 account.
You risk 0.20% — that’s $2/pip.
Your stop loss is 50 pips.
That means you can trade 0.10 lot safely.
Now you’re giving the trade room to work — and if it fails, you’re still in the game.
That’s the difference between blowing up and showing up.
📉 Bonus risk reminder: Daily exposure ≠ per-trade risk
If you’re taking 2–3 trades per day, don’t risk 0.30% on each one. That’s not low risk — that’s stacking exposure. ✅ What you should do: Decide your daily risk limit (let’s say 0.30%), then split it across your planned entries. 2 trades? → 0.15% each 3 trades? → 0.10% each
🎯 Final thoughts
Your setup doesn’t need to be perfect.
You do.
→ Risk according to volatility, not emotion
→ Respect your stop loss, and scale your lot size to match
→ Don’t try to force profits out of every candle
The best traders aren’t always right —
they just size smart enough to be wrong and still come back.
If this lesson helped you today and brought you more clarity:
Drop a 🚀 and follow us✅ for more published ideas.

INDIGOPNTS - Bullish view potential of 28 to 45% ROIAll details are given on chart for educational purpose only. If you like the analyses please do share it with your friends, like and follow me for more such interesting charts.
Disc - Am not a SEBI registered analyst. Please do your own analyses before taking position. Details provided on chart is only for educational purposes and not a trading recommendation

"GBPUSD Ready for the Kill After Premium Zone Reaction!"⚡ GBPUSD Analysis - 1H Timeframe | April 28, 2025
📈 What's Happening:
GBPUSD just tapped deep into the Premium Zone while simultaneously reacting off a clean Fair Value Gap (FVG).
Signs of bearish rejection are stacking up — Smart Money might be preparing for the kill shot! 🎯
🚨 Key Levels Highlighted:
Strong High = Major invalidation (~1.34317).
Premium Zone = Where sellers ideally step in.
Fair Value Gap (FVG) = Where price imbalance triggered a reaction.
Weak Low = Major liquidity target (~1.32036).
🧠 Key Observations:
Price filled the FVG and immediately showed a reaction = sign of Smart Money stepping in.
Strong High untouched = still valid for bearish play.
Weak Low + Sell Side Liquidity = magnets below.
🎯 2-SCENARIO PLAN:
Plan A — Short Setup (Primary Bias):
✅ Look for bearish confirmation via M15 or M5 structure shift.
✅ Ideal entry around Premium/FVG zone.
✅ TP1 = Minor structure lows around 1.33000. TP2 = Full Weak Low sweep (~1.32036).
✅ SL = Above Strong High (~1.34317).
Plan B — Invalidated if:
✅ Strong High is broken impulsively = setup failed. No chasing!
📊 Risk Management Tip:
"Fair Value Gap reactions inside Premium = sniper-level setups. Focus on confirmations, not assumptions."
🧘♂️ Summary:
✅ Premium Tap ✅ FVG Fill ✅ Bearish Reaction ✅ Weak Low Target
Patience = Power.
This could be the sniper setup you've been waiting for! 🔥
➡️ Save this playbook.
➡️ Comment "SNIPE THE GAP" if you're setting the trap! 🎯

Gold Just Tapped the Trap – Ready to Bleed?🧱 Key Smart Money Zones:
Fair Value Gap (FVG) marked in the red zone between 61.8% – 70.5% fib retracement → textbook premium pricing 🧠
Price taps this FVG + OB zone, reacts bearishly → rejection candle confirms Smart Money filled up
📉 Fib Confluence Levels:
100% ➝ Swing High: ~3,234
0% ➝ Swing Low: ~3,204
Entry rejection zone was 3,217 – 3,224 → perfectly aligns with premium range
Price now returning back to equilibrium (50%) and heading toward discount levels (below 0%)
🔻 Bias: Strongly Bearish
Break of structure confirmed (from previous lows)
Rejection from FVG → confirms supply zone held
Large bearish imbalance below → price likely to seek that liquidity
⚔️ Entry Idea:
Entry: After price tapped FVG and printed bearish confirmation
SL: Just above 3,224.37 (FVG top)
TP1: 0% level @ 3,204
TP2: -27% @ ~3,192
TP3 (extended): -50% @ 3,191.25
RRR: 🔥 Easily 1:3+ if managed right
📢 Pro Tip for Ninja Traders:
Don’t chase the first candle — wait for the retrace into imbalance, look for rejection, and ride the wave back into discount zones. It’s all about flowing with Smart Money.
🧘♂️ Psychology Reminder:
"Liquidity creates opportunity. Rejection confirms intent."
Let them buy into premium → we sell with precision 🧠📉

BTC Reversal Starts Here – Smart Money Filled Up the OB! 🔄 Market Context:
Clear uptrend structure, forming higher highs
Pullback starts ➝ Lower timeframe shows bearish BOS
BTC wicks deep into bullish OB between 103,277 and 102,646
Liquidity sweep below the strong low @ 102,646 triggered ✅
Price now printing rejection from the OB zone 🚨
🧱 Key Order Block Zone:
Marked between 103,277 – 102,646 USD
Aligned with the golden zone (61.8%–70.5%)
Thick purple OB shows Smart Money’s interest 🎯
💸 Liquidity Zones:
Sell-side swept via wick under strong low
Next liquidity magnet: Buy-side Liquidity @ 107,141.59
Weak High @ 105,141.76 ➝ probable first stop 🛑
🚀 Trade Plan:
Entry: Tap and bullish rejection from OB
Stop Loss: Below strong low (102,646)
Take Profit: Partial @ 105,000 → Full @ 107,141 ✅
RRR: Estimated at 1:5+
📉 Why This Setup Rocks:
OB sits perfectly at fib retracement level
Strong low protected → Likely shift in structure next
Liquidity engineered before reversal ➝ Classic SMC recipe
📢 Pro Tip for Ninja Traders:
BTC loves to grab lows before sending price through the roof. If this 30M OB holds, higher TF (4H or 1D) could shift bullish again. This is not random—it’s engineered 📐
⚔️ Mindset Reminder:
"Patience is profit." You waited for the sweep, got OB confirmation, and now you're riding with the institutions 🧠💰

BTCUSD – 1H Long Setup | Discount Entry With RR 1:5+🧩 BTCUSD – 1H Reversal Play | May 5, 2025
We’re deep in Discount Territory, and the market just showed signs of strength with a bullish reaction from the OB. The Risk-to-Reward on this one is chef’s kiss 👨🍳💋
🧠 Smart Money Breakdown:
📉 Market Context: Prolonged bearish leg forming equal lows — liquidity engineered ✅
📍 Entry Point: EQ/OB level @ ~$93,736
🟢 SL: Below OB at ~$92,730
🚀 TP: Previous structure high ~97,912
🧮 RRR: Around 1:5+ (massive potential)
🔎 Narrative & Confluence:
🔄 Price reacting to OB zone after taking liquidity
🧲 Potential inducement below = liquidity swept
⚠️ Engulfing bullish candle = signs of LTF accumulation
📈 Expectation: Push back into premium zone above 97K
🧠 Execution Tips:
Set and forget, or trail aggressively above 94,800
Watch M15-M5 for CHoCH + order flow confirmation
Add to position on micro pullbacks with tight risk
Partial TP around 96,000 zone, full exit at 97,912
📣 Chart Ninja Tip:
“Discount isn't just a price zone — it's where patience meets precision. Let price hunt liquidity, then strike!”
💬 Drop a 💎 if you caught this sniper long.
📊 Save this setup and tag a fellow price action beast.
🔁 Share if your RR game strong today!

Equity Trade Setup – Marico Ltd. (NSE: MARICO)Trade Type: Momentum Breakout (Short-Term)
🔹 Trade Details
Buy Zone (Entry): ₹734.75 – ₹735.75
Current LTP: ₹736.80
Stoploss (SL): ₹727.00 (below swing low & 20 EMA)
Target (T1): ₹766.00
Target % Left: ~3.93%
🔍 Technical Indicators
📈 EMA Crossover: 9 EMA > 21 EMA > 50 EMA (bullish alignment)
📊 RSI: Near 60–65, with upward momentum (bullish)
🔺 Volume Surge: Confirming breakout from consolidation zone
✅ Client Advisory Summary
BUY MARICO LTD at ₹734.75–735.75 for a short-term breakout move.
Target: ₹766.00
Stoploss: ₹727.00
Timeframe: 1–3 Days
R:R Ratio: ~3:1
Confidence: High (based on EMA alignment, RSI strength, and volume confirmation)
For Education Purposes Only

XAUUSD – 30m Buy Setup | Fair Value Gap + Fib + Liquidity Sweep📈 GOLD LONG – May 6, 2025 | Smart Money Trade Setup
We're seeing an incredibly clean bullish setup form on Gold (XAUUSD) with textbook Smart Money Confluences:
🔍 KEY CONFLUENCES:
🟥 FVG (Fair Value Gap): Price tapped the FVG perfectly and respected it
📐 Fib Zone: Confluence of 70.5–79% retracement with demand reaction
💧 Liquidity Grab: Below short-term equal lows before bullish push
📉 Divergence: Internal lower highs vs external equal lows = engineered setup
🧱 Structure: Short-term bullish BOS (Break of Structure) above recent swing
📊 Trade Plan (Long Setup):
🎯 Entry: ~$3,325.6 (FVG zone base)
⛑️ SL: Below FVG at ~$3,323
🚀 TP: $3,404 zone (clean inefficiency magnet)
💥 RRR: 1:5+ sniper trade
🧠 Execution Notes:
Wait for LTF bullish structure shift confirmation (5m BOS)
Add confluence with volume divergence or SMT (Smart Money Toolkits)
Manage the trade once it reaches 3,350 zone
Break-even and partials at mid-Fib zone (around 3,352–3,360)
💬 Chart Ninja Wisdom:
"Price doesn’t lie—liquidity does. When price leaves a gap, Smart Money’s coming back for it."
📌 SETUP OVERVIEW:
Timeframe: 30m
Entry Type: Limit (FVG tap zone)
Bias: Bullish
Target: Clean inefficiency above
Type: High-probability setup with strong RR and structure support
💥 Tap 💾 to save this sniper setup.
📣 Tag your gold-trading crew & get ready for that pump!
📆 Watch how this plays out live—discipline > hype.
