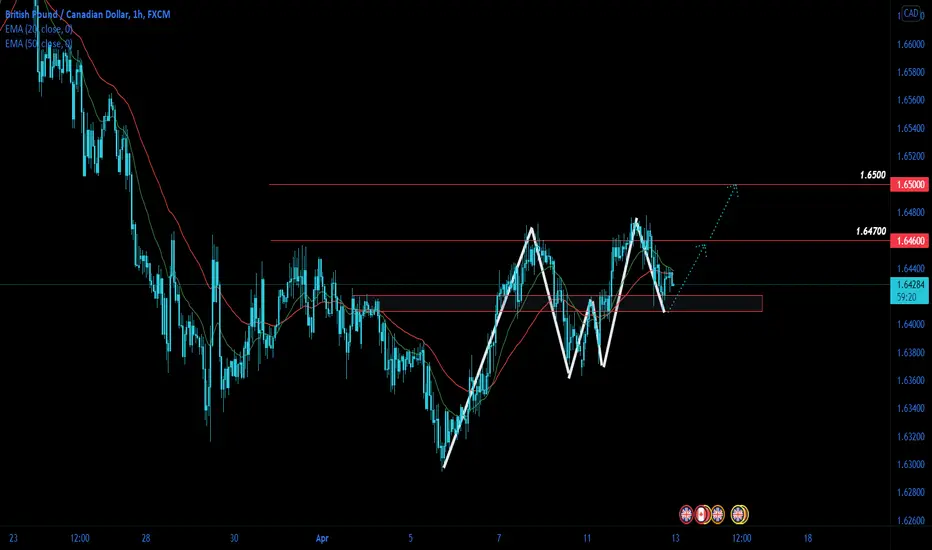
GBPCAD Target 1.6470 then 1.6500Looking to the upside - seeking bullish PA on a smaller time frame at demand zone highlighted. The setup will be contingent on bullish PA confirmation.
Riskreward
AUDCAD 0.93600 - 0.9300 Targets Looking short to the downside of 0.93600 then 0.9300. This is only my forecast and plan, execution will be based off smaller time frames on PA confirmation.

Japan 225 Approached Buy ZoneLooking long from the buy zone highlighted previously to the first upside target then second to follow.
Check linked Idea...

AMZN: Buying the dip? Watch these key points carefully!Hello traders and investors! Let’s see how AMZN is doing today!
In the 1h chart we see that it is trading near the support level of a Descending Channel. This is a good place for a bullish reversal, but so far, we don’t have a meaningful reaction.
The black line at $ 3,175.42 is the key point that could trigger a reversal, and the first target would be the 3,265.35. What’s more, it must break the 21 ema for good, which is another resistance for it.
Let’s see the daily chart for more clues:
In addition to the support in the 1h chart, the daily chart shows another important support level: The 38.2% Fibonacci’s Retracement. For now, AMZN is holding at this support area nicely, but it must break the $ 3,175 for some bullish confirmation.
AMZN is not one of my favorites right now, but it is looking interesting. Since it is near support levels, the Risk/Reward ratio becomes attractive again, and it is worth to trade it. The key point it must not lose in order to trigger a clear bullish sign is the 38.2% retracement in the daily chart.
Let’s keep our eyes open! I’ll keep you guys updated on this, as usual, so remember to follow me to not miss any of my future daily analyses!

GBPNZD Nice risk/reward ratioSome pretty strong resistance in the 1.89830 price region for OANDA:GBPNZD . This has been further supported by a consistent down trend throughout March (red trend line).

AMD: This is the most important support level!Hello traders and investors! Let’s see how AMD is doing today!
First, in the 1h chart, it is very bearish, and we don’t see any bullish sign on it yet. We are doing lower highs/lows, and we are trading under the 21 ema.
The most important resistance in the short-term is the $ 106 area, as it was the previous support level, and it is where the 21 ema is trading right now. If AMD wants to turn bullish again, this is the first resistance to break.
In the daily chart we don’t see any bullish candlestick/chart pattern as well, however, it is close to the support level at $ 99, which is a quite important one. If we look at the weekly chart, we can see it better.
The $ 99 area was a top level in January 2021, and it worked as a support level multiple times since then. It won’t be easy for AMD to lose this level.
The volume is increasing, which is interesting, and any bullish reaction could be an excuse to buy, as the R/R ratio makes a lot of sense. If it triggers a bullish sign, the gap at $ 118 (1h and D charts) would be our next target.
Let’s pay attention to this support level! I’ll keep you guys updated on this, so, remember to follow me to not miss any of my future analyses!

NASDAQ buy setup based on multiple rejections, waiting for price to get down to the POI and reject on the 1min
entry will be taken on the 1min, 15min entry is 1:40

9 Millionth Bitcoin Has Been Mined, Could We See a Pump?Monthly Time-frame
We have closed a green candle on March. Rejection area or the supply zone is at $47,100. Good to open short position at the moment. a test to the demand zone is also possible for stronger pump to the upside. Demand zone is waiting at $37,700. This is possible if the stock market starts crashing.
Weekly Time-frame
We still have 1D and 21 hours left for the next weekly candle. $42,486 is a test of the demand zone. We are currently in the low volume node in VPVR which is easy to break to the downside.
1D Time-frame
We are about to form double top as Bitcoin and Stocks usually does it to get more retailers to be greedy and fearful. then gets dump again. Awesome Oscillator is still bearish with red volume ripe for correction.
4H Time-frame
Our Long signal in the afternoon made us good profit. our signal in the evening is too early to short most have hit their stop loss already. The market usually makes double top to liquidate the short and long first before continuing the downtrend. We can expect more to the downside in the following days. Supply zone is being respected we can start opening short position at $46,517, $47,440 and keep stop loss above the previous high. SL at $48,548 to make sure not to hit the sl.
We will discuss more on the possibility on our Live. Stay tune and check with us!
Want more insights before US market open? Hit Like, Share, and Subscribe for more daily trading tutorial & cryptocurrency news
Trade Scholar, the best cryptocurrency educational community online!
Find the content above difficult to understand?
Feeling lost about how to trade?
Want to learn how to do your Own Price Prediction?
We endeavour to share you our investment knowledge & experience in order to help you starting your path to financial freedom. Follow, Subscribe & Join our Community to trade together!
Disclaimer: Above Technical Analysis is pure educational information, not Investment Advice. The information provided on this post does not constitute investment advice, financial advice, trading advice, or any other sort of advice and you should not treat any of the website's content as such. Do conduct your own due diligence and consult your financial advisor before making any investment decisions.

seems APE is in a Horizontal channelAPE has broken its parallel channel and move onto a horizontal channel short term i'm still bullish on this with 1:2 RR ratio, for long tearm it''s boooommm....

HYMC High Risk playNASDAQ:HYMC
STAKK analysis on the HYMC stock (www.hycroftmining.com)
Chart 1 Day
EMA (Exponential Moving Average): Bullish, as the 20EMA has crossed the 50EMA and 100EMA
Red line (20)
Orange line (50)
Blue line (100)
White line (200)
TTM Squeeze: Trending down, meaning momentum is low. Traders may be taking profits. Also notice that gap down on Nov. 9th has been filled.
Fib Levels: Above 2.618. The price has gone parabolic. Price action has to stay above this levels for the bullish trend to continue.
Candle Stick: Last few candles are bearish candles. last day candle is a "Bearish Pin Bar"
Pattern: Current pattern is an Ascending Triangle. This is a bilateral pattern with could result in either a bullish or bearish price action.
News: Hope coming earnings. On March 15th, AMC bought into the company ($194 Million)
History: Price have crashed on earnings report.
Bullish case: Price action could move to the $1.48 to $1.85 to $2.62 (each are major resistance areas).
Bearish case: Price could drop down to $.93 (1 fib) or $.73 (0 fib)

ETH swing trade So far so good.
we saw the squeeze in the end of the triangle.
We have seeing so gains already. This is for the middle term.
I posted new trade ideas don’t miss them out. Great risk and reward. Don’t forget to like very much appreciate it.
If YOU NOT a hater and support others like this post! It does MAKES A DIFFERENCE
This one Falls In our research on swing set ups with a good ratio of Risk and Reward.
As always er put quality over quantity, don’t forget to follow us for SWING trades research on risk and Reward Ratio.
Subscribe and don’t miss OUT the next research.
Swing trading is great because you can create a lot wealth in % by risking less $$. Compound Gains.
Thank you for the Love, I really appreciate those likes, makes a difference and pushes me to keep on posting more of these!

SOLANA Sol, it’s amazing REWARD ratio.
It can pay of really good. Breaking 50 MA.
Don’t forget to check my others trade ideas. Don’t miss out new ideas like and subscribe.
If YOU NOT a hater and support others like this post! It does MAKES A DIFFERENCE
This one Falls In our research on swing set ups with a good ratio of Risk and Reward.
As always er put quality over quantity, don’t forget to follow us for SWING trades research on risk and Reward Ratio.
Subscribe and don’t miss OUT the next research.
Swing trading is great because you can create a lot wealth in % by risking less $$. Compound Gains.
Thank you for the Love, I really appreciate those likes, makes a difference and pushes me to keep on posting more of these!

MATIC swing trade Great set up breaking 50 MA.
Looks like it will continue the run.
We relaxed for the las weeks waiting of price action.
Don’t miss out the next trades I will be posting today. Check them out and please like them. Helps a lot
If YOU NOT a hater and support others like this post! It does MAKES A DIFFERENCE
This one Falls In our research on swing set ups with a good ratio of Risk and Reward.
As always er put quality over quantity, don’t forget to follow us for SWING trades research on risk and Reward Ratio.
Subscribe and don’t miss OUT the next research.
Swing trading is great because you can create a lot wealth in % by risking less $$. Compound Gains.
Thank you for the Love, I really appreciate those likes, makes a difference and pushes me to keep on posting more of these!

AVGO: POTENTIAL 11% SWING TRADEAVGO :
I like the setup here with a well-defined risk .
Nice sort of ascending triangle that started forming in January.
Strong support of the ichimoku cloud at 596.
Can we break 610.40 and push to the previous high at 678 in the next few weeks?
No one knows. But the risk vs reward ratio is good, as you can set your stop for a 3% max loss (below 596) and your profit target to 678 (11% profit).
Swing trade for me.
Trade safe!

BTC-DAILY-WARNING DARK CLOUD COVER !Looking briefly at the ongoing weekly time frame picture we can see a TRIANGLE PATTERN IN PROGRESS and a recent price action attempting to downside breakout the WEEKLY CLOUDS SUPPORT LEVEL (37'516) intraweek low being @ 37'169.
RSI is below 50,@ 41.76
LAGGING LINE is roughly in the middle of the CLOUDS
UPCOMING WEEKLY CLOSING LEVEL WILL BE VERY IMPORTANT AGAIN TO LOOK AT AND WILL VALIDATE OR INVALIDATE ONCE AGAIN THE THIRD ATTEMPTING IN A ROW TO BREAKOUT THE BOTTOM OF THE WEEKLY CLOUDS SUPPORT
DAILY (D1)
Yesterday's price action triggered a DARK CLOUD COVER (BEARISH SIGNAL) with a closing level (39'444), below :
1) the clouds
2) the Tenkan-Sen
3) The Kijun-Sen
AND LAST BUT NOT LEAST BELOW "MY BAROMETER", THE MID BOLLINGER BAND (39'658)
The intraday low so far @ 38'244 also coincides with the ongoing uptrend support line and may be seen as a short term minor support
RSI @ 45.34
LAGGING LINE , below the clouds, the Tenkan-Sen, the Mid Bollinger Band and the Kijun-Sen
Overall, following the failure before yesterday to recover and hold sustainably above 42'524 ( have a look at my yesterday's analysis) and the yesterday's bearish price action, the GLOBAL DAILY PICTURE REMAINS HEAVY SUPPORTED BY THE ONGOING PERSISTING DOWNWARD PRESSURE ON THE WEEKLY TIME FRAME...
4 HOURS (H4)
The 78.6% Fibonacci retracement extension @ 38'329 has been filled.
Currently, below the clouds, Tenkan-Sen, Kijun-Sen and Mid Bollinger Band.
RSI @ 39.89
LAGGING LINE below all the important indicators !
No signal of short term reversal yet, in this H4 time frame
1 HOUR (H1)
Potential short term potential recovery (RSI bullish divergence) with an upside move, f or the time being pretty limited towards 39'000-39'500 , the latter level being the KIJUN-SEN and also the bottom of the H4 clouds resistance area.
CONCLUSION :
STRATEGIC PICTURE REMAINS GLOBALLY BEARISH and for the time being any recovery should be seen as a CORRECTIVE MOVE ONLY in a BROAD BEAR TREND and therefore, TACTICAL EXPOSURE (countrertrend ! ) should be managed accordingly in adopting a disciplined RISK REWARD APPROACH in having always in mind : IN WHICH TIME FRAME AM I TRADING, very short term, short term, medium or long term !
This methodology will allow you to put in place a trading plan which will be in perfect adequation with your objectives in terms of time horizon and targets.
On the upside I reiterate what I told yesterday, in that only a sustainable move above 42'524 on a daily closing level would force to a view reassessment of my strategic bearish scenario calling for lower levels, with, of course, due to this high volatility current environment, plenty of TACTICAL TRADING OPPORTUNITY which should, as previously mentioned, managed accordingly in placing trailing stop losses to protect your potential profits.
Do you like my analysis ?
If YES, please, do not forget to like it and for those who do not follow me yet on trading view, please add IRONMAN8848 on your following list and for those who do not have access yet to TRADING VIEW (the best trading application available for the moment) please sign up in clicking on the following link :
www.tradingview.com
Have a nice trading day and may your long goes up and your short goes down.
All the best and take care.
IRONMAN8848 & Jean-Pierre Burki

GBPNZD WE'RE SELLING !gbpnzd broke the bullish stracture with a nice double top and with a nice STOCH and RSI confirmation

Expanding my risk into the protected High I’m going to place my stop loss for price can easily take me out with a very tight stop on bitcoin. I’m also going to have another sell entry if price trades jntk the protected high structure and if price breaches that level then I’m out of this trade and my bias is no longer valid.

Things to Remember As the Market Dynamics ChangeA successful trader must be like a chameleon, willing to change with market conditions. Markets reflect the economic and geopolitical landscapes. The global pandemic changed many assumptions, forcing market participants to develop new skills to deal with the price carnage in early 2020. The impact of unprecedented central bank liquidity and government stimulus caused the need to pivot and adapt to new conditions.
Plan first- Trade or invest later
Risk-reward is critical
Leverage is a function of price variance
Stick to the game plan
There are always other opportunities in volatile markets
In early 2022, Russia’s invasion of Ukraine has turned the world upside down. The US, Europe, and allies worldwide support Ukraine by providing aid and slapping Russia with sanctions. However, the meeting between the Russian leader and Chinese President Xi at the Beijing Winter Olympics was a watershed event and may have set the stage for the incursion. China and Russia entered into a long-term $117 billion agreement for Russia to supply energy and other commodities to the world’s most populous country with the second-leading economy. The deal could make US and European sanctions toothless or lessen the bite on Russia’s economy as President Putin moves to take the former Soviet satellite back under his umbrella.
With the US, NATO, and other allies on one side and China, Russia, North Korea, and Iran on the other, the risk of a confrontation with nuclear ramifications dramatically increased. The pandemic has given way to a geopolitical crisis, requiring another pivot by investors and traders to deal with the current environment.
Volatility is likely to be the norm instead of the exception for the foreseeable future. The increasing price variance is a nightmare for passive investors but creates many opportunities for nimble traders with their fingers on the pulse of markets.
Success in markets always requires discipline, and increased volatility only makes discipline more critical. In early March 2022, we must remember the key factors that increase the odds of success in markets.
Plan first- Trade or invest later
Organization and planning are critical in life, and trading and investing are no exception. In a highly volatile market, planning becomes even more essential.
We follow three rules for considering any risk position:
Respect the market sentiment- The path of least resistance reflects market sentiment, making the trend your only friend in markets across all asset classes.
Write down your ideas, planning, organizing, and memorializing your thoughts. Referring back to the original justification for a trade or investment will remind you of the thought process.
Do not trade or invest for the sake of participating in any market. The risks in over-trading or investing without a plan increase with price volatility.
When considering entering any risk position, eliminate any emotional impulses by ignoring the news cycle and so-called “expert” advice. The price action is the most objective view of the market’s interpretation of the geopolitical and economic landscapes.
Risk-reward is critical
Any plan needs to outline the risk tolerance, which must be a function of profit targets. We follow three rules regarding risk versus reward:
The risk-reward equation should be at least 1:1, meaning do not risk more than your expected profit level.
Higher price variance should increase the expected reward level compared to the risk. Even the most successful traders call the market’s direction wrong more than right. A higher reward target versus risk increases the potential for success over time, allowing for small losses and higher profits.
Never increase the risk level because an asset price moves contrary to expectations. Admitting you are wrong can be humbling, but it is a critical element for financial survival.
Risk-reward is the essential part of a plan that establishes the discipline necessary for success. Risk-reward levels should always reflect price variance, and higher price volatility requires more expansive risk-reward levels.
Leverage is a function of price variance
Leverage can be a blessing or a curse. Greed and fear are impulses that drive human behavior.
Leverage levels should always reflect market volatility.
In volatile markets, reduce leverage to protect capital.
In static markets where volatility declines, increasing leverage is more appropriate.
When risk positions are in the money, greed drives us to feel we are not long or short enough. Fear makes us believe we are too long or short when they are out of the money. A plan and the appropriate leverage will help avoid listening to the little voice in our heads that incites the fear and greed impulses.
Stick to the game plan
Mike Tyson once said, “Everyone has a plan until they get punched in the mouth.” Markets are not forgiving when they move against our expectations. Sticking to a game plan prepares you for the sock in the kisser.
The risk level should be set in stone at the beginning of any trade or investment.
It is acceptable to increase reward horizons when prices move in our favor.
A risk position is always long or short at the current price, not the execution price.
Assess risk at each price level and adjust levels accordingly.
Adjust risk levels using trailing stops when an asset’s price moves in the desired direction.
Never allow a profitable position to become a loser by expanding the original risk level. Protect capital by protecting profits and have the fortitude to take small losses by sticking to the original game plan. When prices move contrary to expectations, admit to yourself you were wrong. When prices move in your favor, do not allow greed to creep into the plan.
There are always other opportunities in volatile markets
Most traders or investors will miss many trades and investment opportunities. Do not despair! In volatile markets, there is always another opportunity right around the corner.
Markets reflect the geopolitical and economic landscapes. The dynamics have dramatically changed with Russia’s invasion of Ukraine. Elevated volatility in markets across all asset classes will be the norm, not the exception.
When approaching markets, do the work and write down a plan. Make sure it has a logical risk-reward balance that reflects price variance before executing a buy or sell order. Follow the rules by sticking to your plan. Eliminate fear and greed emotions by establishing comfortable risk-reward levels.
A successful approach to trading and investing requires a portfolio approach. No one trade or investment should determine overall results. There are no guarantees in any markets, but following rules, sticking to a plan, and eliminating emotions will improve your chances of long-term success.
Be careful in markets as the dynamics have changed.
--
Trading advice given in this communication, if any, is based on information taken from trades and statistical services and other sources that we believe are reliable. The author does not guarantee that such information is accurate or complete and it should not be relied upon as such. Trading advice reflects the author’s good faith judgment at a specific time and is subject to change without notice. There is no guarantee that the advice the author provides will result in profitable trades. There is risk of loss in all futures and options trading. Any investment involves substantial risks, including, but not limited to, pricing volatility, inadequate liquidity, and the potential complete loss of principal. This article does not in any way constitute an offer or solicitation of an offer to buy or sell any investment, security, or commodity discussed herein, or any security in any jurisdiction in which such an offer would be unlawful under the securities laws of such jurisdiction.


What goes up must come down. Lumber 101Whenever I open up a chart of any asset I like to look at the big picture first pulling up the oldest chart I can find. With Lumber chart I could instantly recognise a pattern called diagonal. I labelled it a Supercyclic wave as it has taken nearly 48 years to complete.
After the competition of this pattern usually you can expect a bear market as a correction. Correction takes place both in time and price. In this case of lumbar we had a very quick correction of 73.45% in price as a first leg in May 2021 only lasting 3 months. Now i think that a Bull market that lasted 48 years corrected only in 3 months and the correction has finished as we are already up 190% from August 2021 lows, does not seem very convincing.
So I expect the price to reverse close to ATH again and keep moving up and down like a kangaroo for a long time. So far it's looking like a Zigzag pattern.
Am going to have 3 attempts as a short with proper risk management.
The Trade
Short at 1200
Stop Loss - 1311
TP 1 - 843
TP2 - 618
This is not a financial advice. I am a degenerated gambler so wish me luck.

AUDUSD - SHORT!Hi All,
While there are both possibilities, I am Short biased on AUD because it offers a very good RR.
What are your thoughts?
Note: This is not a financial advise.

ETH! $$ swing tradeIt might be the time we been waiting for. The chart is explained very well.
Amazing RISK REWARD! I
If YOU NOT a hater and support others like this post! It does MAKES A DIFFERENCE
This one Falls In our research on swing set ups with a good ratio of Risk and Reward.
As always er put quality over quantity, don’t forget to follow us for SWING trades research on risk and Reward Ratio.
Subscribe and don’t miss OUT the next research.
Swing trading is great because you can create a lot wealth in % by risking less $$. Compound Gains.
Thank you for the Love, I really appreciate those likes, makes a difference and pushes me to keep on posting more of these!
Ñ

Risk On Risk Off Helpful Proces Spy VS Btc VS Dollar Dxylets review Risk On Risk Off Helpful simple process Spy VS Btc VS Dollar Dxy also Remember trading is risky .
Hi traders
over the past 28 years trading this correlation has been simple and helpful as an added barometer of assets movements that you can add and watch in your tradingview charts with no extra indicators.
Over time the dollar has always been perceived as a strong stable currency and when people move dollar up it is usually perceived as a defensive move by market participants and therefore a risk off situation for speculative assets.
Usually what is helpful lately is looking at the SPY vs BTC and compare to the dollar DXY representing safety.
Usually dollar Up = SPY + BTC down = Risk Off
and vice versa
Usually dollar Down = SPY + BTC Up= Risk On
Hope this video was helpful
