USDJPY BREAK AND TEST Usdjpy technical analysis:
h1 chart: price is above 200 hour sma and has tested a support zone (highlighted in orange) that corresponds at 0.382 fibonacci retracement from the last impulse.
The pair is in a general uptrend in bigger timeframes as h4 and daily.
There are good chances that usdjpy can push higher towards the main resistance, already tested two times.
Pay attention to news of tuday on pending home sales and durable good orders for USA.
Use a proper money management
Riskreward

POHKONG. Risk/Reward Trade. 25/Feb/22POHKONG. Potential having more than > 5:1 "Very Good" reward-to-risk ratio trade setup, As current price of Rm0.865.. As Risk 13.29% VS 102.31%...

short term sell Gold @ 1895 Trendline breakdown in Gold - Short term view
short term sell Gold @ 1895
Target - 1875 $
Stop loss @ 1902


ADA at demand zone.Hello to everyone,
ADA is testing once again the psychological support at $1.00. This level was tested successfully several times in the past. A bullish confirmation will come after the bearish trendline break out and a stronger signal after the resistance break - near $1.50.
The current price gives a high R/R ratio for long positions.
Current tensions between Russia and Ukraine may drag markets even lower but I don’t believe this can affect the markets in the long run.
If the support level break, I think it will be for a short period of time – maybe a few days.
Market seems healthy, so be careful with your short positions.
Stay to your plan & always do your own research.

SOFI: Many GOOD chart patterns around SUPPORT level.Hello traders and investors! Let’s see how SOFI is doing today! We’ll do a complete Multiple Time Frame Analysis (MTFA) and analyze the H, D and W charts.
First, we see that SOFI is doing what seems to be an Ascending Triangle chart pattern in the 1h chart. It is reacting near its support level, which is expected, and in theory, it is heading to the resistance at $ 13.41.
As someone who’s out, I see SOFI as a possible buy opportunity, as the Risk/Reward ratio makes much more sense for long trades than short trades. The time to short was at $ 24, when it did a Double Top pattern in the daily chart, now it makes sense to buy. Speaking of daily chart:
I see an inclined Inverted H&S chart pattern, which is a bullish reversal structure. If SOFI triggers upwards its Ascending Triangle in the hourly chart, we’ll probably see a confirmation of a breakout of this IH&S in the daily chart. This dual-pattern confirmation is quite interesting to see.
What’s more, this reaction couldn’t come in better time, as seen in the weekly chart:
In January, we just retested its support near the IPO price level, around the $ 11, and SOFI is trying to stabilize now. The volume is increasing, another good indicator, and if it confirms the patterns we discussed before, it could seek the next resistance at its 21 ema, or even the $ 16 again.
This is why I’m telling you, the Risk/Reward ratio is attractive, however, we must wait for better signs around. If you are already in, you must keep these points in mind, especially the support at $ 11, which SOFI must not lose at all cost.
I hope I helped you here, and I’ll keep you guys updated on this, so, remember to follow me to not miss any of my future analyses.

Nifty 16th FebOverall direction: Flat opening or Partial gap-up
Structure: Measure the Impulsive trend (No Fresh buying whether breakout)
Sentiments: Negative/Partial Volatile
Support: 17200, 17100
Resistance: 17450, 17500
Expecting consolidation then breakout/breakdown
*For knowledge purpose only & subject to market risk.

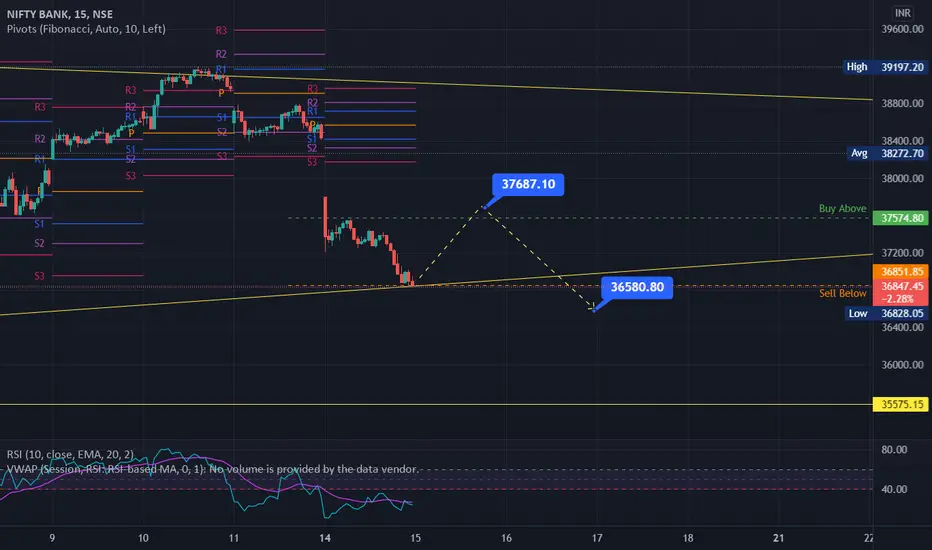
Banknifty 15th FebExpecting for Gapup/Short covering,
Overall direction: Negative continuation
Support: 36500
Resistance: 37000, 37500
Sentiments: Negative/Partial Volatile
*For knowledge purpose only & Subject to market risk.
Nifty 15th FebExpecting for Gapup/Short covering,
Overall direction: Negative continuation
Support: 16600, 16500
Resistance: 17000, 17300
Sentiments: Negative/Partial Volatile
*For knowledge purpose only & Subject to market risk.

My model Of Risk ManagementHello Traders!
First of all, I must tell you that trading is 90% psychology 9% is Method and 1% is your deals/trades that you put.
Discipline is the most important part of psychology and there are some factors that keep your discipline alive and one of them is Risk Management.
The trading method has more importance than RIsk Management and if you are trading from methods that are available on the internet then I will say RIP because the knowledge available on the internet is complete trash because it needs lots of modification before applying on a live account. Learn yourself and work hard, Create your own method with a personal trading style and if you need any help then I am here to help you.
Why do we need Risk Management?
Risk management helps you to deal with uncertainty. If we look at the fact that 90% of the traders lose money then there is no difference between you and 90% of the traders if you completely ignore risk management.
If you have not planned your Risk management yet then here is my model of Risk management.
In my model, I only take 2% of the risk per trade and we will only trade if the trade will provide 1:3 or more Risk: Reward. Good risk-reward is the only key that will keep growing your account.
My average Risk:Reward ratio is 1:4 and my win rate is close to 60%.
Here is an amazing calculation.
Suppose your trading balance is 1000$ so you will trade with 10% of the account which is 100$ and trade with 10x leverage and your stop loss must not be more than 2% means if you lose you will lose only 20$ which is 2% of the trading balance and according to my method our target will give you 1:4 means you will gain 80$ at the target.
If my accuracy is 60% then if we trade 10 trades in a week means
We lost 4 trades and with every trade we lost -20$. So -20$X4 = -80$
We won 6 trades and with every trade, we made 80$ profit. So 80$X6 = 480$
In the end, we will make 480$-80$ = 400$ easily.
That's the power of Risk management also it's a power of a Good trading Method.
Here is another Example
If a method provides 1:3 R:R with 50% accuracy then here is another interesting calculation
If we trade 30 trades in a month means we will lose 15 and will win 15.
Same as above we will trade with 10% of the account which is 100$ and trade with 10x leverage and stop loss is not more than 2% and the target is 6%. (This is an average calculation of your all trades.)
We will lose -20$ per trade and with 15 losses we will lose 20$X15 = 300$
We will gain 60$ per trade and with 15 wins we will gain 60$x15 = 900$
So in the End we will gain 900$-300$ = 600$
Even with a bad win rate, you will definitely keep growing your account.
It doesn't matter if you lose 3-4 consecutive trades. You will definitely make money and will end up in profit.
Also, remember I told you Method is more important than risk management and if you don't have a good method then work on it or follow my trades until you create yours.
Don't forget to hit the like button and follow to stay connected.

Another BNB trade completionI'm not really good but I make sure my stoploss is tight, and you know what's good,? It doesn't hit my sl. Only very few times. Now we have another TP

Could this be the missing piece to your puzzle? Let's find out!A quick rundown of my perspective on analysis and also the execution side of trading, specifically money management and how emotions can impact your profitability more than you realise.

GBPNZD ShortPrice has been bullish for several days. We have spotted the first signs of price exhaustion which signals a potential bearish correction.
We currently are waiting for price to create and intraday bullish correction and enter on the retest of the higher time frame key level before entering short.
Risk Reward for the trade is a potential 7.28 to 1.
Lets keep our charts simple as less is more.

5 KEY points to control FOMOHi Traders,
FOMO is a VERY real thing and in this post, I wanted to share with you 5 key points that has helped me control my psychology around this throughout my trading journey.
1. Accept the market can go in any direction; Neutralize your mindset:
The market changes very quick on any given basis and just when you think you have a perfect set up, it could take a turn and make profits turn into losses in matter of seconds. As you analyze the market, you need to have a neutral mind set understanding that price can go either way and as structures develope, you may need to change your bias and take a step back to look at the price action in a different view. If you approach the market in a neutral mind set, you are not "marrying" your set up and this helps reduce your emotions and builds your psychology.
2. Risk Management:
Risk Management is the holy grail in trading. If you cannot control how much you risk, you are simply gambling. Losses are inevidable in trading and you need to understand you will always endure them, but keeping the risk at minimal (1%) will sustain your capital to be able to continue trading. Keeping the same risk on each and every trade and maximizing your reward ratio will help you compound your profits and eventually your losses will be outweighed by your rewards.
3. If you missed the first entry, there will ALWAYS be another one:
Often traders will try and chase a massive drop HOPING that price will push down further when in fact could catch you with your pants down. Understand that there will ALWAYS be another entry that may fit your trading plan. If you missed the first one and start chasing volatility rather then sitting on your hands waiting for another confrmation, your judgement gets clouded which will the create revenge trading, greed, FOMO and capital loss.
4. Take what the market gives you; leave your EGO at the door:
Any experienced trader will tell you to check your EGO. Just because you THINK the price will go to your target, it doesn't mean that it will. Price does not need to reach your target for you to be profitable, taking your profits as the market gives you will make you profitable. As the market moves and creates structures, at times it may not be ready to continue to rise or drop and that is why you need to manage your trades accordingly and adjust your mindset to acheive this in order to avoid uncessary losses.
5. Have a Trading Plan & Follow your Trading Plan:
Having a Trading Plan is key in order to know when to get in or out of the market. If you are unable to identify your profit targets/stop levels, entries, exits etc. you are doomed to fail. Following a plan will help with consistency along with many other areas towards the road of success. Implementing a plan is just one area which will help gain confidence in this business, its what that plan entales which will help you succeed in this business.
Every trader that has they're own trading style, plan, management and mind set and there is NO right or wrong in trading as long as you are following your plan and your decision meets your criteria.
I encourage every trader to review your plan and make necessary changes as your journey continues to achieve greater results.
Leave a comment and and share your thoughts around this topic :)
Click the like button if this has helped you! Support more of these to help our community!
Enjoy your weekend!

Smooth Love Potion (SLP) broke out longest channel.Hi dear friends, hope you are well and welcome to the new trade setup of Smooth Love Potion (SLP) token.
On a daily time frame, SLP broke the longest down the channel. There is also a bullish divergence as priceline is forming lower low and RSI is setting higher low.
Buy between: $0.022 to $0.03
1st target: $0.04
2nd target: $0.06
3rd target: $0.10
Final target: $0.35
Stop loss: Below the support of $ 0.0175
Note: Above idea is for educational purpose only. It is advised to diversify and strictly follow the stop loss, and don't get stuck with trade.

Fomo Buyers, Looking for a day trade, correction for liquidity3:1 RR
Fomo Buyers will get washed out 50% of the time
as long as a solid risk to reward is maintained
this is profitbale for me
We have Pinned the Daily/Weekly Strucutral High
This is the reason for the entry

AAPL: Possible scenarios and complete analsis.Hello traders and investors! Let’s see how AAPL is doing today!
In the 1h chart, we see a classic Triangle chart pattern. We don’t know to which side we’ll see a breakout, but we can work with some scenarios and set strategies.
If we break downwards, I see AAPL at its Fibonacci’s Retracements, preferably the 61.8%. By breaking upwards, we would seek the next resistances, which we see better form the daily chart.
The next resistance on AAPL is the $ 177, and the second one is the $ 182.94, the ATH. To me, the Risk/Reward ratio is more attractive for short trades, in the short-term, at least. However, since we are above the 21 ema (which is pointing upwards), and the bias seems to be slightly bullish in the mid-term, the odds might favor the bull on this one.
What’s more, since the beginning of the month it has been moving sideways with low volume, indicating that this could be just a harmless sideways correction before it could go up again.
Long-term speaking, AAPL is still very bullish, as we just hit our previous support at the black line 2 weeks ago ($157) and it reacted amazingly well after this. The 21 ema is another support, and it is working very well too.
The next few days are going to be decisive. Let’s keep our eyes on this Triangle in the 1h chart for now.
If you want to keep in touch with my daily analysis, remember to follow me and I’ll keep you updated.

GBPCHF ShortWe have a strong downtrend because at the daily timeframe we are at the resistance.
At the 4H timeframe we can open a short position because the trend line has broken and retested.
Also indicators confirm the short position.
Stay tuned for more awesome technical analysis.
Cheers :)

FEW SIMPLE TIPS TO IMPROVE YOUR TRADING PERFORMANCEToday we prepared for you few simple tips that may help you improve your trading performance.
Please feel welcome to share your own tips in the comment section.
Educate yourself.
No trader can become successful without spending plenty of time studying charts, fundamentals and technicals. Nowadays, there are plenty of financial gurus and trading courses which claim to offer knowledge that will transform you into a professional trader in just a short amount of time. Unfortunately, most of these services offer only shallow information that has no use in the real trading world. In our opinion, literature written by renowned traders and economists offer more profound knowledge and usually at better cost.
Analyze your trades and strategies.
Analyzing your past trades and strategies can help you learn from your mistakes. Additionally, it can help you recognize what you did correctly and what works for you.
Do not trade without a proper trading plan.
Each trade should have a proper trading plan. This plan should at least consist of entry/exit points and risk/reward evaluation. However, creating different scenarios for each trade can help you navigate the market even better.
Evaluate your risk/reward associated with each trade.
Each trade has a risk/reward ratio tied to it. Generally, a risk/reward ratio of 1:3 or more is preferable.
Do not chase the market when you are not sure where it is headed next.
There are times when the market is very volatile and experiences swings from side to side. Often, in such times, a trader may be unable to tell where the market is headed next. On such occasions it is usually better to take a step back and not to trade. This can help avoid loss of capital due to whipsaws.
Take a time off after the winning streak.
Winning streaks often result in confidence being gained by a trader. However, many traders tend to get overconfident which usually leads to loss of capital that has been amassed through the winning streak. Therefore, it is usually better to take some time off trading after substantial gains were made.
Take a break from trading after the losing streak.
Losing streak can negatively affect a trader's decision making. It can often result in loss of confidence and a needy feeling to make money back. However, a trader should resist these urges and take some break from trading. This is mainly because if a trader does not have confidence, it is much harder to execute trade properly.
Do not overtrade.
Sometimes there are no good trading opportunities. In such times it is usually better to take the role of market observer instead of trying to make money at any cost.
DISCLAIMER: This content serves educational purposes only. It is not financial advice.

$HUT primed for a rip? BTC up, do miners make a run?With BTC/crypto finding support going into the weekend, crypto miners are set to make a run for the week of 2/7/22
I traded $HUT in the past on it's run to it's high of $16.57.
Many bag holders on the route back to that high, so I would expect selling pressure on any movement to the upside.
Not expecting a run to $16 in the coming week, but a run to $9.00 definitely looks possible
Drew some crystal gazer tarot lines (lol) from recent high bullish volume points that create a channel that looks primed for a break out
1st PT: 7.09
2nd PT: 8.10
3rd PT: 9.00
$5.8 range is support/technical exit level
Watching for confirmation of break of 50EMA for further movement to the upside
BTC/crypto sentiment will weigh heavily on the momentum of movement - bullish and bearish
Many of these miners are great for trading to grow small accounts, and often run parallel with BTC/crypto sentiment
As always, stay sharp, and manage your risk! Good luck!
Senor C
*Not financial advice*

GBPJPY Day Trade Idea // Price Action TradingGbpjpy can move quite a bit. It can be a blessing and curse.
Mentioned previously in the > JPY Weakness Post, we discussed potential JPY weakness
, given current market sentiment leading up to interest rate announcments for the GBP and the EUR.
Very bullish Price action confirming our bias, this means buy the pullback
>> and aim for good risk reward
>> be confident in your decision
>> embrace a probabilistic mindset
>> When you take wins, don't be surprised because that's what you were looking for in the market.
>> Losses suggest higher volatility that you didn't anticipate correctly, or you are simply outright wrong with your analysis, and you should go to the Higher time frames , and this will give you your answers, with appropriate reasoning and logical thinking
