Gold short target reached As our analysis stated, We reached the target. We will see if we see more down side to do.
Thank you for the support and trust. Don’t forget to like to support so I can keep doing análisis
Riskreward

EURUSD and Buy Area (14/6/2021)EURUSD and buy area
Detail in chart..
RR 1:4 (TP1)
RR 1:8 (TP2)
Disc. On

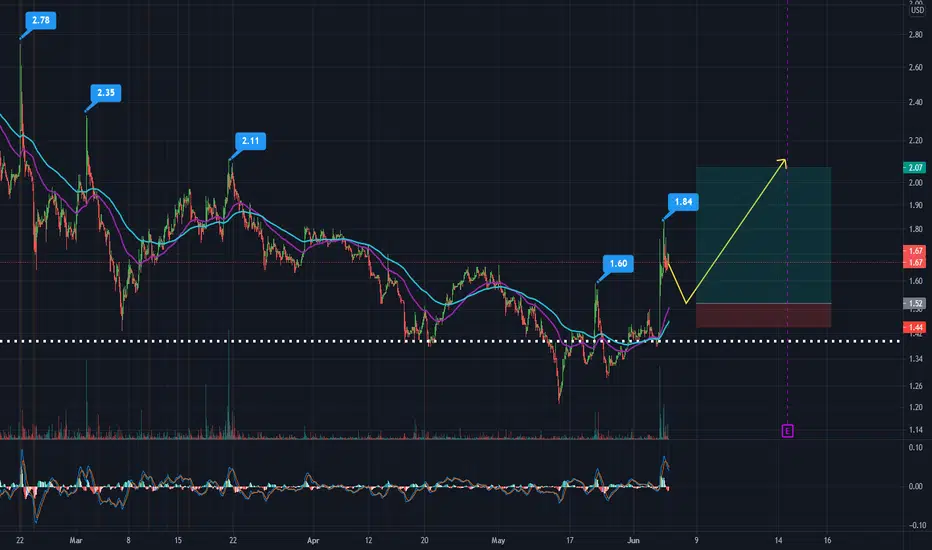
XAGUSD Down ward expectation!Base on the chart, price reached a major resistance area and a strong rejection have happened on 3rd of June and now the market reattempt to get its previous price but it failed which can be good sign of weakness on buyers at this area and on the other side, it can show the strength of sellers at this area.
So based on this scenario I prefer to be seller at this area with a good risk reward ratio about 1:4 which means low amount of risk and good potentiality of profit.
Note: As always please take risk management rules into consideration before opening any position on the market.
Good Luck!

GBPUSD Sounds a good buy opportunity!Based on the chart, we can found a very good market range since about 26 days ago! So we should have a good strong support and resistance which took price among them. An now price is on the support zone and remember before this ranging market, we had a good uptrend movement!
So I opened a buy position at this support area and will hold it until it reaches to the specified areas on the chart which can provide me a reasonable risk reward ratio(about 1:3.5)
Note: As always please take all risk management rules into consideration before opening any position on the market.
Good Luck!

Long Term Gold TradeBetween 5th and 31st March we saw that the Gold Market was in a downtrend but also indications that a reversal would take place due to a Double Bottom candlestick formation.
Reason For Trade Entry- Market Pullback followed by Engulfing Candle, anticipating that price will continue to rise.
SL is @Breakeven and TP1,TP2 and TP3 targets have been hit!!

Dodge support Is getting in a nice support.
Risk and reward is really good.
I would keep an eye on this bad boy.
Don’t forget to follow me for more ideas

ETH/USDT - considerable potential 67% movement after correctionHello, Traders!
The interest in altcoins begins to fall gradually. Traders are progressively fixing their positions in altcoins in favour of BTC, so Bitcoin's dominance begins to increase incrementally.
In such a situation, it is possible to look for ETH purchases on a deep correction, after the stops of aggressive buyers are collected.
It's best to wait for the price to move into the $1960 - $2140 zone and search for buy entry there.
A stop-loss can be placed below the level of $1740.
The targets for such purchases will be
$2488
$2800
$3000
$3200
$3590
Perfect risk/reward ratio of 3.60!
Good luck and watch out for the market!
P.S. This analysis is created for educational purposes and shall not be considered a piece of financial advice

LONG Black BerryI was on WSB reddit and i saw something like " BB is next "
Mybe i'am wrong but look at volume " damnnnnn "
Target on forum is 75$ ( 400% )

Gold Short setupIt is looking like it’s going to get support at 1840.
The dojo that is formed and breakout of pattern isn’t looking to great.
We might see extra support on 50 moving average

CARDANO- ADA Great support It’s getting a great support previous resistance.
We might see this bad boy getting at previous resistance 2.50-3$.
The risk and reward is also great. Eth it has been dealing with a lot demand as well

As requested, here it is my analysis on MTNB!As another request, I’ll analyze MTNB today! This time for @D0981237654!
The stock has low liquidity, so, the intraday chart is hard to read. But we have some good signs in the daily chart. We have an inverted head and shoulders + an advanced breakout on the RSI.
In the weekly chart we are above an interesting support level. If I had to do anything here, I would buy, set a stop-loss under 0.72 and aim for the 1.70, or even the 2.20. Good risk-reward ratio!
If you liked this trading idea, remember to click on the “Follow” button to get more trading ideas like this, and if you agree with me, click on the “Agree” button 😉.
See you soon,
Melissa.

XAUUSD Good opportunity for buyers!Based on the chart, a resistance area is broken and after a while price dropped on this zone which acts as support right now, and a good rejection is about to happening. So this rejection can be a good sign of the strength of buyers and on the other side, the weakness of sellers at this area.
So based on this scenario I opened a buy position with a low amount of risk and good reward potentiality which is about 1:3.5
Note: As always please take risk management rules into consideration before opening any position on the market.
Good Luck!

IGC PullbackIGC started yesterday pretty good, I expect a pullback followed by an bullrun until earnings.
Risk/Reward looks good - Stop Loss at 1.44$.
How to read a Chart: Quick and dirty charting tipsHope you find this useful!
the levels could be more precise, but just to show you how levels can be useful!
Link me on any questions,
Cheers,
C

how to risk smartly? position sizing, risk n reward, SL n TP 👌Risk refers to the probability of a negative event happening in your activities; an event that goes contrary to your intended outcome. Risk is part and parcel of the cryptocurrency trade. It is the chance of an undesired outcome on the trade, which translates to making losses. For instance, a 50% risk on a short position simply means that there is a 50% probability that the Bitcoin price will rise, resulting in a loss on your part.
Today, we take you through the simple rules to follow when managing risk in crypto trading.
Types Of Risk
The crypto trading world is exposed to four main types of financial risks:
Credit Risk
This risk affects crypto projects. It is the probability of the parties behind the crypto project failing to fulfill their due obligations. Credit risk is mostly attributed to theft and fraud in the crypto market. A good example is the hacking of Binance in 2018, which led to over $40 million loss.
Legal Risk
Legal risk refers to the probability of a negative event occurring with respect to regulatory rules. For instance, a ban on cryptocurrency trading in a specific country. A practical example of legal risk is when the states of Texas and North Carolina issued a cease-and-desist order to Bitconnect cryptocurrency exchange due to suspicion of fraud.
Liquidity Risk
Liquidity risk in respect to crypto trading refers to the chance of a trader being unable or incapacitated to convert their entire position to fiat currencies (USD, YEN, GBP) that they can use in their every-day spending.
Market Risk
Market risk refers to the chance of coin prices moving up or down contrary to your desire in an open position.
Operational Risk
Operational risk is the chance that a trader is unable to trade, deposit, or even withdraw money in their crypto wallets.
Main Risk Management Strategies
The rule of thumb in crypto trading is: “Do not risk more than you can afford to lose.” Given the gravity of risk in crypto trading, we generally advise traders to use not more than 10% of their budget or monthly revenue. Also, trading with borrowed money is not advisable as it puts them in a credit risk position.
Risk management strategies can be broadly categorized into three: risk/reward ratio, position-sizing, as well as stop loss & take profits.
1. Position Sizing
Position sizing dictates how many coins or tokens of cryptocurrency a trader is willing to buy. The probability of realizing great profits in crypto trading tempts traders to invest 30%, 50% or even 100% of their trading capital. However, this is a disruptive move that puts you at serious financial risks. The golden rule is: never put all your eggs in one basket. Here are three ways to achieve position sizing.
Enter Amount vs Risk Amount
This approach considers two different amounts. The first involves money you are willing to invest in every single deal. We advise traders to look at this amount as the size of each new order they take, regardless of its type. The second involves money at risk, i.e. the money that you stand to lose in case the trading fails.
This is how you define your enter amount:
A = ((Stack size * Risk per Trade) / (Entry Price – Stop Loss)) * Entry Price
Let’s say we wish to purchase BTC with USDT with a target of $13,000. Our parameters would be:
Stack Size: $5,000
Risk per Trade: 2%
Entry Price: $11,500
Stop Loss: $10,500
Our enter amount would be:
A= ((5,000 * 0.02) / (11,500 – 10,500)) * 11,500 = 1,150
The ideal amount to invest in this deal is $1,150 or 23%. However, due to our Stop Loss, we only risk 2% as it will stop the trade once it reaches the determined level.
Risk trading in cryptocurrency
Elder’s “Sharks” and “Piranhas”
This concept of position sizing relates to diversifying your investments. Dr. Alexander Elder, who is credited with the concept, suggests two rules:
Limiting every position to 2% risk. Elder compares risk to a shark bite. Sometimes you would wish to risk a huge amount, but the risk would be huge and catastrophic as a shark bite.
Limiting trading sessions to 6% per session. In a losing streak, you may end up spending everything you own little by little. Elder compares this risk to a piranha attack, which takes small bites of its victim until it consumes it all.
Following Elder’s sharks and piranhas approach results in no more than three open positions per 2% each or six ones per 1%. Limiting results in reverse compounding; losses get smaller and smaller with each subsequent loss you make.
Kelly Criterion
The Kelly criterion is a formula developed by John Larry Kelly in 1956. It is a position sizing approach that defines the percentage of capital to bet. It suits long-term trading.
A = (Success % / Loss Ratio at Stop Loss) – ((1 – success %) / Profit Ratio at Take Profit)
Using the previous example, the features would be:
Stock size: $5,000
Invested Amount: $1,150
Success %: 60%
Entry Price: $11,500
Stop Loss: $10,500
Loss Ratio: 1.10
Take Profits: $13,000
Our result would be:
A = (0.6 / 1.10) – ((1 – 0.06) / 1.13) = 0.19
This means you should not risk more than 19% of the entire capital of $5,000 for you to arrive at the best possible outcome in a series of deals.
2. Risk/Reward Ratio
The risk/reward ratio compares the actual level of risk with the potential returns. In trading, the riskier a position, the more profitable it can get. Understanding the risk /reward ratio enables you to know when to enter a trade and when it is unprofitable. The risk/reward ratio is calculated as follows:
R = (Target Price – Entry Price) / (Entry Price – Stop Loss)
From the previous illustration:
Entry price: $11,500
Stop Loss: $10,500
Target price: $13,000
Our ratio would be:
R = (13,000 – 11,500) / (11,500 – 10,500) = 1.5 or 1:1.5
A ratio of 1:1.5 is good. We advise traders not to trade with a ratio lower than 1:1.
3. Stop Loss + Take Profit
Stop Loss refers to an executable order which closes an open position when a price decreases to a specific barrier. Take Profit, on the other hand, is an executable order that liquidates open orders when the prices rise to a certain level. Both are good approaches to managing risk. Stop Losses save you from trading in unprofitable deals while Take Profits let you get out of the trade before the market can turn against you.
You can make use of Trailing Stop Losses and Take Profits which follow the rate’s changes automatically. Such a feature, however, isn’t available at the majority of crypto exchanges. Fortunately, with crypto terminals like Superorder, you can set your Trailing Stop Losses and Take Profits right from the terminal.
Winning Strategies
Accept Failures
Risk is part and parcel of trading. Besides, we cannot eliminate it but only manage it. You should, therefore, accept your losses and rely on plan-based decision making to realize profits in future trades.
Consider Fees
New traders often do not know the fees that come along with trading. Such include withdrawal fees, leverage fees, etc. You should consider these in your risk management.
Focus on the Win Rate
Risks will always be there to discourage you from trading. However, focusing on the number of times you win helps to develop a positive attitude in trading.
Measure Drawdown
This refers to the total reduction of your initial funds after a series of losses. For instance, if you lost $1,000 from $5,000, your measure drawdown is 10%. The higher the amount, the more you would need to inject into a trade for it to recover. As Dr. Elder advised, stick to a 6% risk limit.
Please click LIKE button and Appreciate my hard work.
Must follow me for latest crypto real time updates.
Thank you.

Waiting for the next opportunity! 🤓PLTR is doing good movements today! And here it is the strategy I’ll use on it:
If it breaks the red line, it’ll likely hit the 23.34. Then I’ll just wait for a good reversal candlestick / chart pattern around. If it doesn’t hit there, then I’ll trade better stuff, with better risk-reward.
The 4h chart makes me nervous. Yes, there’s the glimpse of a pennant here, but I rather buy when the charts are clearer to me. The good news is the 20ma, which is going up and perhaps it’ll hit the price soon.
This would be good, and would surely help me to trade PLTR, but it is too soon to say this.
If you liked this trading idea, remember to click on the “Follow” button to get more trading ideas like this, and if you agree with me, click on the “Agree” button 😉.
See you soon,
Melissa.

NZDUSD Good opportunity to buyBased on the chart, a resistance area is broke and a pull back has completed. Something that is obvious on the chart, is about the bulls pressure at this zone and on the other hand a weakness on sellers is considerable. So based on the this scenario we can conclude that it can be a good (and some how safe) supply area.
Therefore I opened a buy position with a low amount of risk and gaining high rewards which is about 1:5 to me.
Note: As always please take all risk management rules into consideration before opening any position on the market.
Good Luck!

Risk managementI saw a lot of traders they bet for a bull run, without checking his/her risk/reward ratio. Many unexperienced traders are beting for new ATH at a stock, which shows sometimes a really small risk/reward ratio like 3:1.
So they risking 3 times of your investment as they could probably win.
That´s why I wanted to write this small explanation about risk/reward ratio.
What is it ?
Well, you take each trade the risk to loss money, that´s why it is mandatory to handle each trade with a good risk/reward distribution.
Your distribution should be minimum a 1:2 ratio.
Successful day traders are generally aware of both the potential risk and potential reward before entering a trade.
The goal of a day trader is to place trades where the potential reward outweighs the potential risk. These trades would be considered to have a good risk/reward ratio.
A risk/reward ratio is simply the amount of money you plan to risk compared to the amount of money you plan believe you can gain.
For example, if you think a potential trade may result in either a $400 profit or $100 loss, the trade would have a risk/reward ratio of 1:4, making it a favorable setup. Contrarily, if you risk $100 to make $100, the trade has a risk/reward ratio of 1:1, giving you the same type of unfavorable odds that you can find in a casino.
With regards to the long-term profitability formula above, finding trades with high risk/reward ratios (1:2 or higher), will help you maintain higher average profits and lower average losses, making your trading strategy more sustainable.
Another important topic is "Cutting losses", related to our risk/reward ratio
A stop-loss is a pre-planned exit order for a losing trade. These can be executed manually or automatically on your broker platform.
The purpose is to cut losses before they grow too large. Stopping out of a losing trade can be one of the hardest things for day traders to do consistently. However, failing to take stops can result in margin calls, unnecessarily large losses, and ultimately account blowouts.

GBPCHF wait till it hit my key supportI'm patiently waiting for price to hit my key support level then I would go long you can also wait for extra candlestick patterns or a bullish momentum
3/1 risk ratio
this is my analysis take this at your own risk

EURNZD Good buying opportunityBased on the chart, a big falling movement have finished(maybe at least for a while) and now the chart shows a good supply zone to us which restricted the price go down more than this. The weakness on sellers and increasing the buy demands, leads me to be buyer at this area with a good risk reward ratio (1:2 for the first take profit area and 1:5 for the second).
Note: As always please take risk management rules into consideration before opening any position on the market.
Good Luck!

How to properly use RSI for a high reward v/s low risk strategyThis tutorial on RSI is the first part of a RSI Masterclass series.
RSI or Relative Strength Index is classified as a momentum oscillator, measuring the velocity and magnitude of directional price movements.
Momentum is the rate of the rise or fall in price.
The RSI computes momentum as the ratio of higher closes to lower closes: cryptos which have had stronger positive changes have a higher RSI than cryptos which have had stronger negative changes.
Risk Management
The thresholds are generally set to a safe 70-30.
Risk tolerant: 33-60
Risk averse: 20-80.
Overbought-Oversold Levels:
If the RSI is less than 20, it means that the market is oversold, and that the price might eventually increase.
Once the reversal is confirmed, a buy trade can be placed.
Conversely, if the RSI is more than 80, it means that it’s overbought, and that the price might soon decline.
After a confirmation of the reversal, a sell trade can be placed.
RSI will only cross 80-20 when there’s a strong momentum jump and thus can give us better and safer quality trades than 70-30. Where as in case of 66-33, RSI might oscillate quite frequently in that range so it’s safer to use this pair along with some trend indicator to prevent losses.
-------------------------------------------------------------------------------------------------------------------------------------------------------------------
If you find the analysis useful, please like and share our ideas with the community as well as follow to stay updated with new ideas!
- Mudrex

XAUUSD In Bulls control!Based on the chart, a major resistance area is broken and a pullback is completed. The strength of buyers is observable at this area which can be seen by a Doji candle formed today(However is not finished yet!). So the weakness of sellers and power of buyers at this area, lead me to open a buy position as it presented on the chart which can provide a good risk reward ratio for trading (about 1:3)
Note: As always please take all risk management rules into consideration before opening any position on the market.
Good Luck!

Risk per unit (R) & ExpectancyIn this article, we will expand the notions presented in the first part of the series. If you haven’t read the first part, you can check it out below in our related ideas section.
We define risk as to how much you’ll lose per unit of your investment if you are wrong about the position. We called this in the first part initial risk (1R) . All your profits and losses should be related to your initial risk.
Example 1: You buy a stock at $100 and decide to sell it if it drops to $80. What’s your initial risk?
The initial risk is $20 per share. So, in this case, 1R is equal to $20. If you buy 10 shares then your total risk is $200. R represents your initial risk per unit.
Example 2: You want to do a foreign exchange trade with a $10k account, selling the EURUSD. Let’s say that $100 USD is equal to 77 Euros. The minimum unit you must invest is $10,000. You are going to sell if your investment drops by $1k. What is your risk? What’s 1R for you?
It may sound complex, but it is very simple. If you’d close your position if it drops $1k from $10k to $9k, then your initial risk is $1000 and that is equal to 1R.
R represents your initial risk per unit.
Let’s say that you have noted on your trading journal the following trades:
1. 400 CSCO at $23 - R $1000 - P&L $2,317
2. 80 IBM at $80 - R $1000 - P&L ($813)
3. 300 VLO at $50 - R $1000 - P&L $3,413
4. 400 HRB at $51 - R $1000 - P&L ($1,531)
The R multiples for these trades are:
1. 2.32 R
2. -0.81R
3. 3.41R
4. -1.53R
The average R for your system is: 0.84R
Expectancy really refers to the mean (average) R-multiple of your system. As a trader, if you want to be successful you need to start quantifying your trading performance. You should always calculate your R-multiple and it’s average (expectancy).
The expectancy of your system is the average of the R-multiples (both positive and negative) of your system . It tells you what you can expect in terms of R, on average over many trades.
This information is pretty straightforward and easy to grasp. In our example above if we have a system with an expectancy of 0.84R and we risk 1% per trade we should expect a profit of 0,84% per trade. After 100 trades you should be up 84%! The average however is not the total picture!
To understand how much your system can deviate from the expectancy, you must not only know the average R-value, you must also know the variability of R or standard deviation. The variability will tell us how far away from the mean most samples are likely to be. It would be great if all samples were at mean, but this is never the case because it would mean that there is no variability to the sample.
Now you truly understand why the 3rd and 4th golden rules that we mentioned in the first article are very important!
Trade with care.
If you like our content, please feel free to support our page with a like, comment & subscribe for future educational ideas and trading setups.
