BPCL - Good Short opportunity - 1hr Analysis- Short termBPCL is at a very crucial level. A good short trade is expected. Breakdown of 2 months trend - Good fall .
Breakout trade can give 1% to 1.5% targets.
Short below- 390
Target 1 - 380, Tgt 2 - 370.
St Loss - 395
Buy above - 395
Target 1 - 400, Tgt 2-405+
St loss-390
Riskreward

GBP/AUD Possible bearish momentum to 1.74773 LevelWe could expect a possible pullback to Price 1.77818 , before a strong bearish pressure to at least 1.74773 level.


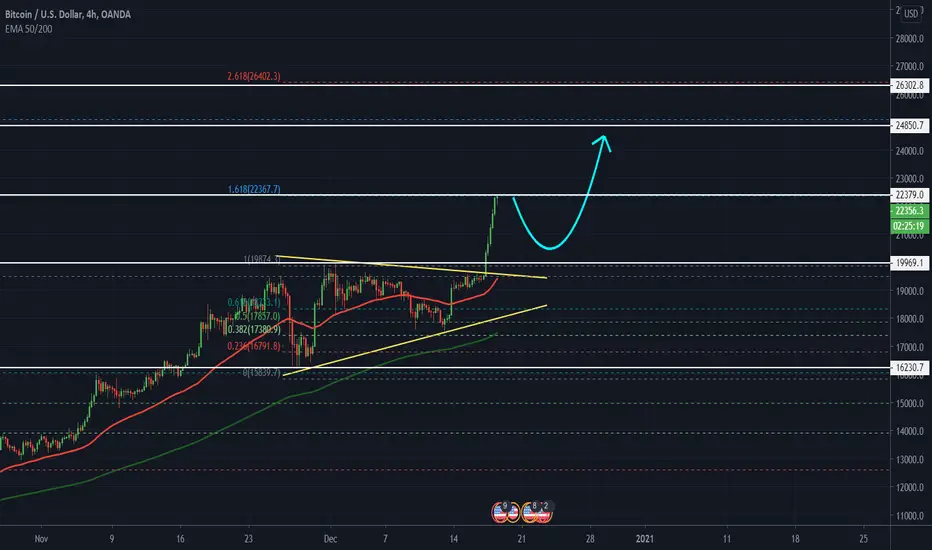
BITCOIN! Is it time to get in?!Before you get excited - Do you think the risk/reward at this current moment of time is a good place to buy now?
Wow last time I had analysed bitcoin we was going 10k - go and check my last post on that!
Technically: Broken out of wedge reached my target area of 161.8 Fib retracement my next target areas: 25k-27k - They are beautiful Fib areas!! But I won't be rushing into this trade.
I do have 2 positions in from 17k area - I took 3/4 off - I will be buying more in a pull area near high 19k areas - BUT I will be watching how the price reacts. Also let me warn you the behaviour of this market isn't like other currencies.
Sometimes, its best to be on side-line just watch the behaviour of this market - Questions I think you should question yourself....
How does the market move? is it low or fast? The behaviour.
Where and how would I place my stops?
Will i be holdling away longer term trade or am I going to do just medium trade?
What is crypto currency pegged to?
What are the risk of me holding Bitcoin? How much of my portfolio will be cryptocurrency? and Do I want crypto's in my portfolio?
Do I understand the technology enough to invest? If not (Message me I will dust out my old books I've had since 2016 later in the yr I first invested before the first bubble!)
Lastly Now we over that key area of resistance - Will it become support? Who is entering the markets - Are more institutions getting interested?
Research guys before you invest, DON'T GET FOMO!!!!
All the best,
Trade Journal
This week we can find a good opportunity to sell this pair I think zone between ema 50 ema200 is zone of value.

ethusd updatei caught the buy again and believe it is loosing momentum and could see a retest to 565 then maybe 550.
bearish selling at 600 is a safe zone with small margin risk.
good risk to reward. will sell (short term) but will try to stay updated on trading view.
this is just my speculation what goes up must come back down...
Please like and follow if you like my ideas as i be posting more this week

High probability setup on GBPUSD - Buy low from a strong supportIt's time to buy the GBPUSD as the market gave us the opportunity to buy low from a strong support area.
The risk to reward potential is HUGE as the stop loss you should need is tight and the potential Take Profit target is at almost 200 pips.
Also you can see the strong rejection from the buyers at 15M chart.
DON'T LET THAT OPPORTUNITY UNTRADED ! ! !

DAX - Ready to go down like the other indexes ?Dax, like the other indexes is at a decisive point right now.
If we really are in this ending Diagonal, we should see price drop sharply very soon.
On this setup, same as my post on the S&P, the R/R ratio totally makes up for the low probability of this trade.
Similar to this setup :
An exemple of how this can play out,
Notice the similarity of this setup to WTI in August !

TESLA - Follow up to previous post - Time to take profitsTime to take profits here and let late buyers fight the bears.
With our members, we closed part of our positions at 573 some of our positions a week ago and now we closed most of our remaining and left only 1/4 with a stop at 510.
If it continues higher after what seems to be a triangle consolidation.
Looking for 630 next where red wave V would be equal to wave I.

BITCOIN - Finally reaching 20 000$ ?! - Other followingWe seem to have finished a Triangle count here so can look for the move higher to be equal to wave (i) which gives us a potential target of 20219 .
Of course it can go higher and I'd love to see it go higher but 20k is already a great target.
If price goes above 19340 , it should continue to go higher towards the noted Fib clusters.
Same view goes for the other cryptos !
Notice that Litecoin and XR P have the biggest growth potential among the list.
For LTC I think it's doeable but XRP i'm not that sure, so, carefull on your allocations.
But if price goes below orange wave e , we could see a sell off here so be twice as carefull in that case!

RISK MANAGEMENT STRATEGYKnow when your Trading Setups are no longer Valid, Reduce Your Losses, Live to Trade Another Day!!! It's Simple, It Takes DISCIPLINE and Daily Practice.

NIO: Pullback, not a Reversal sign.Hello traders and investors! Ok, NIO dropped sharply today, let’s see what’s going on here, and if there are reasons to panic.
First, NIO dropped below our target at $ 42.51 (red line), and it hit the next support level at the $ 38.33 (purple line), and now it is reacting. The fact that it quickly filled the gap today, and it closed above the previous support at the red line is a very good sign . It shows strength. If you missed my previous NIO analysis, the link to it is below, as usual.
These support levels are clearly buy zones , and the sell-off couldn’t sustain for too long. Since the trend is slightly bearish in the hourly chart, the zone of the pink line and the 21 ema are supposed to work as resistances next.
Now, let’s look at the daily chart:
All the lines present in this chart are support levels, which are all buy zones. When NIO loses one support level, it’ll seek the next one to attract new investors. This is how the market works, at least most of the time.
Nio just hit a support level at the green line and it is doing a great candlestick pattern today. The volume is looking good, and if it closes above the 21 ema it’ll be even better. We may have a classic candlestick pattern called Piercing Line , which is usually a very good sign. But NIO must close this way.
Since we are in a support level, the situation favors the bulls, as when you buy near a support level the Risk/Reward ratio is usually very good. Also, since the trend is bullish, the odds favor the bulls too, and pullbacks are just opportunities to buy.
Let’s see how NIO will close today, and if you liked this analysis, remember to follow me to keep in touch with my daily updates, and please support this idea if you liked it!
Thank you very much!

FUTU - Support at 41/43, good place to start building longsThis one has been pretty good to me and my subsribers us althought our first buy in was stopped out for a tiny loss but we were able to get in again and got some nice profits out of it.
Now we're in a fourth wave so this could and probably will continue some more sideways if it stops at support.
So, building longs slowly is the way to go imo but only if we see price stall around the marked support zone !

S&P500 - Is this just a fakeout ? Fantastic R/RThis is the SPY ETF but the count is the same for SPX too.
I don't know if we're in a 3 waves correction here or in a 1,2 situation.
- If price starts to go lower but in corrective fashion and doesn't invalidate the count, chances increase (by a lot) that we'll see a rally higher.
- If on the other hand it keeps on going lower, I expect this to be a wave C or Y, completing a Flat correction or a WXY combination that started on September 2nd.
- And if of course price goes above 269.4, this would make the Diagonal pink wave 3 the shortest motive wave hence invalidate the count and thus probably continue higher.
The R/R is great and completely makes up for the low probability of this setup at this point if you want to short right away.
For the more risk averse traders among you, you could wait for a sharp drop below pink wave 4 before initiating any trade or simply a 5 waves drop followed by a 3 waves correction.

AAPL - Going higher - Same as TSLA !Price broke out of this Triangle.
I'm already long with my members since last Thursday but you can still buy in with a target at 147 first followed by 160 next.
This setup remains valid as long as price stays above 112.6 !

Review of back to back CADCHF trades.Evening traders
I just wanted to share two trades I've taken in the last two days on CADCHF working the 30M time frame.
In previous Forex ideas I have noted using the strategy I am utilizing on the H1 time frame following trend until next signal presents.
But this strategy is adaptable to how you would like to trade. In this example I have set my parameters to work to a stop loss and take profit setting. The setting is a 1:2.15 risk to reward ratio. Back tested from when I started trading this pair on March 4th in this manner you will see the results at the bottom of the screen are 79% gains on capital. This from risking 2% of capital per trade.
$200 dollars was risked on these trades for a $430 dollar gain on capital. Trade one was a 31pip profit move and trade two a 29 pip profit move.
For any more information on the strategy I am using please feel free to drop me a message.

Gold - Reversing now or one more tiny drop first ?We seem to have finished a WXY correction contained in this descending channel.
A move above orange wave iv is a first sign that price is reversing but you can wait for a break above the middle channel line which would be a another bullish sign, followed by a move outside the channel.
Beware though, we could see one more tiny drop down to around 1750 if the alternate count is correct and this is actually just orange wave iv.

NFLX - Going for 570. Will 662 follow after ? Good R/R setup !NFLX - Looks like we could see a rally up to 570 first, followed by 662 next but this view has to be evaluated anew once (if) price reaches 570.
Best is to wait for a push above 496 before buying, in which case Stops can be placed at 475 but I recommend using 458.8, just to give it some more room.
Ps: Notice that we have a potential Head & Shoulder pattern, building potentially the right shoulder.


eur usd shortresistant shown by white line ... we will have us consumer confidence report in few hours so it is a good opportunity, if u wanna risk u can go but i recomend wait for news confirmation and then the risk would be lower ... good luck !

Short setup of AUDCHF at 0.6715-0.6750 with high RR ratio Technical Analysis:
On the Weekly chart, the pair has been sideways for a while, sell at the top would give me a low risk trade with high reward.
entry 0.6715
stop 0.6750,
target 1 is 1.5 of stop loss, target 2 is 0.6450.
In addition, the downtrend line in cyan blue colour would give more odds on my side.
Basically, it’s a nice structure to place this trade. However, if I got stopped out. I will look for long setups for the pullback.
Plan your trade and trade your plan. Before we pull the trigger, we must know the possible scenarios. Don't focus on the money, instead focus on your trading process. The money will come into your pocket.

GBPJPY UPDATE - PRICE PUSHES PAST KEY LEVEL TO 138.6.GBPJPY UPDATE - PRICE PUSHES TO 138.6. Will be checking how price reacts from 138.6. Looking for a nice sell from that level
