Rlcusdlong

RLCUSDT: Possible Long (21.10.2020)On D1, the price has broken the trend line. A strong divergence has formed between the price and the RSI.
An upward impulse was formed on H4, after which the price corrected to the level of 23.6% (mirror level - 76.4%).
We recommend buying RLC in order to keep the position above $ 1.2

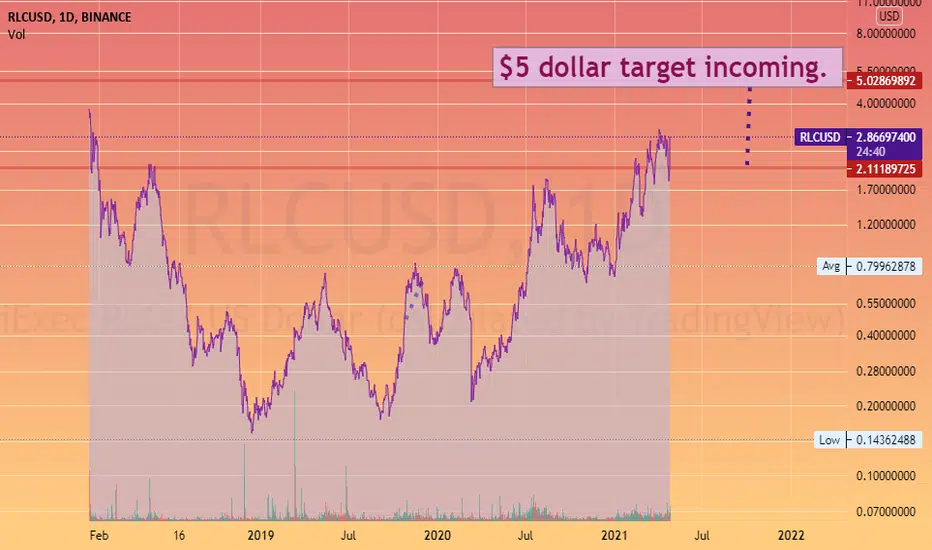
RLC/USDT gave a good demonstration of what is to come?RLC/USDT gave a good demonstration of what is to come.
It recently broke the bearish wedge going just below the 0.78% Fibonacci retracement level. After this movement, it is now showing signs that the buying zone will return hobbled on the chart to make new highs.
The profit potential is plotted on the chart.
This is just my idea, not financial advice.
Always do your own research.

RLCUSD Can give massive gains.RLC can be one of those assets which can show massive Gains.
-After a major downtrend during these bear markets we have seen RLC Showing some good Strength with almost making a good higher high along with a higher low while flipping its resistance for support.
-After conquering EMA50,100,200 it showed us some strength which can be considered as one of the bullish factors.
-The price also bounced from EMA50's Support.
-While We can Also See a formation of Cup along with handle being started to form it plays another good sign for the price to move upwards.
-Price Might consolidate a bit before starting its upward movement.
-Based on the chart patterns TP's are marked along with support zones.
-SL manual: Daily Close below Support Zones.
Thanks & Regards.
Aanuj Tated
This is not Financial Advice. DYOR


RLC/BTC (Bullish move?: up to 60% profit)RLC/BTC
RLC is starting to make a bullish move as the price started pumping and reached the downtrend resistance line at 6700 sats.
If we see the price consolidate within the green buy zone line.
This is a good potential buy zone for another leg up and eventually break this descending channel to the upside.
The stop-loss is placed under the candle at 4200 sats.

iExec RLC (Intel company going to pump it)This coin has partnerships with intel and other computer companies which are testing and developing on top of it.
It is clearly showing a strong accumulation period which will result in massive spike leading it most likely to All times highs.
Trade accordingly, be safe.

RLCUSDT formed Gartley | A good long opportunityWorld's 100th ranked crypto out of more than 2300 cryptocurrencies iExec RLC (RLC) has formed bullish Gartley pattern and entered in potential reversal zone and ready for bullish reversal soon.
This potential reversal zone should be used as stop loss in case of complete candle stick closes below this zone.
Lets have a look at the dimensions of iExec RLC price action's move:
After initial leg (X to A) the A to B leg is retraced between 0.618 to 0.786 Fibonacci (here I have ignored very minor difference) and then B to C leg is projected between 0.382 to 0.886 of A to B leg's Fibonacci projection and final (C to D) leg is retraced between 0.618 to 0.786 Fibonacci as perfectly required for Gartley pattern and now the price action is moving in potential reversal zone of this Gartley pattern, now we can expect bullish divergence at any time which will lead the priceline between 0.382 to 0.786 Fibonacci projection of A to D leg, but after this bullish divergence if the candles sticks will be closed above the 0.786 Fibonacci levels then it can also lead to the long term bullish move.
As per Fibonacci sequence method we can set our targets as below for mid term trade:
Buy between: $0.3901 to $0.3805
Sell between: $0.3977 to $0.4160
So this very short term 8hr time period chart is giving very good long opportunity
Regards,
Atif Akbar (moon333)
The harmonic moves analysis involves hours of hard work and determination however the success of harmonic trading in fiat and cryptocurrencies is around 80% therefore it is always important that you follow any stop loss strategy while trading harmonic patterns I have also shared a stop loss idea in this article, the information in this article is for educational purpose only this is not an investment advice, I have tried my best to catch the harmonic moves as per predefined classical harmonic Gartley pattern if you find any flaw or you have any suggestion feel free to share with me in comments section.

#iExec RLC | Good Move Before Take OffA currency #RLC has witnessed a strong rise in the previous months and is now in the process of correcting the wave, which reached 560%
We expect from this region to take the price up again
Do not hurry to buy, the price may go down to good places
Do not risk a large amount of your money
Please share your opinion in the comments box and do not forget to press the like button
Add to watchlist


RLC/BTC TA Update (Long Term Bullish Pattern?)RLC/BTC
Looking at the bigger picture of RLC, this is technically bullish as long as the price can hold the 200 Day MA in the coming weeks.
But RLC's number 1 enemy right now is the downward trend-line resistance
which keeps the price respecting it from the peak High 10k sats area.
If RLC breaks this trend-line, form a new Higher Low and consolidate within the bullish buying area.
I wouldn't surprised to see further growth or retest previous High at 10k in the future.
Bearish scenario if the price closes below 200MA that will signal the pullback hasn't done yet and we could see the coin drop to 2.5k sats area.

RLCUSDT formed bullish Butterfly | Upto 72% bullish movePriceline of iExecRLC / US Dollar cryptocurrency has formed a bullish Butterfly pattern and entered in potential reversal zone.
This PRZ area should be used as stop loss in case of complete candle stick closes below this zone.
I have used Fibonacci sequence to set the targets:
Buy between: 0.4480 to 0.3739
Sell between: 0.5055 to 0.6449
Regards,
Atif Akbar (moon333)

RLC/BTC TA Update (Bearish H&S Pattern Confirmed) RLC/BTC
Bearish Head & Shoulder pattern broke to the downside and the target is between 0.618 Fib or 200 Day MA.

RLCUSDT formed bullish Shark | Upto 20% bullish movePrice action of iExec RLC / US Dollar has formed a bullish Shark and entered in potential reversal zone.
This PRZ area should be used as stop loss in case of complete candle stick closed below this area.
I have used Fibonacci sequence to set the targets:
Buy between:0.6143 to 0.5860
Sell between: 0.6429 to 0.7036
Regards,
Atif Akbar (moon333)
