RLCUSDT

RLC can show something in next daysThere is some opportunity with RLC. Cumulative delta is positive on daily chart, volume is growing.


RLC/SUDT : Broke falling wedge ! BINANCE:RLCUSDT
Hello everyone 😃
RLC had a breakout from falling wedge which is making it more bullish !
How ever it's still moving into a big rising wedge but majority will be bullish for this coin.
There wasn't any important gesture in last 10 days...
📌 Also volatility is being bullish...
Attention: this isn't financial advice we are just trying to help people on their own vision.
Have a good day!
@Helical_Trades

RLC / USDT Waiting for the LONG signal: RLC / USDT
Ideal entry would be 2.2 - 2.4 area if bounces of the trendline.

RLCUSDTI really do like this token and has a clear pattern and trend that I think gonna keep moving forward to 3,5-4,1.
"Like and comment if you did like the analyse"


RLC/USDT : Indicators are being bearish BINANCE:RLCUSDT
Hello everyone 😃
RLC is moving into a bearish rising wedge.
Now MACD and Volatility are at their limits and they are being bearish.
Also Wedge higher line is near, so it will rejects any continuation for bulls...
MA 200 is located 1.9$ and it's reaching 2.1$'s support zone,
How ever MACD it's trying to support it's lower limit !
📌 2.1$ support zone could be a good retest point for RLC.
🔴 Funding is very high, So it's to wait for a better points to enter market !!
Attention: this isn't financial advice we are just trying to help people on their own vision.
Have a good day!
@Helical_Trades

"Wicks and tails want to be eaten" "Wicks and tails want to be eaten" - One of the oldest trading rules. I do not claim $7843. However,,, lets eat the wick a bit and we are all fine. IMO - There are some (more) % to make. Fundamental imo this is one of the best projects out there. Data centers are growing exponentially!!!! There is (theoretically) real need. Lets see some real adoption.

RLCBTC LONGRLC hase been stablised abov sma100 and hase potentian to grow for 25% more . the first target could be the crosiing value at sma200
I also see the 5th eliot wave in 24h time frame forming in RLCUSDT wich can grow the price


RLC/USD long limit entryPivot accumulation zone retest
Long limit entry 1,42
SL 1,12
PT 2,045
BE 1,8
RRR 2,1:1
BINANCE:RLCUSDT

RLC PREDICT FOR FEB & MARCH 2021 GO TO NEW SUPER ATH RLC PREDICT FOR FEB & MARCH 2021
GO TO NEW SUPER ATH


RLC/USDT LOOKIN GOOD 🚖Hey hey my friends 👋
We have a lot of good altcoin setups coming up!
Stay tuned 📺

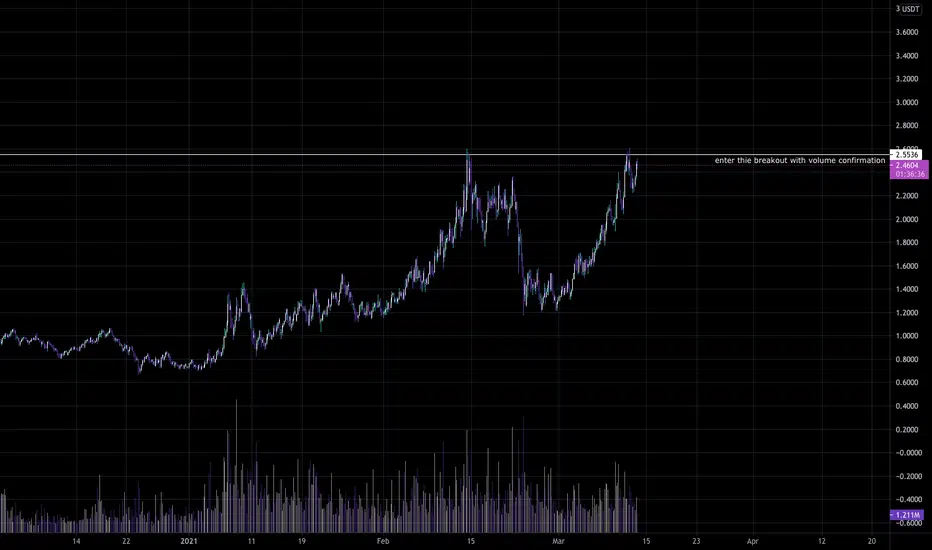
RLCUSDTentry: around 2.18
TP1: 2.55
TP2: 2.79
TP3: 2.93
TP4: 3.11
SL: 1.8752
Check my website for tutorials, examples and calls :)
cry-pto-surf.com
- My trades are not financial advices
- always use stop-loss
- invest only the amount of money you are ready to lose
- trade with a strict money management method

RLC formed BAT move for up to 27% rallyHi friends, hope you are well and welcome to the new update on iExec RLC token.
On a small time period 4-hr chart, the price action of the RLC has completed the final leg of bullish BAT and spiked in the potential reversal zone. It may give us another chance to catch from the buying zone before starting the bullish rally.
this trade has profit possibility of 27% and the loss possibility is only 4%
Note: Above idea is for educational purpose only. It is advised to diversify and strictly follow the stop loss, and don't get stuck with the trade
