📊 In-Depth Technical Analysis - Rndr 📊🔍Diving into today's analysis, we find ourselves amidst the aftermath of the recent Bitcoin halving event, where miners are now receiving half of their previous rewards. As the broader market takes a breather, exhibiting signs of consolidation, it's evident that the current landscape doesn't quite cater to the dynamics of day trading. Hence, shifting our focus to a higher timeframe, we delve into the daily chart to dissect the intricacies of Rndr's technical outlook.
🚀 Project Overview:
Rndr stands out as a premier cryptocurrency project, recognized for its practical implementation of metaverse concepts. More importantly, the project is actively progressing, with ongoing developments outlined in its whitepaper, offering tangible services for its users.
📈 Chart Analysis:
After a notable uptrend from $4 to $12, Rndr initiated a corrective phase, retracing to around $7.633. Presently, amidst a period of market stabilization reminiscent of Bitcoin's behavior, Rndr has settled into a consolidation phase, indicating a temporary balance between buyers and sellers.
📊 Volume Insight:
Analyzing recent candlesticks, it's apparent that red candles dominate in terms of volume, signaling a phase of market consolidation. While a reduction in volume often accompanies price relaxation, it also suggests a period of subdued market sentiment, characterized by decreased trading activity.
🔄 Fibonacci Retracement Analysis:
A notable observation is the Fibonacci retracement from the previous upward wave, which suggests a pullback to the 0.5 level, indicating a phase of consolidation. Should a breakout occur, the potential target could be the previous high at $12.603. Conversely, a reversal from this level could signify a bearish trend reversal.
📉 SMA Evaluation:
Of particular interest is the SMA99, currently intersecting with the price action. This convergence may signify a significant market influence, potentially laying the groundwork for a renewed bullish trend.
🎯 Conclusion:
Taking into account all essential parameters, the analysis underscores the presence of a robust Potential Reversal Zone (PRZ) within the current price range, presenting an opportune entry point for spot traders. Furthermore, the ongoing high wave cycle serves as an additional catalyst, bolstering the potential for an upward trajectory. Stay tuned for further insights as the market unfolds!
Rndr

RNDR/USDT showing a bounce, potential will back to upward!💎 Paradisers, the recent market dynamics surrounding #RNDR have indeed been noteworthy.
💎 Currently, RNDR is rebounding from the Bullish OB area, indicating a positive sentiment in the market. There's potential for RNDR to test the resistance trendline of the falling wedge pattern.
💎 If RNDR successfully breaks above this pattern, it could signify a continuation of the upward movement, potentially reaching our target Bearish OB area.
💎 However, if RNDR fails to break out of the falling wedge pattern and faces rejection at the resistance trendline, there's a possibility of a downward movement, revisiting the Bullish OB to establish new momentum.
💎 RNDR must bounce back from the Bullish OB area. A breakdown below this level could indicate further downside potential, potentially leading RNDR towards the support area or even lower levels.
MyCryptoParadise
iFeel the success🌴

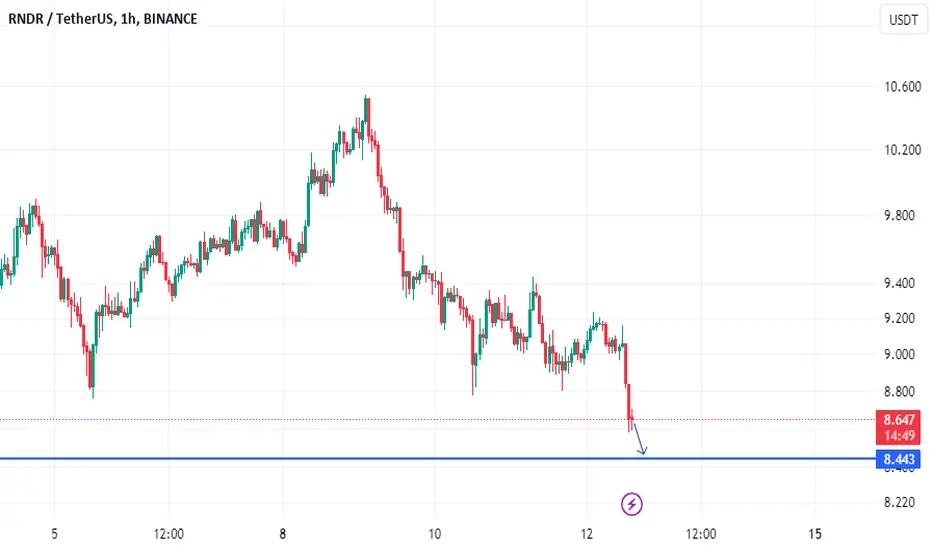
RNDR/USDT bullish horizons from demand? 👀🚀RNDR analysis💎 Paradisers, let’s focus on #RNDRUSDT. It’s currently positioned within a demand zone and approaching key resistance at $8.284. If the price manages to break above this level, we can anticipate a strong bullish move.
💎 In our previous observations, CRYPTOCAP:RNDR has consistently followed a descending trendline, respecting it twice. With the current assessment near the key resistance of $8.284, there’s a high probability that the price will break through this level, especially considering it’s also trading within the demand zone, further strengthening the bullish scenario.
💎 However, a word of caution: if the price of #RNDR fails to maintain its momentum within the demand zone and dips below, we anticipate a bullish rebound from the lower Bullish Order Block level at $5.962. Thanks to ample liquidity, breaking below this level could cause a significant downward move1.
💎 Remember to employ prudent trading strategies and use proper stop-loss measures! Stay alert to market movements and look forward to more insights
MyCryptoParadise
iFeel the success🌴

RNDR: wait for confirmation📊Analysis by AhmadArz:
🔍Entry: 7.792 - 7.237
🛑Stop Loss: 6.420
🎯Take Profit: 8.736 -9.743 -10.761 -11.915 -12.590
🔗"Uncover new opportunities in the world of cryptocurrencies with AhmadArz.
💡Join us on TradingView and expand your investment knowledge with our five years of experience in financial markets."
🚀Please boost and💬 comment to share your thoughts with us!

RNDRUSDT(Render Token) Daily tf Range Updated till 15-04-24RNDRUSDT(Render Token) Daily timeframe range. compare to other alts and market plunge. its holding not bad. need to break 10.014 to reclaim older zone above that is price discovery. breaking 6.764 will led it to 3.651.

RNDR/USDT planning for bullish move? 👀 🚀 RNDR Today analysis💎 Paradisers, let’s delve into the #RNDRUSDT analysis! An intriguing shift has occurred as it breaks free from its descending channel, setting the stage for an exciting potential bullish surge.
💎 Over an extended period, #RNDR has meticulously traced the contours of a descending channel. Currently, the price is testing a critical support level at $7.947. Our confidence in its ability to embark on a bullish trajectory remains steadfast, challenging the overhead resistance.
💎 However, prudent preparation is crucial: should the price dip below the pivotal support zone, we may witness a pronounced bearish downturn. In such a scenario, our focus shifts to anticipating a bullish rebound from the lower support level at $6.541.
💎 Remember to employ sound trading strategies and implement proper stop-loss measures! Stay vigilant, monitor market movements, and eagerly await further insights.
MyCryptoParadise
iFeel the success🌴

RNDR LONG SETUPCRYPTOCAP:RNDR play when we take back SSL as support...
Patience...
#trading
@rendernetwork

rndrSupport and press the rocket to cheer me up
Observe the ten percent loss limit
Stay away from Bitcoins
Feel free to buy and sell and post your comments
#RNDRUSDT Monthly Chart Projection The RNDRUSDT pair is currently in a consolidation phase, with the price trading around $2.20 USDT.
According to the MACD indicator, which shows a bearish crossover signal, there is potential for the pair to continue its downward trend in the short term.
The RSI indicator is currently neutral, suggesting that the pair is not overbought or oversold at the moment.
The 20-day and 50-day EMAs are currently below the current price, indicating a short-term bearish trend. However, the 200-day EMA is above the current price, indicating a long-term bullish trend.
If the RNDRUSDT pair breaks and stays below the support level around $1.40 USDT, it could potentially enter into a stronger bearish trend. In this scenario, the pair could reach the next support level around $1.00 USDT.
Alternatively, if the RNDRUSDT pair breaks and stays above the resistance level around $3.00 USDT, it could potentially enter into a bullish trend again. In this scenario, the pair could reach the next resistance level around $4.00 USDT.
It's important to consider other market factors, such as economic news and ongoing global events, to assess potential price movements for the RNDRUSDT pair on a monthly chart.

RNDRUSDT - Continuation IdeaAn idea suggesting a pullback to a strong horizontal level then price proceeding onward with the bull movement
The bars pattern plotted is how I think price action will play out.
AI coin

Render (RNDR) is setting up for upto 12.50% pumpHi dear friends, hope you are well and welcome to the new trade setup of Render Token (RNDR) with US Dollar pair.
Previously we caught almost 70% pump of RNDR as below:
Now on a 4-hr time frame, RNDR is about to complete another bullish AB=CD move for the next pump.
Note: Above idea is for educational purpose only. It is advised to diversify and strictly follow the stop loss, and don't get stuck with trade.

RNDR - Strong bullish Looking for a coin with momentum during this bullish season? RNDR has soared past all resistance zones and is well-positioned for reaching new highs. This trend indicates strong buyer confidence and could signal continued upward movement. Keep an eye on RNDR—it could be the coin to watch!

RNDR/USDT upward momentum from support? 🚀RNDR Analysis💎 Paradisers, take notice as we observe #RNDRUSDT an intriguing move underway. Should the price maintain its drive at the critical support of $9.936, there's a good chance we'll see an ascent towards overcoming the resistance at $13.873.
💎 Another angle to consider: if the price of CRYPTOCAP:RNDR can't sustain its momentum at this key support and dips below, it's time to adjust our approach. We're eyeing a bullish resurgence from a deeper support at $8.163. Notably, this level has shown significant volume spikes, signaling substantial liquidity and money flow, urging us to proceed with caution in our trading decisions.
💎 A fall beneath this lower support could lead to further declines, underscoring the importance of precise and well-thought-out actions in your trading journey to achieve success
RNDR CUP & HANDLEI'm already positioned on RNDR from the bottom of the cup and the handle.
From now on, I'll accumulate every strong drop.
I'm waiting for the price to drop so I can buy more.
I'm expecting new ATHs for 2024/2025, be patient.

RNDR: good trade 📊Analysis by AhmadArz:
🔍Entry: 11.09
🛑Stop Loss: 10.747
🎯Take Profit: 11.47-12.04-12.71
🔗"Uncover new opportunities in the world of cryptocurrencies with AhmadArz.
💡Join us on TradingView and expand your investment knowledge with our five years of experience in financial markets."
🚀Please boost and💬 comment to share your thoughts with us!

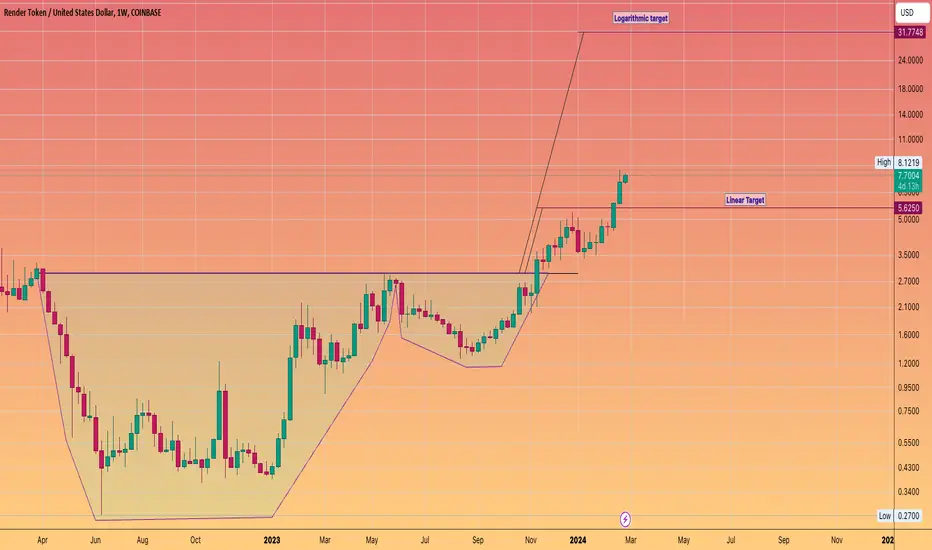
Render #RNDR - Big pattern Big target --- heading to over $30Rndr is in price discovery
Rndr is in the right sector #AI
I can't catch all the ticker's theres way too many
help me out and suggest new altcoins for me to look at..
Anyway
Still lot's left on the table in terms of gains
Even just buying Spot.
RNDR to 10 Dollars..Here's some RNDR, based on the chart, We have just completed a correction of wxy cycle, now onto the continuation impulse cycle, we might even go above 10 dollars, but our initial target is 10 dollars then from there we will see what we gon do. DCA, trade, leverage but remember this is NFA.
Entry Price was at 7.00 dollars, on another correction you can execute more orders.

RNDR possible playout !RNDR / USDT
On the chart we can see giant Cup and handle pattern breakout
A very potential move i see on a breakout like this it can go all the way up until ATH and if able to break it will fly in a new price discovery mode
Note : This currency is above our entry by +30%

💻Render(RNDR)💻 can Fall ➖15%✅ Render(RNDR) is one of my favorite cryptocurrency projects .
🚀Earlier, when it was $0.45 , I shared a post with you that until now, RNDR has increased over 😱 ➕1500% 😱.
🏃♂️ RNDR is currently moving near 🟡 Potential Reversal Zone(PRZ)($9.24_$8.28) 🟡.
💡Also, we can see Regular Divergence(RD-) between two Consecutive Peaks .
🔔I expect RNDR to form an Adam & Adam Double Top (AADT) Pattern and fall to the 🟢 Support zone($6.68-$6.37) 🟢 after breaking the uptrend line and neckline .
❗️⚠️Note⚠️❗️: An important point you should always remember is capital management and lack of greed.
Render Analyze (RNDRUSDT), 4-hour time frame ⏰.
Do not forget to put Stop loss for your positions (For every position you want to open).
Please follow your strategy; this is just my Idea, and I will gladly see your ideas in this post.
Please do not forget the ✅' like '✅ button 🙏😊 & Share it with your friends; thanks, and Trade safe.

RNDR LONGThe render is bouncing off the support level and the ascending trendline. Bullish movement is expected to continue and reach the resistance at $8.18


RNDRBullish continuation for RNDR. We can squeeze another 40% to 50% out of this.
This is more risky trade, it rose a lot already, but people are still very interested in it. DYOR
What is RNDR?
RenderToken (RNDR) is a distributed GPU rendering network built on top of the Ethereum blockchain, aiming to connect artists and studios in need of GPU compute power with mining partners willing to rent their GPU capabilities out. Conceived in 2009 by OTOY, inc. CEO Jules Urbach and launched in 2017, RNDR held its first public token sale in October of that same year, followed by a private sale period lasting from January 2018 – May 2018, wherein a total of 117,843,239 RNDR were sold at a price of 1 RNDR = $0.25 USD equivalent of token. During the private sale period, early adopters were onboarded onto the RNDR Beta Testnet, where beta node operators and artists worked collaboratively with the RNDR team in building and testing the network, up until its public launch on April 27th 2020.

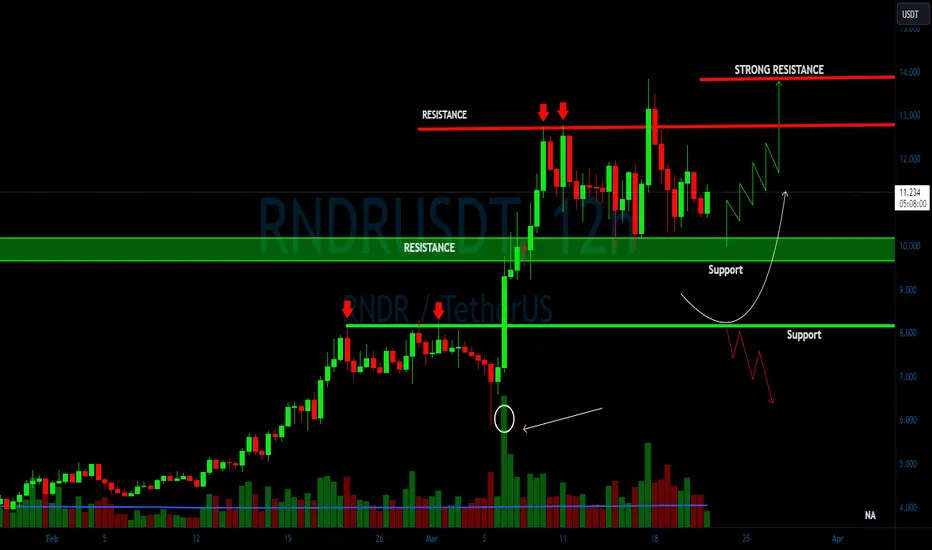
RNDR/USDT In the Crucial Area. Break out or rejected ??💎 RNDR has been garnering considerable attention in the market, though it has faced challenges in breaching a strong resistance area. Recently, RNDR experienced a setback after being rejected upon reaching this zone. A successful breakthrough of this resistance probability could lead to a significant upward trend, taking RNDR towards our set target.
💎 However, if RNDR struggles to break out and remains in consolidation at this resistance level over the next few days, there's a likelihood of facing another rejection. This could result in RNDR reversing its course back towards the support area.
💎 In the support zone, it's crucial for RNDR to demonstrate a robust recovery and attempt to overcome the resistance once more. If RNDR fails to show a positive response at the support area and breaks down further, it could indicate a shift back to a bearish trend. This could lead RNDR into a downward movement, potentially heading towards the bullish OB area.
