RNDRUSDT SCALPING ANALYSISAS you can see RNDR is in a up trend.
I will wait on RNDR to break down from the up trend and when it open closes under I will open a short
RNDRUSDT

RNDR close to a serious resistanceIMPORTANT: this is a short signal but on HTF which means I'm giving the area in which I'd look for a short but doesn't mean I'm telling you to short as soon as price goes there, this is a WEEKLY chart.
RNDR pumped a lot lately but I think the top of this run is almost in. I expect price to reach that DAILY resistance area with weekly RSI being low and then retrace between 30 and 45%. Volume keeps lowering as confirmation of my idea.
Considering the coin is relatively young and the amount of volume since last January, it's clear that best price opportunity to fill your bags and hold is gone. Most bearish scenario would be around 0.822
USDT
but it's likely it won't go below 1.64 unless BTC dumps hard. I still believe we should see BTC dumping because I think that world economy should reflects also on crypto a bit further but I might be wrong.
I'll set an alert for then price reaches the resistance area so that I'll be able to update the signal with a short setup if it's the case.
Good luck

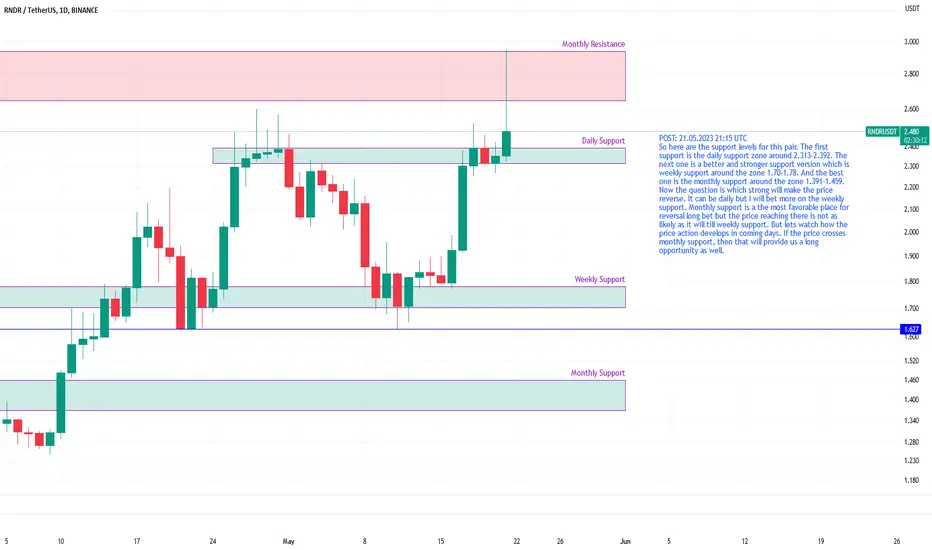
RNDRUSDT likely have reversal from weekly support 1.70-178So here are the support levels for this pair. The first support is the daily support zone around 2.313-2.392. The next one is a better and stronger support version which is weekly support around the zone 1.70-1.78. And the best one is the monthly support around the zone 1.391-1.459. Now the question is which strong will make the price reverse. It can be daily but I will bet more on the weekly support. Monthly support is a the most favorable place for reversal long bet but the price reaching there is not as likely as it will till weekly support. But lets watch how the price action develops in coming days. If the price crosses monthly support, then that will provide us a long opportunity as well.

RNDR: Bullish Trend, Watch $2.520 ResistanceRNDR is showing a strong bullish trend. The price has increased by 8% in the past 24 hours and currently sits at $2.502, above the middle Bollinger Band of $2.373, indicating the bullish momentum.
The Fibonacci retracement levels also offer key price levels. Currently, the price is near the 1 Fibonacci level of $2.520, which could act as a resistance level. Breaking this could see further price increases. On the lower side, the 0 and 0.5 Fibonacci levels at $2.267 and $2.394, respectively can act as potential support levels in the event of a price drop.
Your Relative Strength Index (RSI) is currently at 73, which typically suggests that the asset might be overbought. This can sometimes indicate a forthcoming price correction, but it isn't a guarantee.
On the other hand, the Moving Average Convergence Divergence (MACD) of 0.083 and the Stochastic Oscillators at 35 both suggest a continuing bullish trend. These are positive signs that the upward price movement isn't over yet.
The volume oscillator at 52% shows a good amount of trading volume, backing the current price trend. Meanwhile, the On-Balance-Volume (OBV) of 307M supports the bullish sentiment as it indicates volume is rising with the price.
Finally, the EMA 50 at $2.085 acts as solid support. If the price were to fall, it's likely to find strong buying interest around this level.
In summary, the trend for RNDR is currently bullish, with key resistance at the $2.520 mark and solid support around the EMA 50 at $2.085. Always remember to keep an eye on volume and momentum indicators to anticipate any changes in the trend.
Given the provided indicators, the overall trend for RNDR appears to be bullish, suggesting that the price may continue to go up in the short term. Here's why:
The price of RNDR has risen 8% in the last 24 hours, showing positive momentum.
The MACD at 0.083 also indicates a bullish trend, suggesting a continued price rise.
The Stochastic Oscillator is at 35. A value below 20 often indicates an oversold market condition, suggesting upward pressure on price, and since it's above 20 but below 80, there's room for more upward movement.
The Volume Oscillator and OBV indicate that the volume is accompanying the price rise, which often strengthens the trend.
The current price is above the EMA 50 and middle Bollinger Band, both bullish signs.
However, caution is warranted as the RSI is at 73, indicating that the coin is currently in overbought territory, which may lead to a possible price correction in the future. Also, remember that the 1 Fibonacci level at $2.520 might serve as a resistance point.

RNDRUSDT heading for monthly resistance zone 2.645-2.939I believe this is heading for the monthly resistance which is lying in the zone 2.645-2.939. Once its hits that range, it is likely the price will be pushed back from there. And might head down to look for a strong support. But lets watch first the price move to the monthly resistance.

RNDRUSDT may head upto around 2.70The price has been pushed back down by the monthly resistance. The drop was intense and made the price drop significantly. But I see an opportunity to long at this level with a target around 2.70.

RNDR - Breakout
Hi Folks,
RNDR is still well orientated.
Let's follow through and monitor the trend following.
Amongst the TOP 100 crypto, RNDR have pump the most this week, seems to be the strongest presently.
It seems there is a partnership with Apple and the VR/AR headset with Apple.

RNDR We want some More Money#Rndr breakout of the trendline testing it consolidating- we taking some profit at 2.56 and then we taking some profit at 2.75
I come to give d people, is it because I have no followers, I post 3 trades and all 3 pump.
Move stop to entry after tp1 Stop - 2.18,
Leverage whatever your heart desire- cross margin is best no more than 1/10 of balance in Position
Find order chaos will follow


Render Token Long Term StrategyHi folks,
Let's look at what Render Token is
🏳️Render Token is a project token focused on blockchain technology and cryptocurrencies. Render Token (RNDR) is an ERC-20 token developed and distributed by a company called OTOY.
🏳️Render Token serves as a payment unit for the distribution of 3D graphics, virtual reality experiences, and cloud-based computing power. RNDR enables users to share their computing power while allowing token holders to receive payment in return for this computing power. Thus, those sharing their computing power earn more Render Tokens, while token holders make payments to utilize this computing power for rendering 3D graphics or other computationally intensive tasks.
🏳️Render Token holds significant value for professionals and companies in 3D graphics and virtual reality fields. By using this token, individuals and organizations in need of computing power can access more resources and render complex graphics faster. At the same time, token holders can earn passive income by providing their computing power.
🏳️Being an Ethereum-based token, Render Token operates on the Ethereum network. This ensures fast and low-cost transactions for the token. Render Token is also listed on exchanges, allowing token holders to exchange it with other cryptocurrencies.
Bonus Chart 1: Wide Angle
Technical Data
🎯Orange --> EMA50 --> 1,86 (support)
🎯Blue --> EMA200 --> 1,38 (emergency call)
🎯Accumulation Zone (FRVP) --> 0,37 - 0,67
🎯Fib 0,236 --> 2,01 --> Support no:1
🎯Fib 0,328 --> 3,05 --> Next target
🎯There is negative divergence on the table (if it's approved), we can see testing EMA50, even EMA200. If you're a short-term player, keep that in your mind.
🎯In the worst-case scenario we can see 1,46 (perfect time to buy for the long term).
Bonus Information
🏳️RNDR is now only listed by Binance, Kucoin, and Coinbase (we can expect further listing).
🏳️Max supply --> 536,870,912.
🏳️Circulationg Supply --> 363,911,539 (%68).
Bonus Chart 2: Google Trends AI, Bitcoin, and Metaverse
🏳️Blue one is AI. When we checked Google trends for the last 5 years, AI is surpassing both BTC and Metaverse. Let's imagine! What will happen AI projects in the next bull run?
Thanks for reading all mates, do not forget to hit the like button.

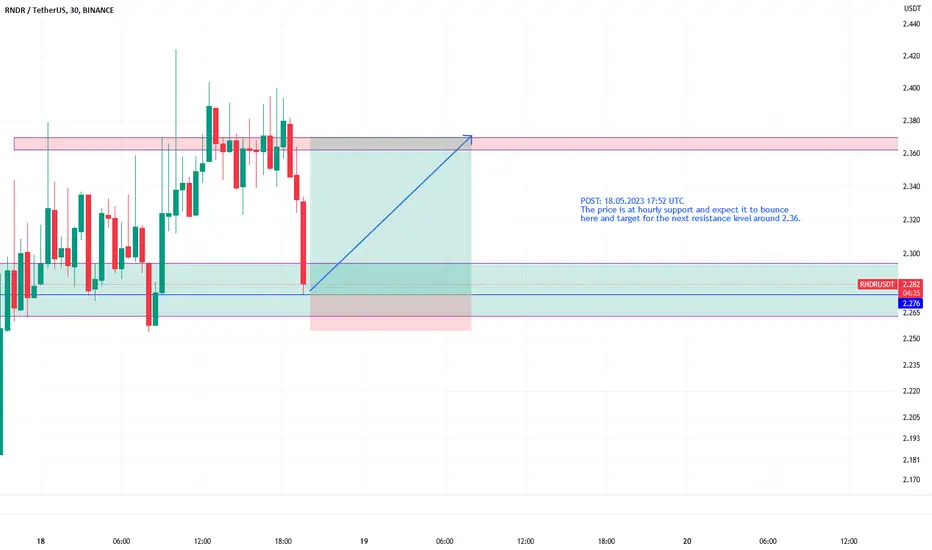
RNDRUSDT on support, likely to head to 2.36The price is at hourly support and expect it to bounce here and target for the next resistance level around 2.36.
RNDR Coin Price Prediction✅ RNDR COIN PRICE ✅
🔥 Price is at the Resistance Level at around $2.50 🔥
If Breaks up ..
🚀You can target around $3 that's around 20% gains🚀
If Breaks down..
We can expect the price around the $1.60 range.
👉 Follow me for more opportunities.

RNDR - ReboundHi Folks !
Find enclosed the update of the chart for RNDR.
This Crypto is looking quite strong amongst the top 100.
It was time for me to secure a reasonable TP2 (50% of the position) after this rebound of 40%.
Considering the current strength I will keep the remaining in trend following Next Target will around 3.10
Let follow through !

RNDRUSDT(Render Token) Daily tf Range Updated till 18-05-23RNDRUSDT(Render Token) Daily timeframe range. it got some good retail interest now. it already closed above #1.989 and got a clear space till #3.290 but thats possible if the retail interest keeps up. if not than back to #0.951.

RNDR possible HS, It's possible that RNDR is forming a daily HS. Same as bitcoin I expect if this scenario play out that we can get a doos short position.


RNDRUSDT right on track towards daily resistanceThis level seems to be resisting the price to go up. The price has reverted back on several occasions. But this time could be different and the price may finally be able to move higher. The swing idea of the price reaching to the daily resistance around 2.08-2.12 is still in play. However, I would also consider taking some profit at 2.025 level as marked on the chart.

[Update RNDR] I'm short.Range levels, monthly levels, etc. Don't gonna explain too much. Colors are fine, it is what it is.

RNDRUSDT well on its way to first 1.857 and then prob 2.08So the area 1.748 was a good level to book profit and load a bit lower. I think this one is still good for moving up and should not lose the last low. As mentioned again, the next level to watch and book profit for is 1.857.

RNDR TO 1.91Risk taker and market analyst hoping to strike it big in the trading world. Learning, growing, and hustling my way to success."

RNDRUSDT long from 1.628 up to 1.699As mentioned in the update of the previous post, level around 1.628 was for long. So the trade idea here with the chart. I believe its going higher but first resistance it will face around 1.699. Lets target that first.

RNDRUSDT moving up nicely and targeting daily resistanceIf long from the bottom of the support zone as suggested in the last post and several updates, reducing some size at 1.857 will not be a bad idea. I believe there will be an opportunity to add the size a bit lower from there. Anyways the swing trade to daily resistance remains valid. However, such reducing and increasing the size allows to benefit from the lower time frame movements.
