Bitcoin on 1h chart by RBHello, traders!🫶
💥Exciting news in the world of cryptocurrency!💥
Bitcoin has surged past the $51,000 mark and is now confidently aiming to establish itself within the $51,000 - $52,000 range.
It's evident that resistance levels have been convincingly broken, indicating a bullish momentum in the market.🚀
Following a minor correction, we anticipate Bitcoin to potentially reach the $55,000 milestone.
However, we also foresee a retracement to levels between $51,100 - $50,400 to fill the gap that has formed, providing an opportunity to gather momentum for further upward movement.
🚀
This is an exciting time in the crypto space, and I'm eager to hear your thoughts. 🧐Were you expecting this surge or were you anticipating a correction?
Share your insights in the comments below!👇
Wishing You all a fantastic day filled with successful trading!♥️
Warm regards, Kateryna💙💛
Rocketbomb

Loom/BTC by RB
Hello, friends!🫶 Check it out! 🧐The price looks great at the moment! The formation of the wedge is coming to the end.
Previous wedges worked out fantastically! Just take a look!😱
March of 2023 - 🚀 160%
October 0f 2023 - over 1000% 💥
💡So what is a wedge?
The wedge pattern can either be a continuation of an existing pattern or a reversal pattern, depending on the type of wedge and the previous trend. There are 2 types of wedges indicating that the price is consolidating.
1️⃣ The first one is ascending wedges, where the price is contained within two ascending trend lines that converge because the lower trend line is steeper than the upper trend line. In other words: lows are rising faster than highs. These wedges tend to have a tendency for sharp downward movements.
2️⃣ The second type is descending wedges, where the price is contained within two descending trend lines that converge because the upper trend line is steeper than the lower one. In other words: highs are falling faster than lows. These wedges tend to have a tendency for sharp upward movements.
Conservative traders may look for additional confirmation of price continuing in the direction of the breakout. The target can be set using the methodology of measuring the height of the back part of the wedge and extending it in the direction of the breakout. The overall stop level is located beyond the wedge on the opposite side of the breakout.
‼️To be confident in the trade - wait for the price to breakout! This will give you greater confidence!
Thanks for your attention!
Yours, Kateryna💙💛

Common Mistakes Traders Make When Placing Stop Loss OrdersLet’s discuss the four major mistakes traders often make when implementing stop losses. 😔 We consistently emphasize the importance of proper risk management, as using stop losses incorrectly can result in more losses than gains. And surely, that's not what you desire, right? 💰
Setting Stops Too Narrowly
The initial and frequent error is setting stops too tightly. 🤦♂️ By placing extremely close stops on trades, there's insufficient "breathing space" for price fluctuations before it moves in your desired direction.
Always consider the pair’s volatility and the likelihood of it lingering around your entry point before continuing its trend. 😌
Allow your trades ample room to fluctuate and factor in volatility! 📈
Reliance on Position Size Rather Than Technical Analysis
Using position size as the primary determinant for stops, such as "X" or " NYSE:X amount," instead of relying on technical analysis, is ill-advised. 🚫 Position sizing shouldn't dictate stop placement; it's unrelated to market behavior.
Since we're trading the market based on technical analysis, it's logical to set stops based on market dynamics. 📊 After all, you've chosen your entry and targets through technical analysis; similarly, determine your stop.
This isn't to dismiss position size entirely. 🤔 Rather, decide on stop placement before calculating position size.
Setting Stops Too Distantly
Some traders err by placing stops excessively far, hoping that market movements will eventually align with their expectations. 😞 But what's the purpose of setting stops then?
Why persist with a losing trade when reallocating those funds could lead to a more profitable opportunity? 💡
Setting stops too far increases the distance your trade needs to move favorably to justify the risk. As a rule of thumb, stops should be closer to entry points than profit targets. 🎯
Naturally, aiming for less risk and greater reward is preferable. With a favorable risk-to-reward ratio, like 2:1, profitability is more attainable, provided you're accurate in your trades at least half the time. 📈💰
Placing Stops Directly on Support or Resistance Levels
Setting stops either too tight or too distant is counterproductive. So, where should stops be placed? Certainly not directly on support or resistance levels. Why not? 🤔
Despite advocating for technical analysis in determining stops, placing stops precisely on support or resistance levels isn't advisable. It's prudent to consider nearby support and resistance levels when setting stops. 📉 For long positions, identify a nearby support level beneath your entry and place your stop accordingly. Conversely, for short positions, identify the subsequent resistance level above your entry and position your stop nearby.
Why avoid placing stops directly on support or resistance levels? Because there's still a possibility of price reversals upon reaching these levels. By positioning your stop slightly beyond these levels, you can confirm whether the support or resistance has been breached, allowing you to acknowledge any misjudgments in your trade idea. 🔄
In conclusion, mastering the art of setting stop losses is crucial for successful trading. By avoiding these common mistakes and adhering to sound risk management principles, traders can enhance their profitability and minimize losses. Remember to give your trades adequate breathing room, base stop placements on technical analysis rather than position size alone, avoid setting stops too far or too close, and refrain from placing stops directly on support or resistance levels. With diligence and discipline, traders can navigate the markets more effectively and increase their chances of achieving consistent success. 🚀
In the fast-paced world of trading, making informed decisions is paramount. By understanding the nuances of stop loss placement and steering clear of these pitfalls, traders can position themselves for long-term success in the financial markets. So, take heed of these insights, refine your trading strategies, and approach the markets with confidence and precision.
Happy trading! 😊📈🎉
Your Kateryna💙💛

Weekly BTC by RBHello, dear friends!🫶
Today my attention is focused on the weekly Bitcoin chart! Let's apply the MACD indicator (it works best on longer timeframes)!👍
If you don't know or have forgotten how it works, then let me briefly describe it to you!😉
🔴A sell signal is generated when the MACD line crosses below the signal line.
🟢A buy signal is triggered when the MACD line (blue line in the chart) crosses above the signal line (red line).
I have marked with red 🔴 circles cases where the blue line was below the signal line, which served as a signal to sell. And with green 🟢 circles - the blue line crosses the red line - this is a signal to buy!
The green and red arrows reflect signals to buy or sell, which were reflected by the indicator.
Currently, the indicator is at a crossover, if this happens, it will be a signal to sell! I suggest keeping an eye on this indicator in the coming days!🧐
⁉️What do you think? Will the lines cross? Or will they manage to align?
If this post was clear and interesting, hit 🚀 , share with friends, I'll be very pleased!
Stay tuned!
Always happy to see You!
Sincerely yours, Kateryna💙💛

Psychological Levels 🧠A psychological level is a price level that traders feel to be significant, generally due to its round number or because it has previously acted as a support or resistance level.
These levels are not based on any intrinsic fundamental worth, but rather on market participants' collective view and conduct.
These levels, sometimes known as "invisible lines," frequently affect the activities of both individual and institutional traders, resulting in predictable patterns in price movements.
Psychological levels are financial market price points that have substantial meaning for traders and investors, owing to their simplicity and ease of recall.
These levels are typically round integers ending in "00" or halfway points such as "50". The exchange rate of "1.00" or "parity" is also important when dealing with currency pairs.
Traders tend to base their decisions on these levels, which results in greater buying and selling pressure when prices approach or exceed them.
A nice way to think about psychological levels is that as prices approach them, traders become psychotic.
Why do psychological levels matter?
Psychological levels are significant in technical analysis because they can impact trader behavior.
The human brain is wired to seek simplicity and order. This propensity results in a predilection for round numbers and other easily identifiable patterns in trading.
As more market participants pay attention to these levels, they can become self-fulfilling, with prices reacting predictably as they approach, hit, or break through psychological barriers.
As the price approaches this level, some traders may place buy orders anticipating a bounce, while others may place sell orders anticipating a reversal.
This increased activity may cause price volatility near the psychological level, providing you with trading chances.
Here are some examples of psychological levels:
These are the pricing ranges that have a round number at the conclusion, like 100 or 1.5. Because they reflect round numbers and are simple to recall, these levels are frequently considered to have psychological significance.
Previous highs or lows: Traders may view a previous high or low price for an asset as a crucial support or resistance level and may anticipate that the price will retrace off that level in the future. These could be all-time highs (or lows), daily, weekly, yearly, or weekly highs.
Moving averages: In technical analysis, moving averages are frequently employed to spot trends and probable points of support or resistance. If a moving average has historically served as support or resistance level, traders may view it as a psychological.
How to Trade Psychological Levels
📌 Determine Key Levels: The first stage in incorporating psychological levels into your trading is to determine the key levels that are pertinent to the financial instrument (for example, the currency pair) you are trading. This can be achieved by looking at past price movement and identifying round numbers where the price has previously displayed notable reactions.
Track price movement: As it gets closer to a psychological level, pay particular attention to how the price responds. A rise in price volatility may be a sign of greater market activity, so keep an eye out for it.
📌 Set Entry and Exit Points: After identifying a psychological level and observing price behavior around it, use this information to set entry and exit points for your trades. For example, if the price has bounced off a psychological support level, you might enter a long trade just above it with a stop loss set just below it.
In essence, a psychological level in technical analysis is a price level that traders and investors believe to be significant, generally due to its round number or because it has previously performed as a support or resistance level.
These levels gain significance merely because traders pay attention to them.
Traders will frequently respond to and make trading decisions based on these levels, even if the figure has no logical significance.
Traders frequently place orders around these levels. When a price approaches certain levels, it might set off a chain reaction of buy or sell orders, causing the price to stall or reverse.
Breaking through a psychological level can indicate a further move in that direction since it indicates that traders' opinions or psychology about that stock or market are changing.
Thanks for Your attention!
Always yours Kateryna💙💛

💥 Investing in Dogecoin: Do it in a right time!Hello, Crypto Enthusiasts! 🚀
Let's dive into the world of Dogecoin (DOGE), one of the most intriguing cryptocurrencies in the market. 🌐
🐕 Origin Story: DOGE started as a meme-inspired coin featuring the Shiba Inu dog from the "Doge" meme.
🌕 Famous Meme: The coin's Shiba Inu logo became widely recognized and beloved in the crypto community.
🤝 Community-Driven: DOGE has a passionate and active community that often engages in charitable initiatives and tipping.
📈 Price Volatility: It's known for its price volatility, making it both exciting and unpredictable for traders.
🏆 Impressive Rallies: DOGE has experienced spectacular price surges driven by celebrity endorsements and social media buzz.
📈 DOGE / USDT 📉
🟢 Entry Levels: 0.05 - 0.06
🔸 Target 1: 0.07 🚀
🔸 Target 2: 0.08 🚀
🔸 Target 3: 0.09 🚀
🔸 Target 4: 0.10 🚀
🔴 Stop Loss: Under 0.045 ⛔️
DOGE is more than just a meme; it's a unique cryptocurrency with a remarkable community and history. Keep an eye on it as it continues to surprise the crypto world!
Stay tuned for more exciting updates on DOGE and other cryptocurrencies.
In the comments, let me know which altcoins you're currently trading! 🚀 Also, please share what you'd like to see in my upcoming posts. Your input is invaluable to me! 💙
Kindly sprinkle some love with a thumbs-up! 🚀❤️
Happy trading🌟
Your Kateryna🫶

Ethereum 1h by RB
Hello, dear friends! How are you?♥️
Today, I wanna draw your attention to the hourly chart of Ethereum! The short-term situation looks very interesting.
Today, the upward trendline was broken down, but the price returned to it, trying to recover and consolidate!
If you're interested in my opinion, there is potential for a slight rise to the levels of 2300 - 2350, and beyond that, it seems like a time for correction to the levels of 2220 - 2200!
At the moment, this is how I see the hourly chart! I would be glad to hear your opinions in the comments for discussion!
I missed You!🫶
Thanks for attention!
Sincerely, Kateryna.

Bitcoin on 1h chart by RB
Hello, dear friends!♥️ How are you? It's been a while since we last connected!🥹 I hope everything is going well for you, and you're ready for the upcoming halving!😏
What do we see on the Bitcoin chart today?🧐 The situation is quite intriguing. If we look at the daily chart, the scenario is not straightforward! Will there be a sharp price drop before the halving or not? What do you think? I would like to see it happen! Will it happen? We'll find out soon!
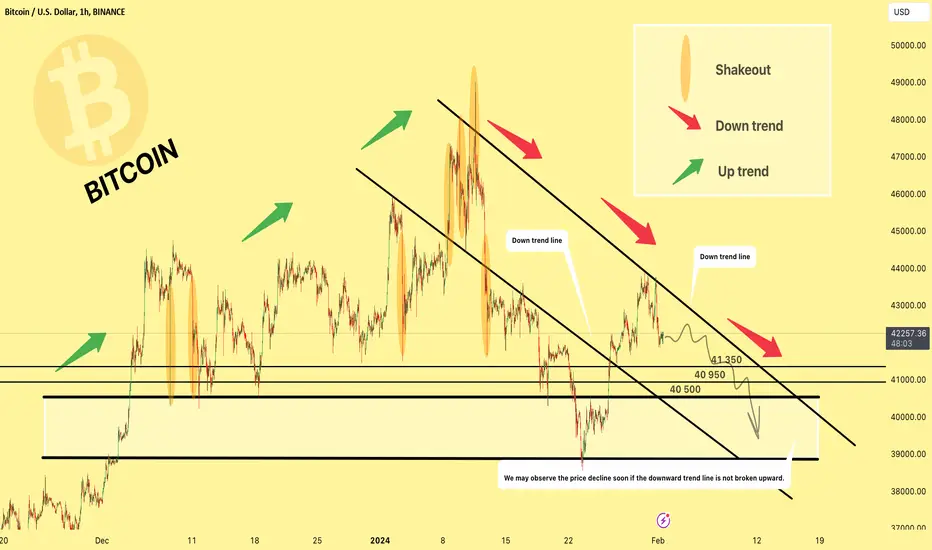
Now, regarding the hourly chart, let's take a look at my analysis! On it, we can observe that price movements have been quite turbulent (shakeouts) over the last two months, complicating short-term trades and posing a risk for margin trading! So, be cautious!
Until January 11th, an upward trend was evident on the chart, but after a sharp price drop, the trend has yet to recover (in the short term)!
By drawing a few trend lines, we can see that the price is currently moving in a descending channel and may decrease a bit more. Will there be a more significant drop below 40 thousand? In the coming days or week, if the price doesn't break above the descending channel but continues to decline, a probable scenario is a sharp drop into the range of the white rectangle at 40-39 thousand!
At the moment, this is how I see the hourly chart! I would love to hear from you in the comments for discussion!
I've missed You all dearly!🫶
Thanks for attention!💙
Sincerely yours, Kateryna💛
RB Calling for TOP! Comparing Bitcoin's 2019 Rebound with 2023.Hello my dear readers!
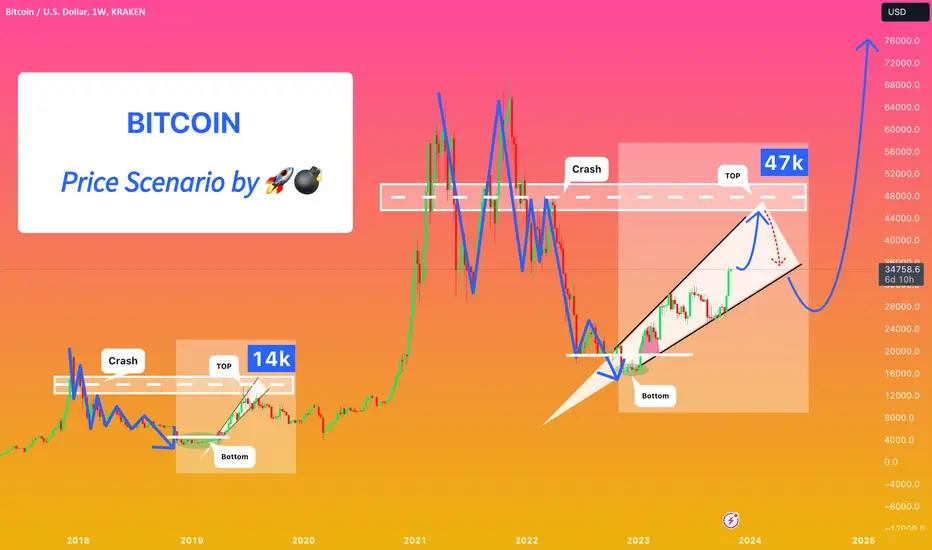
Many of us find themselves drawing parallels between past and present, searching for clues about what the future holds for Bitcoin. In this analysis, I will explore the comparison between Bitcoin's market bottom and rebound in 2019 and its current resurgence in 2023.
Can we project a price target of up to $47,000 based on this analysis? Let's dive in.
Resemblance to 2019:
Upon closer examination, it becomes evident that 2023's Bitcoin market rebound shares remarkable similarities with the 2019 scenario. The patterns, trends, and key indicators align in a way that raises intrigue among traders and analysts.
Inverted Wedge Formation:
One compelling aspect is the formation of an inverted wedge pattern. This pattern, which commenced right at the market bottom, is strikingly reminiscent of the conditions observed in 2019. The inverted wedge is a promising sign for traders, as historically, it has often preceded significant upward movements in Bitcoin's price.
Crash Patterns:
Another interesting facet of this comparison is the resemblance in crash patterns. The crash pattern observed in the current cycle shares characteristics with the previous one, yet it appears more condensed and narrow. This contrast becomes especially evident when compared to the flatter pattern that prevailed in 2018-2019.
Projection for Bitcoin's Price:
Based on this analysis, there is a potential projection of Bitcoin's price targeting up to $47,000. This projection aligns with the trends and patterns observed in both 2019 and the current market, offering an exciting prospect to monitor in the coming months.
As we observe the ever-evolving dynamics of the market, this comparison between the events of 2019 and 2023 serves as a captivating reminder of the intriguing possibilities and patterns that have the potential to shape Bitcoin's journey.
While I cannot predict the future with absolute certainty, my mission here is to empower you with my detailed market analysis and insights.
💛 If you've journeyed this far with me, why not show your support by hitting the ' boost 🚀' button and following my page? And if you're already a subscriber, feel free to share your thoughts in the comment section below.
Do you spot a correlation between these two periods, or do you anticipate a different trajectory?
Always Yours Kateryna 💙💛
𝗕𝗶𝘁𝗰𝗼𝗶𝗻 𝗼𝗻 𝗵𝗼𝘂𝗿𝗹𝘆 𝗰𝗵𝗮𝗿𝘁 🧐
Greetings, traders! Let's dive into the hourly chart of Bitcoin to see what's been happening and what might lie ahead.
🚀 Before the recent attack on Israel, there was a notable price surge. In just a few hours, Bitcoin's value took a sharp dip, only to rebound swiftly, catching many traders off guard.
💥 Currently, we find ourselves in a phase of price decline. The unfolding political and military developments across the globe have the potential to impact Bitcoin's price behavior significantly.
🔍 Here's the scenario I'm observing: If the crucial support level at 26 isn't able to withstand the pressure and ends up being breached, there's a substantial likelihood of Bitcoin's price descending into the 'gray zone.'
Stay tuned for more updates ♥️ And remember, in the world of cryptocurrency, preparedness and adaptability are your greatest allies.
Let's keep a close eye on this hourly chart, and feel free to share your insights in the comments below!
Always sincerely with You,
Yours, Kateryna💙💛

Litecoin on weekly chart💥With the ever-evolving crypto landscape, it's easy to get caught up in the latest trends and tokens, but sometimes the most valuable gems are right in front of us. Litecoin, often referred to as the "silver" to Bitcoin's "gold," is one such cryptocurrency that has been quietly making strides in the digital currency world.
Here are a few reasons why Litecoin might be considered an undervalued asset:
Digital Silver: Litecoin is often referred to as the "silver" to Bitcoin's "gold" in the world of cryptocurrencies. It offers similar benefits but is primarily used for smaller transactions and everyday purchases.
Swift Transactions: Litecoin is known for its fast transaction processing. New blocks are generated approximately every 2.5 minutes, making it ideal for quick and discreet payments.
Strong Security: Litecoin uses the same cryptographic protocol as Bitcoin, ensuring a high level of security and protection.
Experienced Development Team: The Litecoin team consists of experienced developers who actively improve the network and work on new features.
Longevity: Litecoin has been in the market since 2011, and this longevity has added to its stability and trustworthiness.
Global Acceptance: An increasing number of companies and payment systems accept Litecoin, making it more useful for everyday transactions.
Ongoing Development: The crypto community continues to actively develop Litecoin, implementing new technologies and updates to keep it relevant.
Mined: Litecoin can be mined, making it accessible to those who wish to participate in the network and receive coins as a reward.
Useful for International Transactions: Thanks to its speed and low fees, Litecoin is an excellent choice for international transactions and money transfers.
Creative Applications: Litecoin is used for various applications, from digital collectibles to the execution of smart contracts.
As the crypto world evolves, it's essential to keep an eye on assets that may be overlooked. While Litecoin may not always grab headlines, its combination of speed, security, and adoption could make it a hidden gem in the cryptocurrency market.
What are your thoughts on Litecoin? Do you believe it's undervalued, or is there another cryptocurrency you think deserves more attention? Share your insights in the comments below!
Always sincerely with You,
Yours, Kateryna💙💛

What are your thoughts?🧐The world stands on the threshold of significant trials.
In these challenging times, it's essential to reflect on the interconnectedness of global events, particularly in the context of the ongoing conflicts in Ukraine and Israel. The world, as we know it, is facing a profound test of our collective humanity and our commitment to peace and justice.
The situations in Ukraine and Israel serve as stark reminders of the complex political landscape and the enduring struggle for stability. These conflicts have deep historical roots and have far-reaching consequences that extend beyond their borders.
In times like these, it's vital to recognize the importance of diplomacy, dialogue, and a commitment to peaceful resolutions. The suffering endured by those affected by these conflicts is a stark reminder of the human cost of war, and it calls for empathy, compassion, and a united global effort to alleviate their hardships.
While we may not hold all the answers, we can collectively advocate for peace, engage in dialogue, and support humanitarian initiatives that provide aid and relief to those in need. It's a time to reflect on the values that unite us as a global community and to work towards a more peaceful and just world.
In the face of these trials, let us stand together in solidarity and hope for a future where conflicts are resolved through understanding and cooperation, rather than violence and division.
The impact of this situation on the cryptocurrency market and Bitcoin in particular is a subject of considerable interest and speculation.
The cryptocurrency market has shown a degree of sensitivity to global geopolitical events, and the ongoing conflicts in Ukraine and Israel are no exception. Here are a few potential ways in which these situations can influence the cryptocurrency market:
Safe-Haven Asset: In times of global uncertainty, some investors view Bitcoin as a digital safe-haven asset, similar to gold. This perception can lead to increased demand for Bitcoin, potentially driving up its price.
Risk Aversion: On the flip side, heightened geopolitical tensions can also result in risk aversion, leading some investors to move away from more volatile assets like cryptocurrencies in favor of traditional safe-haven assets.
Market Volatility: Geopolitical events can introduce volatility into financial markets, including cryptocurrencies. Sudden shifts in sentiment can lead to rapid price fluctuations in both directions.
Regulatory Changes: Governments may react to these events by introducing new regulations or taking a closer look at cryptocurrency activities. Such regulatory changes can impact the market.
Global Economic Impact: Geopolitical tensions can have broader economic implications. Economic instability can, in turn, affect investor sentiment and their approach to cryptocurrencies.
It's important to note that the cryptocurrency market is influenced by a myriad of factors, including supply and demand dynamics, market sentiment, and technological developments. Geopolitical events are just one piece of the puzzle.
As with any investment, it's crucial for traders and investors to stay informed, practice risk management, and be prepared for various market scenarios, especially during times of heightened uncertainty.
As investors and traders, it's essential to stay informed, assess the evolving landscape, and exercise prudent risk management strategies. The cryptocurrency market's response to global events remains a dynamic and multifaceted aspect of this ever-evolving space.
Let's engage in a thoughtful discussion. What are your thoughts on how geopolitical events may affect the cryptocurrency market, especially Bitcoin? Share your insights in the comments below! 👇
Always Yours Kateryna💙💛

𝐁𝐢𝐭𝐜𝐨𝐢𝐧 𝐨𝐧 4 𝐇𝐨𝐮𝐫𝐥𝐲 𝐂𝐡𝐚𝐫𝐭💥Hello, dear friends! I really want to wish you all the best and brightest because the world is on the verge of a tremendous ordeal! At times, it feels like a dream, and we wish to wake up!
I understand that this platform is not political, and we won't be discussing any political processes here. However, over the past two years, politics has touched each one of us!
In these difficult days for the people of Israel, I want to express words of support and wish for a swift victory over terrorism! You are strong, Ukraine stands with you!
Now, let me explain what I've drawn on my chart and how I see the current situation in Bitcoin's price movement.
On my 4-hour chart, you can see an ascending channel that was formed in October 2022 and continued until August 2023! On August 18, the ascending channel was broken downward. This means we can conclude that the ascending trend was broken. And the price started forming a new pattern! At the moment, it resembles a rising wedge. If we follow the rules of this pattern, we might soon see Bitcoin at around 22,000!
If this indeed happens, I believe the downward trend will continue, and we will closely monitor further developments together!
If you appreciate my work, please give it a like, and feel free to share the chart with your friends! I would be very happy to engage in discussions and hear your feedback!
Always sincerely with You,
Yours, Kateryna💙💛

𝐁𝐢𝐭𝐜𝐨𝐢𝐧 𝐨𝐧 𝐇𝐨𝐮𝐫𝐥𝐲 𝐂𝐡𝐚𝐫𝐭 06.10.23
Hello, dear TradingView community! 🚀
Since the beginning of September, Bitcoin has been crafting an intriguing narrative. Within this month, it has formed an ascending channel, with prices oscillating between $25,000 and $28,500. But here's the kicker: there's a significant twist in this tale. The price is now drawing closer to a trendline that etched its presence last year.
Currently, we find ourselves in the lower echelons of this channel. The outlook suggests a period of consolidation within this region, potentially steering us toward that long-term trendline. 🌐
But what's the takeaway for traders we can do? 🤔
The key lies in patience and observation. 🧐 To formulate a robust trading strategy, we advise waiting for more substantial price movements. A decisive breakout in either direction will be the clarion call you've been waiting for – a strong signal to make your move. 🚀
Remember to hit that "Like" button and subscribe for more insightful updates!
Together, we can achieve more!💪
Until next time! 🚀 Your Kateryna🫶

DCA when buying Bitcoin💥Welcome to my page, dear friends! 🚀 I'm delighted to have you here and are ready to share exciting and informative content. I hope you'll find a lot of valuable information and inspiration for your financial growth here.
Buying Bitcoin at an averaged price, also known as "dollar-cost averaging" (DCA), is crucial for several reasons:
🔴 Risk Distribution: Purchasing at fixed intervals (e.g., weekly or monthly) allows you to distribute risks over time. This means you don't invest all your funds in one purchase at the current price, which can be risky.
🟠 Mitigating Volatility Impact: The cryptocurrency market is known for its high volatility. DCA helps mitigate the impact of short-term price fluctuations and avoids buying at the peak of price spikes.
🟡 Emotional Stability: Dollar-cost averaging helps you avoid emotional decisions while trading. You simply stick to your plan, buying regularly, regardless of market movements.
🟢 Long-Term Perspective: The DCA approach focuses on long-term investment. It helps create a cryptocurrency portfolio with an average asset cost, which can be particularly useful for long-term investors.
🔵 Temporal Reduction in Average Price: Purchasing during price dips reduces your average buying price, allowing you to benefit more when prices rise.
🟣 Easy Execution: DCA is a straightforward way to invest in cryptocurrencies without the need to constantly monitor the market and make complex decisions.
📌 It's essential to remember that DCA doesn't guarantee profits, and the cryptocurrency market remains risky. However, it's a strategy that can help you manage risks and build a long-term cryptocurrency portfolio.
Feel free to ask questions, share your thoughts and experiences, and, of course, subscribe to stay updated on all my posts and analyses.
Your support and participation mean a lot to me.
Together, we can achieve more!💪
Until next time! 🚀 Your Kateryna🫶

Bitcoin on 3h chart by RB Hello dear friends! I'm happy to greet you all!😊
Once again, I disappeared from TV for a few months!😔
Gathering my willpower, I am coming back, trying to stay connected, but my psyche, shattered by the war, adds its own adjustments, and I retreat into myself and disappear again!
I get frustrated with myself, take a deep breath, learn to live with all of this, which is why I am trying to come back and continue seeking inspiration here, on TradingView!
For me, this place has always been a refuge and a source of creative inspiration. I poured my soul into every post and found a response in your hearts!
That's why I'm here again, sharing my thoughts with you!
Let's take a look at the 3h Bitcoin chart - it provides a clearer view of the channel, that the price has been forming since the beginning of 2023 (quite a long period)!
In my humble opinion, it's about time for the price to break out of it! Analyzing the situation, it seems to me, that the price movement indicates a downside breakout with a slight pullback to dynamic support (the lower channel line).
So, in the near future, we might witness the price dropping to the level of 27,800 - 27,500, followed by a minor upward correction, and then a decline to around 26,200, with a subsequent price rise to 27,800, and further decline below 25,000.
Whether my forecast comes true will be revealed over time! Meanwhile, I would be interested to know how you are doing? Any success in trading? Feel free to share your predictions! Waiting for your comments!
Always sincerely yours,
Kateryna♥️

🌟 DeFi vs. CeFi: Unraveling the Financial Revolution 🌟The financial landscape is undergoing a seismic shift, and at the heart of this transformation lies a heated battle between two contrasting ideologies: Decentralized Finance (DeFi) and Centralized Finance (CeFi). 🚀
In this post, we're diving deep into the world of DeFi and CeFi, unravelling their key differences, advantages, and implications for the future of finance. Buckle up as we navigate through the decentralized wilderness and the fortified citadels of traditional finance.
Decentralized Finance (DeFi) and Centralized Finance (CeFi) represent two distinct paradigms within the world of finance, each with its unique characteristics and features. Here are the key differences between DeFi and CeFi:
🕵🏻♂️ Control and Intermediaries:
DeFi: DeFi operates on decentralized networks, typically blockchain platforms like Ethereum. It eliminates the need for traditional intermediaries such as banks and financial institutions. Users have full control over their funds and transactions without relying on a centralized authority.
CeFi: CeFi, on the other hand, relies on centralized intermediaries like banks, brokerage firms, and financial institutions. These entities facilitate and oversee financial transactions, acting as custodians of users' assets.
👨🏻💻 Access and Inclusivity:
DeFi : DeFi is accessible to anyone with an internet connection and a cryptocurrency wallet. It promotes financial inclusion by allowing individuals worldwide to access financial services, regardless of their location or background.
CeFi: CeFi services are often subject to geographic restrictions and require users to meet certain criteria, such as identity verification and residency, which can limit accessibility.
🧑🏻🔬 Transparency:
DeFi: DeFi transactions and smart contracts are recorded on public blockchains, providing a high level of transparency. Users can independently verify transactions and contracts.
CeFi: CeFi transactions typically occur within closed systems, making it harder for users to scrutinize or validate the underlying processes.
🙅🏼♂️ Censorship Resistance:
DeFi: DeFi platforms are resistant to censorship since they operate on decentralized networks. Transactions cannot be easily blocked or censored by governments or third parties.
CeFi: CeFi platforms may be subject to government regulations and can comply with requests for transaction censorship or freezing of assets.
👮🏼♂️ Risk and Security:
DeFi: While DeFi offers increased control, it also comes with risks related to smart contract vulnerabilities, hacks, and scams. Users are responsible for their security measures, such as managing private keys and selecting trustworthy DeFi platforms.
CeFi: CeFi platforms often have established security measures, including insurance, regulatory compliance, and fraud prevention. However, users may still face risks associated with centralized data breaches and third-party vulnerabilities.
💼 Financial Services:
DeFi: DeFi provides a wide range of financial services, including lending, borrowing, trading, yield farming, decentralized exchanges, and more. Users can access these services directly from their wallets.
CeFi: CeFi offers traditional financial services, such as savings accounts, loans, investment products, and trading services. These services are managed by centralized institutions.
🧐 Regulatory Oversight:
DeFi: DeFi operates in a largely unregulated space, which can offer innovation but also risks. It may face increased regulatory scrutiny in the future.
CeFi: CeFi entities are subject to financial regulations and oversight by governmental authorities, which can provide legal protections but also limit flexibility.
In summary, DeFi and CeFi represent contrasting approaches to finance, with DeFi emphasizing decentralization, accessibility, and transparency, while CeFi relies on central authorities and established financial institutions. Each has its advantages and disadvantages, and the choice between them depends on individual preferences and risk tolerance.
As we conclude our journey through the realms of DeFi and CeFi, one thing is clear: the financial world is evolving, and the choice between these two paradigms isn't just about technology—it's about how we envision the future of finance. Whether you opt for the autonomy and transparency of DeFi or the stability and familiarity of CeFi, always remember that the power to shape your financial destiny is in your hands.
Stay tuned for more insights, trends, and analyses here at TradingView, your compass in the ever-changing world of finance.
PS Remember, your likes are my inspiration! 💖 Don't hesitate to tap 🚀 if you find my content valuable. Together, we are shaping an incredible financial future. Let's grow and thrive together!
Your Kateryna

Bitcoin on 4h chartHello! Welcome to my page!🫶
Bitcoin is a word, that resonates throughout the cryptocurrency world and beyond. It brings with it magic and endless opportunities for traders and investors.
Bitcoin is famous for its volatility, which opens up innovative possibilities for traders. In a single day, its value can rise or fall by thousands of dollars, creating ideal conditions for successful trades.
If you're here, you're probably interested in Bitcoin analysis, so I'm happy to share my thoughts with you!
On the chart, I've marked areas of interest in blue. Why? Because their movement indicates the beginning of accumulation (the lower circle) and the start of distribution (the upper circle)! The price formation is very similar, so by flipping part of the formed price in the accumulation zone, we can assume that the price will form identically (only in reverse) in the distribution zone.
If the assumption is correct, we may see a price level of $28,000 - $28,500 in the near future! After that, I expect a price decrease, but it's essential to carefully analyze further price formation!
Get ready for an exciting journey into the world of Bitcoin. This cryptocurrency is constantly changing, so study, analyze, and trade wisely. Risks and opportunities are open to you. May your trades always be profitable! 💰🚀
Don't forget always to be cautious and invest only what you can afford to lose. Bitcoin is intriguing and attractive, but the risks are significant too. Best of luck on your path to successful trading! 🌟
What do you think the price will do next? Share your thoughts! I'm looking forward to your comments!
Sincerely, Your
Kateryna

Trading Opportunity: ETC/USDT😱 Ethereum Classic is a blockchain platform that provides decentralized smart contracts. It emerged as a result of a contentious hard fork from Ethereum (ETH) in 2016. ETC aims to preserve the principles of blockchain immutability and decentralization.
🟢Green Entry Zone: 14.72 - 16.60
🚀 Targets:
Target 1: 17.99
Target 2: 19.50
Target 3: 21.35
Target 4: 23.25
🔴 Stop Loss: 11.22
📢 Trade Alert: Ethereum Classic (ETC) has caught our attention! With its unique blockchain philosophy, ETC offers a compelling trading opportunity.
🔍 Before you proceed, remember to exercise caution and conduct thorough research. Cryptocurrency markets can be highly volatile, so managing risk is crucial.
Good luck with your trading!
Your Kateryna💙💛

Bitcoin Price Analysis
As we delve into the analysis of Bitcoin's price, it's essential to consider the key elements that influence its trajectory. From the recent price movements, it becomes evident that Bitcoin has been following a distinct pattern.
Initially, we observed a consistent upward movement, aligning with a long-term ascending trendline. However, this momentum was momentarily halted as Bitcoin encountered a formidable resistance level, leading to a brief pause.
Subsequently, the cryptocurrency resumed its ascent, targeting the long-term descending trendline. This marked the beginning of a multi-month correction phase.
Remarkably, the conclusion of this correction phase witnessed a sudden and sharp breakthrough of the long-term descending trendline. While this breakthrough appeared promising, it's essential to remain cautious as it may potentially be a false signal.
Moreover, during this journey, Bitcoin managed to surpass a strong resistance line, which has now transformed into a formidable support line.
Currently, Bitcoin is poised to confront another significant resistance level. The outcome of this encounter may dictate the cryptocurrency's future path, including the possibility of reuniting with the long-term ascending trendline.
Stay tuned for further updates on Bitcoin's price dynamics as we continue to monitor this ever-evolving market.
Thank you for your attention, sincerely yours, Kateryna♥️

Understanding Bitcoin Price MovementUnderstanding Bitcoin Price Movement through Wyckoff's Theory
Richard Wyckoff, a legendary figure in the world of trading, left us with invaluable insights into price action and market behavior. His principles, outlined in "Charting the Stock Market," lay the foundation for understanding how markets move. Let's delve into two pivotal rules from Wyckoff's playbook:
Rule 1: The Market's Unique Behavior
Wyckoff's first rule reminds us that the market is a dynamic entity. It never repeats the same price action exactly as in the past. Each moment in the market is distinct, shaped by a multitude of factors. Recognizing this uniqueness is essential.
Rule 2: Comparative Analysis
The second rule dovetails with the first. It emphasizes that the true analytical value lies in comparing current price action with historical behavior. By drawing parallels and contrasts, we can extract meaningful insights into market trends.
These two rules serve as the cornerstone for comprehending the Wyckoff Market Cycle theory, which remains influential in modern trading practices.
Wyckoff Market Cycle Theory
Wyckoff introduced a groundbreaking theory based on price action, defining four distinct stages within a price cycle:
1. Accumulation Phase
In this initial stage, institutional demand rises, and bulls begin to assert control. However, price action remains relatively flat, resembling a range-bound structure. Identifying higher lows within this range signals the Accumulation phase, hinting at an impending bullish move.
2. Markup Phase
The second stage, Markup, sees bulls gaining enough momentum to breach the upper boundary of the range. This breakthrough signifies the emergence of a bullish trend.
3. Distribution Phase
Distribution is the third stage, characterized by bears attempting to regain control. Much like the Accumulation phase, price action remains flat, but with a different twist. The sustained failure to establish higher bottoms hints at a looming selloff, depicted by lower tops.
4. Markdown Phase
The final stage, Markdown, marks the onset of a downtrend following the Distribution phase. It signifies that bears have gained the upper hand, driving prices lower. Confirmation of the Markdown occurs when price action breaks below the lower boundary of the horizontal distribution channel on the chart.
The beauty of Wyckoff's theory is its cyclical nature. After the Markdown phase, the entire process restarts with Accumulation, offering traders a framework to navigate the complexities of Bitcoin price movement.
Understanding these principles allows us to discern patterns in Bitcoin's price action and make more informed trading decisions. By embracing the wisdom of Richard Wyckoff, we can navigate the ever-evolving landscape of cryptocurrency trading.
🫶 Thanks for Your attention, sincerely yours, Kateryna.
Wishing You successful trades and unforgettable adventures in the world of cryptocurrencies and the financial market!

Bitcoin in Diamond (Rhombus) Pattern Hello friends! ♥️ Today we'll talk about one of the rarest patterns! You probably already guessed what I mean😉
The Diamond pattern in trading is a reversal pattern, and it's relatively rare. Let's explore how to identify it on a chart and use it in trading.
The Diamond pattern, also known as the Rhombus, is a technical analysis pattern consisting of two triangles. Its appearance on a chart indicates a potential reversal, especially if it's spotted at the top of an uptrend or at the end of a downtrend.
Trading the Diamond Pattern:
Identification of the Diamond Pattern: Firstly, you need to learn how to recognize the Diamond pattern on a chart. This involves identifying two triangles, one typically vertical (representing a volatility squeeze) and the other horizontal (indicating a period of consolidation).
Determine the Trend Direction: Before making a trading decision, it's important to determine the current trend direction. If the Diamond pattern forms after a prolonged uptrend, it may signal a potential reversal to the downside, and vice versa.
Wait for Confirmation: The Diamond pattern alone can be a false signal. Traders often wait for confirmation, which can come in the form of a breakout by price from one of the Diamond's sides. If the price closes above the top of the Diamond for an ascending Diamond or below the bottom for a descending Diamond, it may serve as a signal to enter a trade.
Risk Management: Setting a stop-loss order is crucial to limit potential losses if the trade goes against you. Determine the size of your stop-loss and take-profit levels according to your risk management strategy.
Manage the Position: Once you've entered a position, monitor its progress closely. Consider using a trailing stop to protect your profits and reduce risk. You may also contemplate partial position closure as prices move in your favor.
Volume Analysis: Trading volume can be a valuable indicator when trading the Diamond pattern. High volume during the breakout can add confidence to the reversal signal.
Conclusion: The Diamond pattern is just one tool in technical analysis, and its use requires an understanding of the market context and additional confirmation factors. Traders often combine various analysis methods to make more informed trading decisions.
Remember that no technical pattern guarantees success in trading, and there's always a risk of capital loss. It's crucial to maintain discipline and manage risks when trading the Diamond pattern or any other patterns.
Thanks for your attention, and happy trading!💥
Feel free to share Your thoughts on this topic with us
Your Kateryna💙💛

Fractals in Bitcoin PriceHello, friends!🖐🏼
When it comes to analyzing the price of Bitcoin, one powerful tool that traders often use is fractal analysis. In the world of trading, fractals are not just fascinating mathematical concepts; they are essential for identifying patterns and potential price movements. Let's dive into the world of fractals in Bitcoin price analysis.
What Are Fractals?
Fractals are self-similar patterns that repeat themselves on different time frames. In the context of Bitcoin trading, these patterns can be observed across various time intervals, from short-term charts like minutes and hours to long-term charts like days and weeks.
Why Do Fractals Matter in Bitcoin Trading?
▪️ Pattern Recognition: Fractals help traders recognize recurring price patterns, which can indicate potential trend reversals or continuations.
▪️ Support and Resistance Levels: Fractals can pinpoint crucial support and resistance levels, helping traders make informed decisions about entry and exit points.
▪️ Market Psychology: Fractals often reflect market psychology and sentiment. Understanding these patterns can provide insights into the collective behavior of traders.
Types of Fractals in Bitcoin Trading:
📎 📈 Bullish Fractals: These are patterns that suggest a potential upward price movement. They often appear after a downtrend and may signal a reversal.
📎 📉Bearish Fractals: These patterns indicate a potential downward price movement. They typically form after an uptrend and may suggest a trend reversal.
📎 Regular vs. Hidden Fractals: Regular fractals are easily visible on price charts, while hidden fractals are less obvious and may require a more skilled eye to detect.
Applying Fractals in Your Trading Strategy:
📌 Confirm with Other Indicators: It's often wise to confirm fractal patterns with other technical indicators like Moving Averages, RSI, or MACD for added confidence.
📌 Risk Management: Always implement risk management strategies, including stop-loss orders, when trading based on fractal signals.
📌 Multiple Time Frame Analysis: To get a comprehensive view, consider analyzing fractals on multiple time frames. A fractal pattern on a higher time frame can carry more weight.
📌 Backtesting: Before fully relying on fractals, backtest your strategy to ensure its effectiveness in different market conditions.
Fractals offer traders a valuable lens through which to analyze Bitcoin's price movements. They can help you identify potential turning points and make more informed trading decisions. However, like any tool, they should be used in conjunction with other forms of analysis and risk management to navigate the complexities of the cryptocurrency market successfully.
So, as you delve deeper into Bitcoin trading, remember that fractals are your allies in deciphering the market's intricate patterns and uncovering opportunities for profitable trades.
Thanks for Your attention.♥️ I hope this post was engaging and informative.
Yours sincerely, Kateryna 🚀
