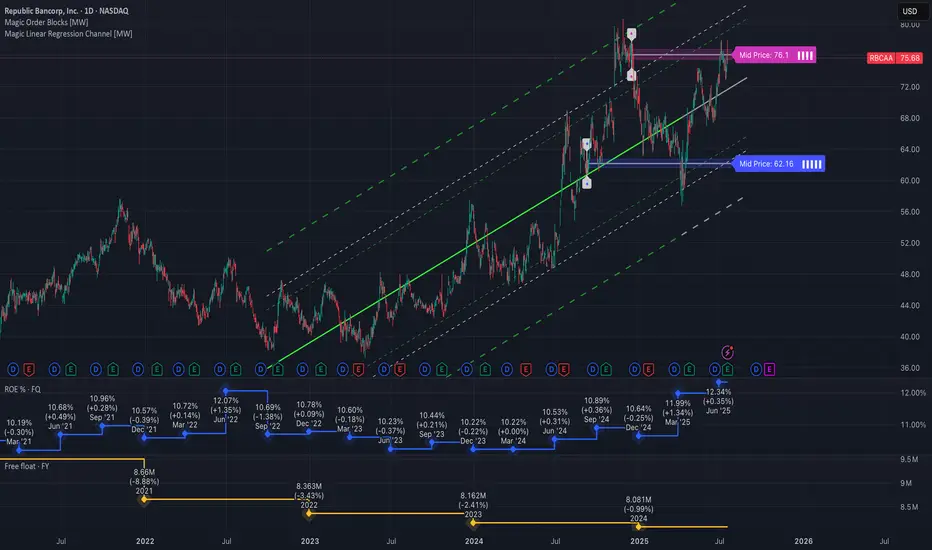
$RBCAA Looking to MoveNASDAQ:RBCAA was a pick from my July 1st, 2025 newsletter, along with $MCRI. They both had similar charts, and were both relatively flat since then. However, NASDAQ:MCRI had a single day 20% jump last week. I guess other folks are catching on. Its 50 day SMA has just recently crossed its 200 day SMA, giving us a golden cross. ROE has been increasing for 4 of the last the last 5 quarters, and the price seems to be bouncing off of it’s 50 day SMA and the baseline of its 3 year channel. Also, float has been decreasing since 2019.
Will it get a big bounce like NASDAQ:MCRI did last week? That remains to be seen, but I might be adding a little bit more to my current position.
ROE
Beating the S&P 500 with TradingView's Stock ScreenerThis is Mo from MWRIGHT TRADING. The date is Friday, June 27th, 2025.
This video is about selecting stocks that collectively have the potential to consistently beat the S&P 500
I look for smooth and consistent long-, mid-, and short-term performance. For that we need
Building a Screener
What I look for
- Liquidity - that means money, or trading volume.
- Room to move - no overhead resistance
- Favorable trends - stable moving averages
- Good short term signals - a good intraday chart
Filters
- Market Cap 300M to 2B
Not too big, and not too small
- Perf 10Y > Perf 5Y
No long term dips in performance
- Perf 5Y > Perf 1Y
No short term dips in performance
- SMA(300) < Price
Price above moving average
- SMA(200) < Price
Price above moving average
- Avg Volume 10D > 100K
No lightly traded stocks. Liquidity needed
- + SMA(200) >= SMA(300)
Stacked long-term SMAs
- + SMA(50 >= SMA(200)
Stacked short-term SMAs
- + ROE, Trailing 12 Months > 0% (Chris Mayer)
Improving ROE
Examples
- SENEA
- DGII
Review the charts
- Verify short term performance
- Multi-VWAP (1 hr Chart) - Free Indicator
- Above a rising 5-Day AVWAP
- Magic Order Blocks (5 min Chart) - Free Indicator
- No major overhead resistance
- Verify fundamentals and long term performance
- ROE (Quarterly) - TV Indicator
- Rising ROE
- Float Shares Outstanding - TV Indicator
- Lower float means lower supply. When high demand occurs, this can act as a price catalyst.
- Multi VWAP from Gaps - Free Indicator
- Stacked is good
- 3 SMA Ladies - Custom Indicator
- Stacked is good

9 Simple Ratios Every Great Investor Uses - Buffett Included!Forget the hype, headlines, or hope. These 9 financial ratios are what real investors actually use to pick winners, but...
P/E? ROE? EPS? 🧐
- What are they, or better yet, WHO are they? 🤯
- How high is “too high”?
- Is a low number always good, or just a trap?
- Do all industries follow the same rules… or is that another myth?
Buffett. Greenblatt. Graham. Lynch.
They didn’t rely on vibes — they trusted fundamentals
After years of relying on charts, I built a 9-point fundamentals checklist to filter stocks faster and smarter. Now I’m sharing it with real-life examples and key insights to help you spot what really makes a stock worth owning:
Easy enough for new investors diving into fundamentals
Sharp enough to level up seasoned pros
Real enough to avoid hype
…but the truth is: these numbers did flag companies like Amazon, Apple, and Nvidia before the market gave them credit.
-----------------------------------------------------
✅ Quick Reference Table
Scan the table, then dive into the stories…
First Pro Tip: Bookmark this. You’ll check these before every stock pick.
-----------------------------------------------------
📊 1. P/E Ratio | Price-to-Earnings
What it tells you: How much you pay for each dollar of a company’s profit.
Short Example: A P/E of 20 means you pay $20 for $1 of profit. High P/E? Expect big growth or risk overpaying.
Strong: Between 15 and 25
Caution: Above 30 (unless fast growth)
Industry Averages:
- Tech: 25–40
- Utilities: 10–15
- Consumer Staples: 15–20
- Energy: 10–20
- Healthcare: 20–30
Story: In early 2023, NVIDIA’s P/E ratio hovered around 25, near the low end for tech stocks. Investors who saw this as a steal amid the AI boom were rewarded—NVIDIA’s stock made 4x by the end of 2024 as AI chip demand soared.
Contrast that with Tesla in Q1 2025, when its P/E spiked above 40 with slowing sales and Tesla’s stock dropped 50% in weeks.
Pro tip: A low P/E is not always good. If growth is weak or falling, it's often a trap.
Example: A utility company with a P/E of 30 is probably overpriced. A tech stock with 35 might still be fair — if growth justifies it.
-----------------------------------------------------
🧠 2. PEG Ratio | Price-to-Earnings-to-Growth
What it tells you: If a high P/E is worth it based on future profit growth. Whether the earnings growth justifies the price.
Short Example: A PEG below 1 means you’re getting growth at a fair price. High PEG? You’re overpaying.
Strong: Below 1
Caution: Above 2
Industry Averages:
- Software: below 1.5 is solid
- Consumer Goods: Below 2 is more realistic
- Tech: Below 1
- Consumer Staples: Below 1.5
- Healthcare: Below 1.2
- Financials: Below 1.5
- Energy: Below 1.3
Story: In mid-2022, Salesforce’s PEG was 0.8 (P/E 35, forward EPS growth 45%) as cloud demand surged. Investors who spotted this steal saw the stock climb 130% by the end of 2024. Meanwhile, Peloton in 2023 had a P/E of 20 but near-zero growth (PEG above 3). Its stock cratered -50% as fitness trends faded.
Story: NVIDIA’s PEG hit 0.9 in Q3 2023 (P/E 30, growth 35%) during AI hype, a steal for tech (average PEG below 1.2).
PEG filters hype. A stock can look expensive until you factor in growth.
-----------------------------------------------------
🧱 3. P/B Ratio | Price-to-Book
What it tells you: How much you pay compared to what the company owns (like buildings or cash).
Short Example: A P/B below 1.5 means you’re paying close to the company’s asset value. High P/B? Expect strong profits or risk.
Strong: Below 1.5
Caution: Below 1 + poor earnings = value trap
Industry Averages:
- Banks: Below 1.5
- Insurance: Below 1.3
- REITs: Use NAV (aim below 1.2)
- Tech: Often ignored
- Energy: Below 2
Story: In 2024, JPMorgan Chase’s P/B was 1.4, solid for banks (average below 1.5). Investors who bought enjoyed 100% gains.
n 2023, Bed Bath & Beyond’s P/B fell below 1 with collapsing earnings. It looked cheap but filed for bankruptcy that year.
Tip: Only use this in asset-heavy sectors like banking or real estate.
-----------------------------------------------------
⚙️ 4. ROE | Return on Equity
What it tells you: How well a company turns investor money into profits.
Short Example: An ROE above 15% means the company makes good money from your investment. Low ROE? Weak returns.
Strong: Above 15%
Caution: Below 10% unless in slow-growth industries
Industry Averages:
- Tech: 20–30%
- Consumer Staples: 15–25%
- Utilities: 8–12%
- Financials: 10–15%
- Healthcare: 15–20%
Story: Coca-Cola (KO) has kept ROE above 35% for years, a sign of brand power and pricing strength.
Eli Lilly’s (LLY) ROE stayed above 25% from 2022–2024, a healthcare leader (average 15–20%). Its weight-loss drug Mounjaro drove consistent profits, lifting the stock 150%+ in two years. Checking ROE trends helped investors spot this winner.
Tip: If ROE is high but D/E is also high, be careful, it might just be leverage.
-----------------------------------------------------
💰 5. Net Margin | Profitability
What it tells you: How much profit a company keeps from its sales or what % of revenue ends up as pure profit.
Short Example: A 10% margin means $10 profit per $100 in sales. Low margin? Tough business or high costs.
Strong: Above 10-15%+
Caution: Below 5%
Industry Averages:
- Software: 20–30%
- Retail: 2–5%
- Manufacturing: 8–12%
- Consumer Staples: 10–15%
- Energy: 5–10%
- Healthcare: 8–15%
Story: Walmart’s (WMT) 2% net margin looks tiny — but it’s expected in retail.
A software firm with 5%? That’s a warning — high costs or weak pricing.
In 2023, Zoom’s (ZM) net margin fell to 5% (down from 25% in 2021), well below software’s 20–30% average. Pricing pressure and competition crushed its stock quite a lot. Meanwhile, Apple’s 25% margin in 2024 (tech average 20%) remained a cash cow.
Tip: Margins show whether the company owns its pricing or competes on price.
-----------------------------------------------------
💣 6. D/E Ratio | Debt-to-Equity
What it tells you: How much debt a company uses compared to investor money.
Short Example: A D/E below 1 means more investor cash than debt. High D/E? Risky if profits dip.
Strong: Below 1
Caution: Above 2 (except REITs or utilities)
Industry Averages:
- Tech: 0–0.5
- Industrials: 0.5–1.5
- REITs: 1.5–2.5 (manageable due to structure)
- Utilities: 1–2
- Energy: 0.5–1.5
Story: In 2024, Tesla’s D/E dropped below 0.3 (tech average 0–0.5) as it paid down debt, signaling strength despite sales dips - a massive rally afterward.
Tip: Rising debt + falling profits = a storm coming. Always check both.
-----------------------------------------------------
💵 7. Free Cash Flow (FCF)
What it tells you: Cash left after paying for operations and growth investments.
Short Example: Apple’s $100 billion cash pile in 2024 funded stock buybacks, boosting shares. Low cash? Trouble looms.
Strong: Positive and growing
Caution: Negative for multiple years
Sector notes:
- Tech: Lots of cash (think billions)
- Industrials: Up and down, check trends
- REITs: Look at FFO (cash from properties), aim high
- Energy: Has cash, but swings with oil prices
- Healthcare: Steady cash, not too high
Story: Netflix had negative FCF while scaling content. Once costs stabilized, FCF turned positive and stock re-rated sharply.
Pro tip: Profits don’t mean much without real cash. FCF is often more honest.
Cash is king: Companies need cash to pay bills, reduce debt, or fund growth. If FCF is falling, they might be burning through cash reserves or borrowing, which isn’t sustainable.
Potential issues : This mismatch could signal problems like poor cash collection, heavy spending, or even accounting tricks to inflate profits.
-----------------------------------------------------
🚀 8. EPS Growth | Earnings Power
What it tells you: How fast a company’s profits per share are growing.
Short Example: EPS up 10% yearly means more profit per share, lifting stock prices. Flat EPS? No growth, no gains.
Strong: Above 10%
Caution: Below 5%, flat/negative for 3+ years
Industry Averages:
- Tech: 15–30%
- Staples: 5–10%
- REITs: 3–6% (via FFO growth)
- Healthcare: 10–15%
- Financials: 5–10%
- Energy: 5–15% (cyclical)
Story: In Q1 2024, NVIDIA’s forward EPS growth of 30% (tech average 20%+) fueled a rally as AI chips dominated. Checking forward estimates helped investors avoid traps like Intel, with flat EPS and a drop.
Pro tip: A stock with flat EPS and no dividend? There’s no reason to own it.
-----------------------------------------------------
💵 9. Dividend Yield | Passive Income
What it tells you: How much cash you get yearly from dividends per dollar invested.
Short Example: A 3% yield means $3 per $100 invested. High yield? Check if it’s sustainable.
Good: ~3–4%
Red Flag: Above 6% with a payout ratio above 80-90%
Industry Averages:
- Utilities: 3–5%
- REITs: 3–6%
- Consumer Staples: 2–4%
- Tech: 0–2%
- Energy: 2–5%
-----------------------------------------------------
💡 Final Thought: How to Use All of This
Top investors don’t use just one metric. They look at the whole picture:
Good growth? Check PEG.
Good profits? Confirm with ROE and margin.
Safe balance sheet? Look at D/E and cash flow.
Fair valuation? P/E + FCF Yield + P/B.
Real power = Combining metrics.
A company with P/E 15, PEG 0.8, ROE 20%, low debt, and positive FCF? That’s your winner.
A stock with P/E 8, but no growth, high debt, and negative cash flow? That’s a trap.
-----------------------------------------------------
Real-World Combos
🎯Winners:
Tech Gem: P/E 20, PEG 0.8, ROE 25%, D/E 0.4, growing FCF, EPS 20%+ (e.g., NVIDIA 2023: AI-driven growth, stock soared).
Energy Steal: P/E 15, P/B 1.5, FCF positive, Dividend Yield 3.5% (e.g., Chevron 2023: Cash flow king).
⚠️Traps:
Value Trap: P/E 8, flat EPS, D/E 2.5, negative FCF (e.g., Peloton 2023).
Overhyped Tech: P/E 50, PEG 3, Net Margin 5%, D/E 1.5 (e.g., Rivian 2024).
-----------------------------------------------------
🚀 Share your own combos!
What do you personally look for when picking a stock?
If you spotted something off in the numbers, or have a valuable insight to add — please, drop it in the comments.👇
💡 Let’s turn this into a thread that’s not just good but superb and genuinely helpful for everyone.
-----------------------------------------------------
Final Thought
“Buy great companies at fair prices, not fair companies at great prices.” – Warren Buffett
This guide gives you the map.
Charts, tell you when.
These numbers tell you what, and why.
And this post?
It’s just the beginning!
These 9 metrics are part one of a bigger series I’m building — where we’ll go even deeper, with more advanced ratios, smarter combos, and real case studies.
If this guide helped you see financial numbers a little clearer, there’s a good chance it’ll help your investor friend too, especially if they’re just starting their journey...🤝Share it with them!
I built this as much for myself as for anyone else who wants to get better.👊
If you made it this far — thank you! 🙏
...and super thankful if you hit "The Boost" on this post 🚀
Cheers,
Vaido

COAL INDIA , BUY signal hey guys ,
COAL INDIA stock is showing BULLISH SIGNS
this stock was moving in a pattern called TRIANGLE PATTERN 📐 ,
this stock has tried many times to break that TRIANGLE PATTERN
and now the time has come .
The stock has crossed it's resistance
and it has rested also
And now we can see A GREAT BIG GREEN CANDLE present by this stock
Also , the 20 day ema is above the 50 day ema
this shows that this stock is in a uptrend.
I have marked the RR RATIO , TARGET AND SL for y'all
try to trade according to that ratio or you can adjust it according to you .
BUT FIRST CONSIDER THE GLOBAL MARKET SITUATIONS
1. INFLATION
2. WAR
3. RISING BANK RATES
YOU CAN INVEST KN THAT STOCK
BECAUSE
PROFITS ARE INCREASING
AND THE REO RATIO IS 40%
THEREFORE, TRY TO BUY THAT STOCK
😀😀

PER, PBR, ROE, EPS Explained for Beginner InvestorsLegendary stock investor Peter Lynch once said that there’s a reason why the majority of people make money in real estate, but not in the stock market.
People spend months on finding the right property, whereas in choosing the right stock to invest in, they only spend a few minutes.
In this post, I'll be explaining the concepts of:
1) Price Earnings Ratio (PER)
2) Price-to-book Ratio (PBR)
3) Return on Equity (ROE)
4) Earnings per Share (EPS)
by explaining the formula, what they tell us, and the best way to understand these concepts through an example.
Return on Equity (ROE)
So let’s start with the Return on Equity, or ROE.
This measures the profitability of a company in relation to stockholder’s equity.
The ROE is calculated by dividing the net income by the shareholder’s equity.
Price Earnings Ratio (PER)
Next, we have the price earnings ratio, or the PER.
This is a good tool to determine whether a company is overvalued.
The PER is calculated by dividing the current share price by earnings per share.
For instance, if a company’s share price is at $100, and their earnings per share is $10, this gives them a PER of 10.
Price-to-book Ratio (PBR)
Then, we take a look at the price to book-value ratio, or the PBR.
This measures the market’s valuation of a company relative to its book value, and is calculated by dividing the market price per share by the book value per share.
Earnings per Share (EPS)
Lastly, the EPS, or earnings per share.
This is simply the company’s profit divided by the outstanding number of shares outstanding, and works as a good indicator of how profitable a company is.
Example
- Let’s take a look at an example to help your understanding.
- You currently have $100,000, and you decide to open a restaurant.
- You are required to pay $100,000 in deposits, and $3,000 in monthly rent.
- You started this restaurant in the form of a limited liability company.
- You started the company with $100,000.
- Given that you issue shares that are worth $10, you issue 10,000 shares in total.
- A year later, you check how well your business has done.
- You find out that the restaurant did $300,000 in revenue, and after subtracting all costs, you’re left with $30,000.
- With this, you can calculate the return on equity by dividing 30,000 by 100,000, which gives you an ROE of 30%.
- Through the ROE, you look at how much return your own money was able to generate in profits.
- From the perspective of an investor, the higher the ROE, the better.
- You can also calculate the EPS, or earnings per share.
- In this case, the restaurant generates $30,000 in profits.
- So if we divide that by the number of shares, which is 10,000, we get an EPS of $3.
- Now let’s assume that you ran the business for 3 years, and you now want to sell your business to someone else, so you can move on to do other things.
- How much do you want to sell the restaurant for? After 3 years, you now have loyal customers, and it consistently generates $30,000 in profits every year.
- So, you decide to sell the restaurant for $200,000 in total, with a $100,000 premium on top of the deposit.
- If someone buys the restaurant for that price, it means that you and the other party agrees that the business is worth $200,000.
- Now if this restaurant is sold for $200,000, that means the $10 shares you hold are sold for $20.
- When we invest in stocks, this is how we make money.
- With all the information above, we can calculate the PER and PBR.
- If a restaurant that generates $30,000 in net profits gets sold for $200,000, the PER is 6.7.
- And then, we also have the PBR.
- You started the business with $100,000 of your own money, and sold it for $200,000, which gives you a PBR of 2
- For the PER and PBR, the lower the better.
- A low PER means that you are buying a company that generates a lot of net profit for a cheap price.
- Same for the PBR. The lower it is, the more undervalued it is.
Conclusion
The PER, PBR, ROE, and EPS can be great tools to help us identify whether a stock is a good buy or not. Understanding these concepts are imperative for beginner investors.
If you like this educational post, please make sure to like, and follow for more quality content!
If you have any questions or comments, feel free to comment below! :)

BUY VEN NOWAs you see, VEN is protecting its upward trend in long run, of course BTC collapses effect it but it stays strong.
It's low price now and huge potential for one week etc.
