Rose Break out 4H Price bounced off the 200MA before wicking off the .618 Fib retracement level and breaking the channel resistance afterwards. RSI and Stochastic look good on the 4H and D.
ATOM and Near also look good, if not better even. I'm buying the retest
If Bitcoin allows it.
ROSEUSDT

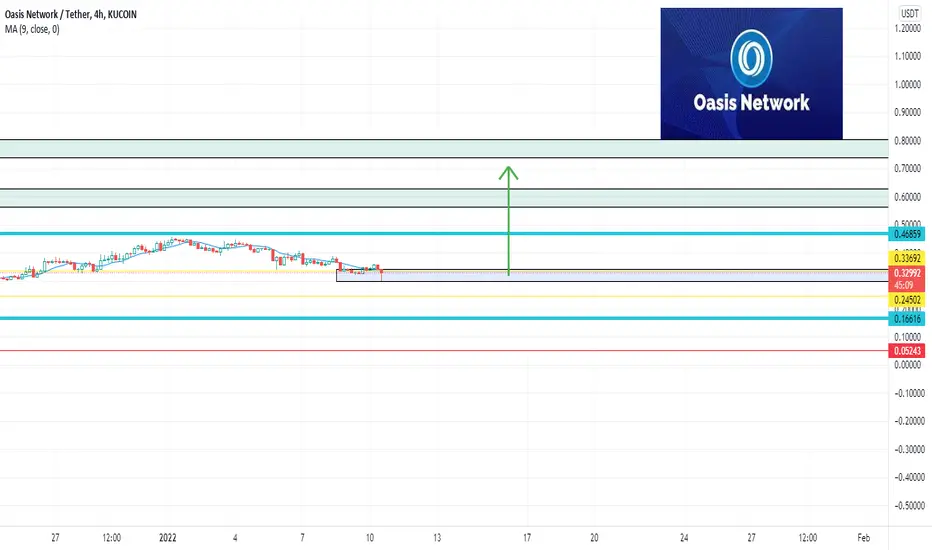
Trend expecting price predication end 2022-oasis network $ 7-11 Hello trading friends,
This is an open free price prediction trend for the oasis network end 2022.
it's fully an expecting trend depending on some trends. and made for just to check it back later.
I see it as a small challenge to watch it back at end of 2022. but know that you should not go from this side study, as it can also be wrong. we don't know the future, the only we do here are expect depending on data trends.
End 2022 I will look a check to it, to see where it did end.
Expecting price action for this coin is between 7 USD and 11 usd+ for end 2022.
That's a huge increase trend, this depending also on the green cycle trend.
Have a great day, next update on this coin here is at the end of 2022.
know that this is a long-term project.
This is not a trading call, but a free-expecting idea and made to check later.

Dip buying before breakout oasis network depending on 2022 cycleHello trading friends,
oasis network entering the first dip-buying for the next green cycle 2022
This is an interesting project what could change hugely from a place above 80
Watch trend will follow this coin with the new cycle of 2022
Manage your risk well, and have great times.
# this is not a trading call, study always the trends by yourself very fine before entering any trade.
Oasis Network is an interesting coin that could show effect 2022Hello trading friends,
The goal of this view is not a trading call, but educationally content to show that there is expected depending on data on the Oasis network. we see a trend on this coin that we did saw before on increasing coins, which makes this coin an interesting one.
this chart predicts that it can be an option that Oasis Network can have some trend buys in back trend below 0,30, but it's not a must that this should happen. the main goal is that it's an interesting coin depending on trends.
if trend returns to levels as 0,32 0,23 and 0,16 then its an interesting targets also for dollar-cost avenge.
And if the trend goes further on increase trend - then we could see 0,50 - 0.80 usdt price action.
❌Never enter in any coin 100% of your assets, and manage the risk depending on what you can handle.
💎This coin is great for Spot and it could be for the long term a great option.
These coins are just a small part of more coins that could succeed in 2022.
- It's always possible that we can get a recovery of the coin and the target shared here above if that happened - but same time about the TA trends the trend showing green and growing further to possibly the next increase level.
in all ways where the coin will go could frst - it's an interesting pickup for the long term.
Have a great day

ROSE | Long-term Support ZonesOasis Labs, a upcoming privacy layer 1 superstar with all-start backing, showing a clear steady uptrend on a daily and weekly chart that is easy to trade.
It is approaching buy level once again, after upwards action to 0.34$ last week. As usual, follow the trend 0.22-0.24$ put SLs below if you are trading. Current level is attractive to maintain higher lows. However, we could see wick all the way to 0.21-0.22 without close and maintain uptrend.

ROSE (Oasis Network) Coin Analysis 29/05/2021Fundamentals:
Designed for the next generation of blockchain, the Oasis Network is the first privacy-enabled blockchain platform for open finance and a responsible data economy. Combined with its high throughput and secure architecture, the Oasis Network is able to power private, scalable DeFi, revolutionizing Open Finance and expanding it beyond traders and early adopters to a mass market. Its unique privacy features can not only redefine DeFi, but also create a new type of digital asset called Tokenized Data that can enable users to take control of the data they generate and earn rewards for staking it with applications — creating the first-ever responsible data economy.
Separates consensus and execution into two layers — the Consensus Layer and The ParaTime Layer — for better scalability and increased versatility.
Separation of consensus and execution allows multiple ParaTimes to process transactions in parallel, meaning complex workloads processed on one ParaTime won’t slow down faster, simpler transactions on another.
The ParaTime Layer is decentralized, allowing anyone to develop and build their own ParaTime. Each ParaTime can be developed in isolation to meet the needs of a specific application, such as confidential compute, open or closed committees, and more.
The network’s sophisticated discrepancy detection makes Oasis more efficient than sharding and parachains — requiring a smaller replication factor for the same level of security.
The network has broad support for confidential computing technology. The Oasis Eth/WASI Runtime is an open source example of a confidential ParaTime that uses secure enclaves to keep data private while being processed.
Privacy-Enabled Blockchain: The Oasis Network claims to the world’s first scalable, privacy-enabled blockchain. ParaTimes on the Oasis Network can leverage confidential computing technology such as secure enclaves to keep data confidential — unlocking new use cases and applications for blockchain.
Scalable, Private DeFi: The Oasis Network’s privacy-first design can expand DeFi beyond traders and early adopters — unlocking a new mainstream market. Plus its innovative scalability design brings fast speeds and high-throughput to DeFi transactions.
Enables Data Tokenization: The Oasis Network can Tokenize Data, unlocking game-changing use cases for blockchain, and an ecosystem of apps and projects on the network — powering the next generation of privacy-first applications.
Rapidly Growing Community: The Oasis Network has a thriving community of close to a thousand node operators, developers, enterprise partners, ambassadors, and nearly ten thousand community members engaged in global social channels.
Top-Tier Team: The Oasis Team is made up of talent from around the world with backgrounds from Apple, Google, Amazon, Goldman Sachs, UC Berkeley, Carnegie Mellon, Stanford, Harvard, and more — all committed to growing and expanding the impact of the Oasis Network.
Supply: The ROSE native token is a capped supply token. The circulating supply at launch will be approximately 1.5 billion tokens, and the total cap is fixed at 10 billion tokens.
Token utility: The ROSE token will be used for transaction fees, staking, and delegation at the Consensus Layer.
Staking rewards: ~2.3 billion tokens will be automatically paid out as staking rewards to stakers and delegators for securing the network over time.
The live Oasis Network price today is $0.071249 USD with a 24-hour trading volume of $10,335,217 USD. Oasis Network is down 12.29% in the last 24 hours. The current CoinMarketCap ranking is #297, with a live market cap of $106,873,116 USD. It has a circulating supply of 1,500,000,000 ROSE coins and a max. supply of 10,000,000,000 ROSE coins.
Technical Analysis1:
the coin has completed a Bullish cycle and now is reaccumulating at the lower levels.
we have defined few Targets for its next Impulsive cycle when the coin has done its reaccumulation with Fibonacci Expansion.

ROSEUSDT - Perspective of a Value BuyerRunning through a value buy scenario on ROSE if macro sets up for further correction. Spot accumulation setup, no leverage.
Shoutout to @thecryptosniper for HVF theory, elements of which are used in my analysis (grindline theory, legacy HVF levels as KLoS). Note this is not *pure* HVF theory (as current ROSEUSDT pattern is not compliant) which would give us proper and specific entry, exit and targets to allow leveraged scaling, rather than just a general accumulation zone as indicated here.
Tools used:
Volume by Price (VBP): identifies price control areas which act as support/resistance, and likewise "pockets" where price is likely to slide through without much trouble.
Key Levels of Significance (KLoS): Legacy inflection points, points of control, the like.
Point of Control (PoC): Axis of VBP fluctuations - price will have many interactions on these, and they often serve as support/resistance later.
Grindline: Typically called "trend line" but implications are more precisely defined in HVF theory.
Fibonacci Retracement: Voodoo magic.
Current fib retrace is taken from recent ATH in November 2021 to the low in June 2021 correction.
Legacy PoC still dominant:
There is a value buy zone sitting within the 0.18-0.21 range via a confluence of indicators. Legacy PoC has re-affirmed around the 0.20 level since the conclusion of the summer correction. Local PoC has, within the past week, shifted from the 0.20 level to just above the 0.5 fib, showing further strength (and potentially signalling that 0.20 may not be revisited). The 0.20 PoC level sits on top of the 0.382 fib and coincides with a prior HVF. Barring the start of a crypto bear market, the zone around the 0.20 PoC is likely the limit of discount we can potentially see within the coming weeks.
For a return to the zone around 0.20 to occur, another downleg in BTCUSDT to the 42k-43k range is likely required (and at present, still within the realm of possibility). Otherwise, the local PoC should be treated as "best value" in the context of a continuing bull market.

ROSEUSDT 1D TA : 01.07.22 : $ROSEAll supports and resistances are marked on the chart. As we can see, the price is in an important range and recommended to keep an eye on it ...
Follow our other analysis & Feel free to ask any questions you have, we are here to help.
⚠️ This Analysis will be updated ...
👤 Arman Shaban : @ArmanShabanTrading
📅 07.Jan.22
⚠️(DYOR)
❤️ If you apperciate my work , Please like and comment , It Keeps me motivated to do better ❤️

ROSEUSDT LONGtarget in picture
entry 37.5
stoploss 34
high risk
always dyor and happy profit
market still unstable

ROSEUSDT 1D ENTRYEntry at 0.2 and TP 0.4 +85% with RSI confirmation.
@QuinientosPesos
CoinUniveristyA.

OASIS ROSE - Bull Flag / Ascending Triangle - $0.65 next?ROSE bounced nicely off the upward sloping trendline at about $0.24, and made a gradual healthy climb up to $0.45, where it has met resistance at the previous ATH. Currently ROSE is beginning to form a bullish ascending triangle and possibly gearing up for its next move up.
If ROSE can break up from the triangle, it will meet critical resistance at the top of the large channel at about $0.50. If it can clear the channel, the technical price target for the bull flag would be about $0.65.
However, if ROSE breaks down from here, the next level of support would be $0.36, which was a previous ATH and the 0.236 Fibonacci level. Since the RSI on all timeframes has plenty of room overhead, I don't expect to see any significant downside, barring a large drop in BTC.

ROSE - Next moves, possible falling wedge and levels to watch Continuing my analysis on ROSE, possible falling wedge in formation. BTC is pressing lower support so we might anticipate a drop or an impulse up.
If we fall further I am watching two key points:
a possible falling wedge bounce at the minor support around 0.24
If we see a serious impulse down, 0.23 has acted as good support but will be looking to deeper support around the 0.20 level, targeting 0.27 on the bounce
Impulse up we can anticipate strong resistance again around the 0.3 and potential declining trend confluence, this will be my profit target
(BTC sideways consolidation will likely be favorable for ROSE too).
Will update on Macro formation as it develops further


It is now at the all-time high resistance areaOn a 4-hour TF, it is now at the all-time high resistance area. If it breaks the $ 0.47 line, it is in price discovery mode, and we'll see a good rally. ROSE is taking support at the uptrend line, and if this is broken, then the next major support is $ 0.336 - $ 0.356 area. If you are looking for a new position, then wait for either break of the resistance or a retest of the support area.

DICRECTION: UP or DOWN?Rose is trading in a high-risk zone for the last couple of weeks, which in fact yielded high returns. However, nothing lasts forever. We are about to confirm the direction of the new/existing trend. Prepare yourself for a possible correction. Trade Safe!

ROSE/USDT Rose/usdt on 4h Timeframe making harmonic Bearish Bat
- TP 1 = 0.335
- TP 2 = 0.24
- SL = 0.45583
DYOR

rose reversalrose/usdt headed towards ath topping out near resistance heading back down to wards support

ROSE/USDT ChartHi, I try to post often so if you could follow, like and comment it would mean a lot to me.
ROSE had a solid run from 0.24$ to 0.44$ and now we can identify a short set-up similar to SUSHI. The coin has multiple bearish divergences in the 4H chart so we can definitly take a short position in the lower time frames. The RSI on the 1D chart also shows that the market is going down and we can see a top sign. The crypto market today is down and after hitting a new ATH SPX is also down today. Tomorrow I will post A BTC chart showing everything that I think will happen in 2022 so I hope I see you there. I will also wish a happy new year to everyone and I hope that in 2022 everyone can achieve their goals. Thanks!

ROSE - would you buy here?So, ROSE did 90% in 11 days and is already showing signs of rejection exactly at HTF range high. It is a good buy, right? KEKW
Alright, back to being serious.I am seeing potentional cup and handle pattern or double top.
I will be watching for bounce from 0.36-0.38 or rejection there - MARKET will soon tell us, I got a feeling :D
I tried to draw some projections of both scenarios - do not expect it to play out in exact sample, but somehow similarly.
OR I might be completely wrong and we make $1 - just sharing my POV. Cheers :)

roseusdt long (my flower)According to Fibo, there is room for growth up to 1.33
The double bottom pattern also helps with that and allows for better growth
There is good news in terms of fundamentals
It is set to launch a decentralized exchange in January
The probability of growth of this currency is very high

$ROSE, Crossed over the last resistance prior ATH at ~36 cents$ROSE
Crossed over the last resistance prior ATH at around ~36 cents
Volume growing over the last 15 days while UCTS just printed a new 1D Buy signal (usually strong)
If manages to hold/flip this area, then ~20% toward a new ATH
#ROSE

Oasis Network (ROSE) Hi there
What's up fellas?
whos remember my first ROSE chart? from 0.04 to 0.4, 10000% less than a year so it deserves another chart now
Oasis Network (ROSE) is a privacy-focused layer 1 blockchain built for open finance and a responsible data economy using the Cosmos SDK. That will allow Oasis to interact with the ecosystem of the Cosmos (ATOM)-enabled blockchain when its Inter Blockchain Communication Protocol launches. Oasis prioritizes use cases that promote data privacy and user confidentiality and aims to power private, scalable DeFi and expand it beyond traders to the mass market. Oasis achieves high throughput and boasts a secure architecture by separating the contract settlement and consensus layers. This separation of layers allows the blockchain to support multiple, customizable runtimes (ParaTimes). It is similar in its architecture to the structure of Avalanche or Polkadot, connecting several different blockchains within one ecosystem. there is nothing between me and Dawn Song bytheway!
right now all you need to do is check higher time frames and spend more time with your family
congrats to our 1.3 billion dollar marketcap
are you ready for 2022?

ROSEUSDTHello Crypto Lovers,
Mars Signals team wishes you high profits.
W are in the daily time frame. We gave you this signal when the price was at the support line and told you that it has made an inverse head-and-shoulder pattern and it is very likely for the price to go up. Now you can see that the price has gone as we expected and has also broken the neckline. Therefore it can go up a little more to its previous high.
Warning: This is just a suggestion and we do not guarantee profits. We advise you to analyze the chart before opening any positions.
Wish you luck
