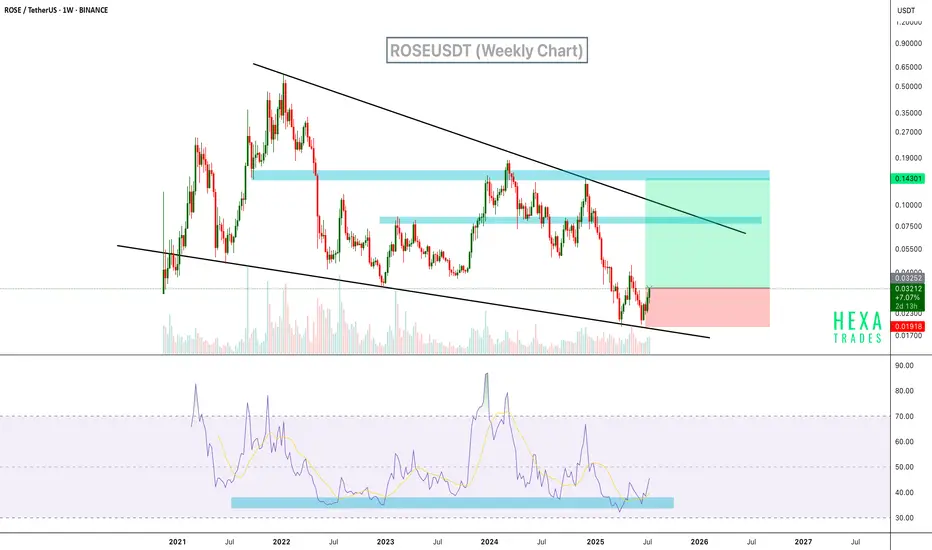
ROSEUSDT Rebounds from Wedge Support BINANCE:ROSEUSDT is currently trading within a long-term descending wedge on the weekly chart, a classic bullish reversal pattern. Price recently bounced off the lower wedge support with strong momentum. Additionally, the RSI indicator has rebounded from a historically strong support zone in the oversold region, which has previously signaled major bottoms.
Resistance 1: $0.048
Resistance 2: $0.075
Resistance 3: $0.145
Cheers
Hexa
Roseusdtsignal
ROSE/USDT Descending Triangle Breakout – Trend Reversal📊 Pattern Analysis – Descending Triangle at the End of Downtrend
ROSE/USDT has been forming a descending triangle pattern since late December 2024. This pattern features:
🔽 Downward sloping resistance: A descending trendline tested multiple times (5+ touches), showing strong validity.
🔲 Horizontal support zone: Price has held firm between $0.02200 - $0.02400, acting as a key demand area since March 2025.
Although descending triangles are often continuation patterns, in this context — appearing after a long-term downtrend — it increases the probability of a bullish reversal if the breakout confirms.
🚀 Bullish Scenario – Potential for Strong Rebound
If ROSE breaks above the descending trendline:
✅ Breakout Confirmation: Daily candle close above $0.02600 - $0.02800 with strong volume
📈 Bullish Targets (based on previous resistance zones & pattern projection):
$0.03140 – Minor resistance and former structure
$0.03477 – Previous high from May 2025
$0.04222 – February consolidation range
$0.04700 – Key prior distribution zone
$0.06191 – Primary target from triangle breakout (measured move)
$0.08453 and above – Potential extended rally if strong momentum follows
The reward-to-risk ratio is highly favorable on confirmation of a breakout.
🧨 Bearish Scenario – Breakdown Threat Looms
If ROSE fails to break out and instead closes below the horizontal support at $0.02200:
⚠️ This would signal a bearish continuation
📉 Potential drop to:
$0.01920 – The current multi-month low (key support level)
Breakdown of this level would mark a new lower low, confirming ongoing bearish trend
Caution is advised if volume increases during a breakdown.
🔍 Technical Insights:
Price is squeezing at the apex of the triangle — a breakout is imminent
Volume is still relatively low, suggesting accumulation or indecision
A volume spike will likely precede a confirmed breakout move
Market is at a decision point — either a trend reversal or continuation
🧠 Conclusion:
ROSE/USDT is on the edge of a major move. The descending triangle has matured, and a breakout in either direction could trigger a significant price reaction. Traders should monitor this setup closely as the breakout may occur within days.
#ROSEUSDT #CryptoBreakout #DescendingTriangle #TechnicalAnalysis #AltcoinSetup #ChartPattern #CryptoTrading #BullishReversal #BearishScenario #PriceAction #BreakoutAlert

ROSEUSDT 1WROSE ~ 1W Analysis
#ROSE This is the lowest support for now. Buy from here if you still have a Conviction on this coin with a minimum target of 20%+.

ROSE/USDT Price Breakout: Bullish Continuation in PlayROSE/USDT pair has successfully broken above a key descending trendline, signaling a potential bullish reversal.
The price has reclaimed the $0.08-$0.09 support zone, which is now acting as a strong base for further upward movement.
DYOR, NFA

ROSEUSDT: Catching the Retracement for a Potential Big Move!!ROSEUSDT has shown promising signs of a potential bullish continuation. After a successful bounce from a major support level, the price consolidated briefly before a strong breakout yesterday, pushing through resistance. Today's retracement to the broken resistance level (now acting as support) presents a potential entry opportunity for traders. Always manage your risk and use appropriate position sizing.
BINANCE:ROSEUSDT Currently trading at $0.092
Buy level: Above $0.09
Stop loss: Below $0.076
Target : $0.18
Max Leverage 3x
Always keep Stop loss
Follow Our Tradingview Account for More Technical Analysis Updates, | Like, Share and Comment Your thoughts

ROSEUSDT 1WROSE ~ 1W
#ROSE Again rejected from this resistance line. If you still have Conviction on this coin,. This support block would be a very good buying place for now.

ROSEUSDT Bullish Channel Breakout!ROSEUSDT Technical analysis update
BINANCE:ROSEUSDT has formed a descending channel, and the price is now moving toward the channel resistance for a potential breakout. The price is trading above the 100 and 200 EMAs on the daily chart, indicating a bullish signal. A breakout above the channel could lead to a strong upward move.
Entry level: Below $0.086
Stop Loss: $0.068
Regards
Hexa

ROSEUSDT Bullish Surge or a Risky Rejection? Key Levels Area!Yello, Paradisers! Could #ROSEUSDT be on the brink of a major breakout or facing a critical setback? Here's the breakdown:
💎#ROSE has formed a three white soldiers pattern, a classic and powerful bullish indicator. If it successfully breaks out of the descending channel, we could see the price push upward to the key resistance level, confirming a potential Cup and Handle formation. Should ROSE break this resistance, it would solidify the bullish case, with a significant move toward the supply zone as the target.
💎However, if ROSE gets rejected at the descending channel resistance, we might witness the price testing the support zone between $0.066 and $0.062. A rebound from this area would set the stage for another attempt at breaking out of the descending channel.
💎The situation turns concerning if ROSE fails to rebound from the support and breaks down further. This could lead the price to revisit the demand area or even test the major support zone between $0.0524 and $0.049. A rebound from this level and a reclaim of the $0.06 support would be crucial for maintaining the bullish scenario. Conversely, if ROSE breaks below this major support with a daily close under it, it would confirm a bearish shift, potentially pushing the price into a deeper dip.
Consistency is key, Paradisers! Focus on strategic planning, disciplined trading, and the highest probability setups to stay ahead. Keep your eyes on these critical levels and trade smart!
MyCryptoParadise
iFeel the success🌴

ROSEUSDT Bounces Back, Targeting $0.10 After Strong Support TestAfter successfully testing key support levels, ROSE/USDT is showing bullish momentum as it begins to bounce back. With strong buying interest emerging, the price action suggests a potential rally towards the $0.10 mark. Traders should watch for confirmation of this trend, as further upward movement could present profitable opportunities.
ROSEUSDT Currently trading at $0.069
Buy level: Above $0.069
Stop loss: Below $0.0615
TP1: $0.072
TP2: $0.082
TP3: $0.09
TP4: $0.1
Max Leverage 5x
Follow Our Tradingview Account for More Technical Analysis Updates, | Like, Share and Comment Your thoughts

ROSEUSDTROSE ~ 1W ✅
#ROSE Make purchases gradually after breaking through the resistance line of this descending pattern.
ROSEUSDTROSE ~ 1W ✅
#ROSE If you are given a second chance and the price reaches this demand zone,. you don't hesitate to buy it. this is a very good bottom price.

ROSEUSDT Primed for Major Bullish Surge:75% Upside Potential!The ROSEUSDT trading pair is showing strong signs of an impending bullish wave, presenting a compelling buying opportunity for traders. With technical indicators aligning, there is a potential target upside of 75%. As always, it’s crucial to implement a stop-loss strategy to manage risks effectively.
ROSEUSDT (1D Chart) Technical analysis
ROSEUSDT (1D Chart) Currently trading at $0.105
Buy level: Above $0.104
Stop loss: Below $0.89
TP1: $0.115
TP2: $0.135
TP3: $0.155
TP4: $0.185
Max Leverage 3x
Always keep Stop loss
Follow Our Tradingview Account for More Technical Analysis Updates, | Like, Share and Comment Your thoughts

OASIS Rose Technical Analysis and Trade IdeaOn the daily timeframe, we observe a double bottom formation that has experienced a spike below into liquidity. This situation suggests the potential for a trend reversal. If this scenario unfolds, there's an opportunity to buy at a substantial discount and capitalize on an early entry before a bullish rally (assuming my analysis proves accurate). In the video, we delve into trend analysis, market structure, price action, and other critical aspects of technical analysis. I share my perspective on accumulating and entering this market, emphasizing the importance of prudent risk management. Remember, this content is purely educational and not financial advice. 📈🚀🔍

ROSEUSD 12HROSE ~ 12H
#ROSE We pay attention #ROSEUSD This chart looks interesting for the 12H time frame.
In terms of pattern, BCBA:ROSE has succeeded in breaking through the resistance of this pattern.

ROSE, Where are you going?Hello, guys.
This is ESS team.
Let's check the ROSE chart.
:::::::::::::::::
This is ROSEUSDT's 1H chart.
Now, ROSE is showing a falling Price Action while lowering the recent highs and lows.
If it breaks down the 4H's uptrend line or order block zone and is retested at these, You can expect candles make a new low.
If it is supported by 4H's uptrend line and rise up,
You can safely enter a long position when It breaks through the GREEN downtrend line.
Have a nice trading!

ROSE Holders! FOLLOW ME~!Hi, guys.
This is ESS team.
Let's check ROSEUSDT.
It's NOT breaking through the RED downtrend line and currently, falling down.
If the candle starts to rebound on the GREEN channel,
It will reach the green upward trend line's TOP, and If it doesn't break through the RED downward trend line, It will be able to look for rise near the bottom of the ORANGE channel after accumulation.

ROSEUSDT Signals Up move Following Breakout and Retracement.Anticipating a bullish surge for ROSEUSDT as it shows promising signs of upward movement after a breakout and subsequent retracement in the higher time frame.
Always keep Stop loss and Optimize risk with disciplined position sizing.
ROSEUSDT (4h Chart) Technical analysis
ROSEUSDT (4h Chart) Currently trading at $0.079
Buy level: Above $$0.0785
Stop loss: Below $0.072
TP1: $0.088
TP2: $0.095
TP3: $0.1
TP4: $0.115
Max Leverage 3x
Always keep Stop loss
Follow Our Tradingview Account for More Technical Analysis Updates, | Like, Share and Comment Your thoughts

ROSEUSDTBINANCE:ROSEUSDT Short idea
⛔"Daily crypto market analyses I provide are personal opinions & not financial advice. Trading carries risks, so do your own research & seek advisor's help. #DYOR
Don't forget to 🚀 and comment

ROSEUSDT Expecting Upmove Following Breakout and Retracement!!After a successful breakout and retracement, anticipate a substantial upward movement for ROSE/USDT. Hold onto your position firmly, but remember to implement a stop loss for risk management.
ROSEUSDT (1W Chart) Technical analysis
ROSEUSDT (1W Chart) Currently trading at $0.116
Buy level: Above $$0.115
Stop loss: Below $0.093
TP1: $0.135
TP2: $0.15
TP3: $0.17
TP4: $0.2
Max Leverage 2x
Always keep Stop loss
Follow Our Tradingview Account for More Technical Analysis Updates, | Like, Share and Comment Your thoughts

High-risk position (ROSE)❤️❤️Thanks for boosting 🚀 and supporting us!
📈3-hit to trendline for sell
📊 (Entry) : 0.1205
🔴 Stop Loss : 0.1229
🎯 Take Profit : 0.1174-0.1150
🔗 For more communication with us, In the footnote and send a message in TradingView.
👨🎓 Experience and Education: Our trading team has five years of experience in financial markets, especially cryptocurrencies.

ROSEUSDT Elliott Waves AnalysisHello friends.
Please support my work by clicking the LIKE button👍(If you liked). Also i will appreciate for ur activity. Thank you!
Everything on the chart.
Entry: market and lower
Targets: 0.09 - 0.11 - 0.14
after first target reached move ur stop to breakeven
Stop: ~0.046 (depending of ur risk). ALWAYS follow ur RM .
RR: 1 to 7
risk is justified
Good luck everyone!
Follow me on TRADINGView, if you don't want to miss my next analysis or signals.
It's not financial advice.
Dont Forget, always make your own research before to trade my ideas!
Open to any questions and suggestions

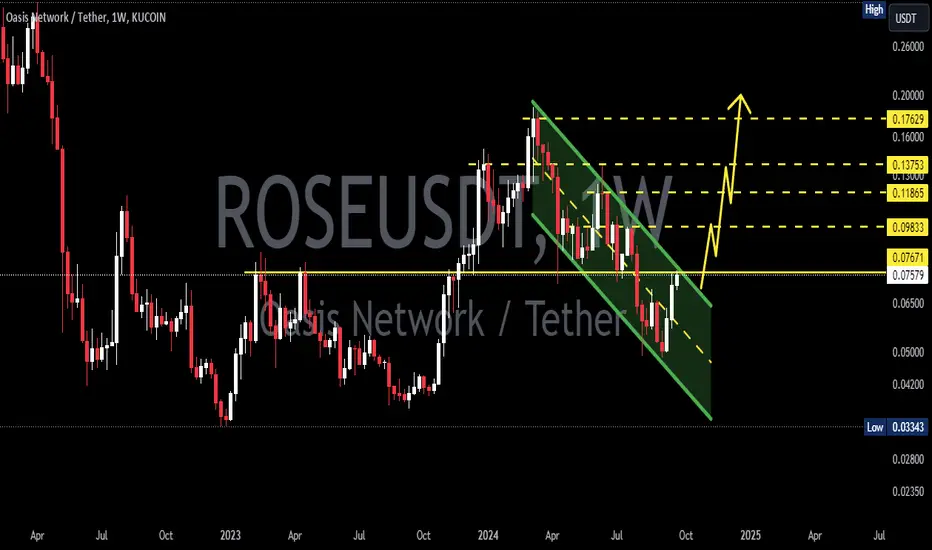
Rose | Expecting Breakout Roseusdt
Buyers activity is visible, it seems that the Falling Wedge Pattern will break successfully
30-50% bullish move is expected in case of breakout.
Remember: We only give ldea's from our
experience and knowledge, it does not
mean that it will be 100% correct, the
market is always unpredictable, anything
can happen anytime.
Always trade with your own research and
knowledge. If You Are Satisfied With Our
Work & Need Complete Entry Targets Then Join

ROSEI think the decline will continue for Rose. As in many crypto instruments, I believe that a similar structure in rose will come towards the range I marked.
